Other heart diseases
There are many diseases of the heart, in addition to ischemic heart diseases. Examples of such conditions include:
- pulmonary heart disease: where high blood pressure in the blood vessels leading to the lungs can cause an enlargement and failure of the heart
- congenital heart diseases: where a person is born with a heart defect
- cardiomyopathy: where the heart muscle is abnormal
- arrhythmias: where the heart chambers do not beat in a proper, coordinated rhythm
- heart failure: where the heart is weakened and cannot pump blood efficiently
- cardiac arrest: where the heart stops beating completely
- hospitalization by geographic area
- hospitalization by Greater Sudbury and outlying areas
- hospitalizations by sex
- by age group
- deaths by geographic area
- potential years of life lost (PYLL) by geographic area
Other heart diseases hospitalizations by geographic area
Key findings
- In the Sudbury & District Health Unit (SDHU) area, there were 1,107 hospitalizations due to other heart diseases in 2013.
- In 2013, the rate of hospitalization due to other heart diseases in the SDHU area was 459 hospitalizations per 100,000 population.
- The rate of hospitalization due to other heart diseases in the SDHU area has been generally slightly lower to that in northeastern Ontario, while rates in both areas have been consistently higher than the rate in Ontario.
- Between 2004 and 2013, the rate of hospitalization due to other heart diseases in the SDHU area has generally decreased.
Notes:
- Rates are age-standardized using the 2006 Canadian population.
- Data Source: Inpatient Discharge Data and Population Estimates and Projections, Ontario Ministry of Health and Long-Term Care, IntelliHEALTH Ontario, Extracted April 2015.
Figure: Annual age-standardized hospitalization rate, other heart diseases, by geographic area, 2004-2013
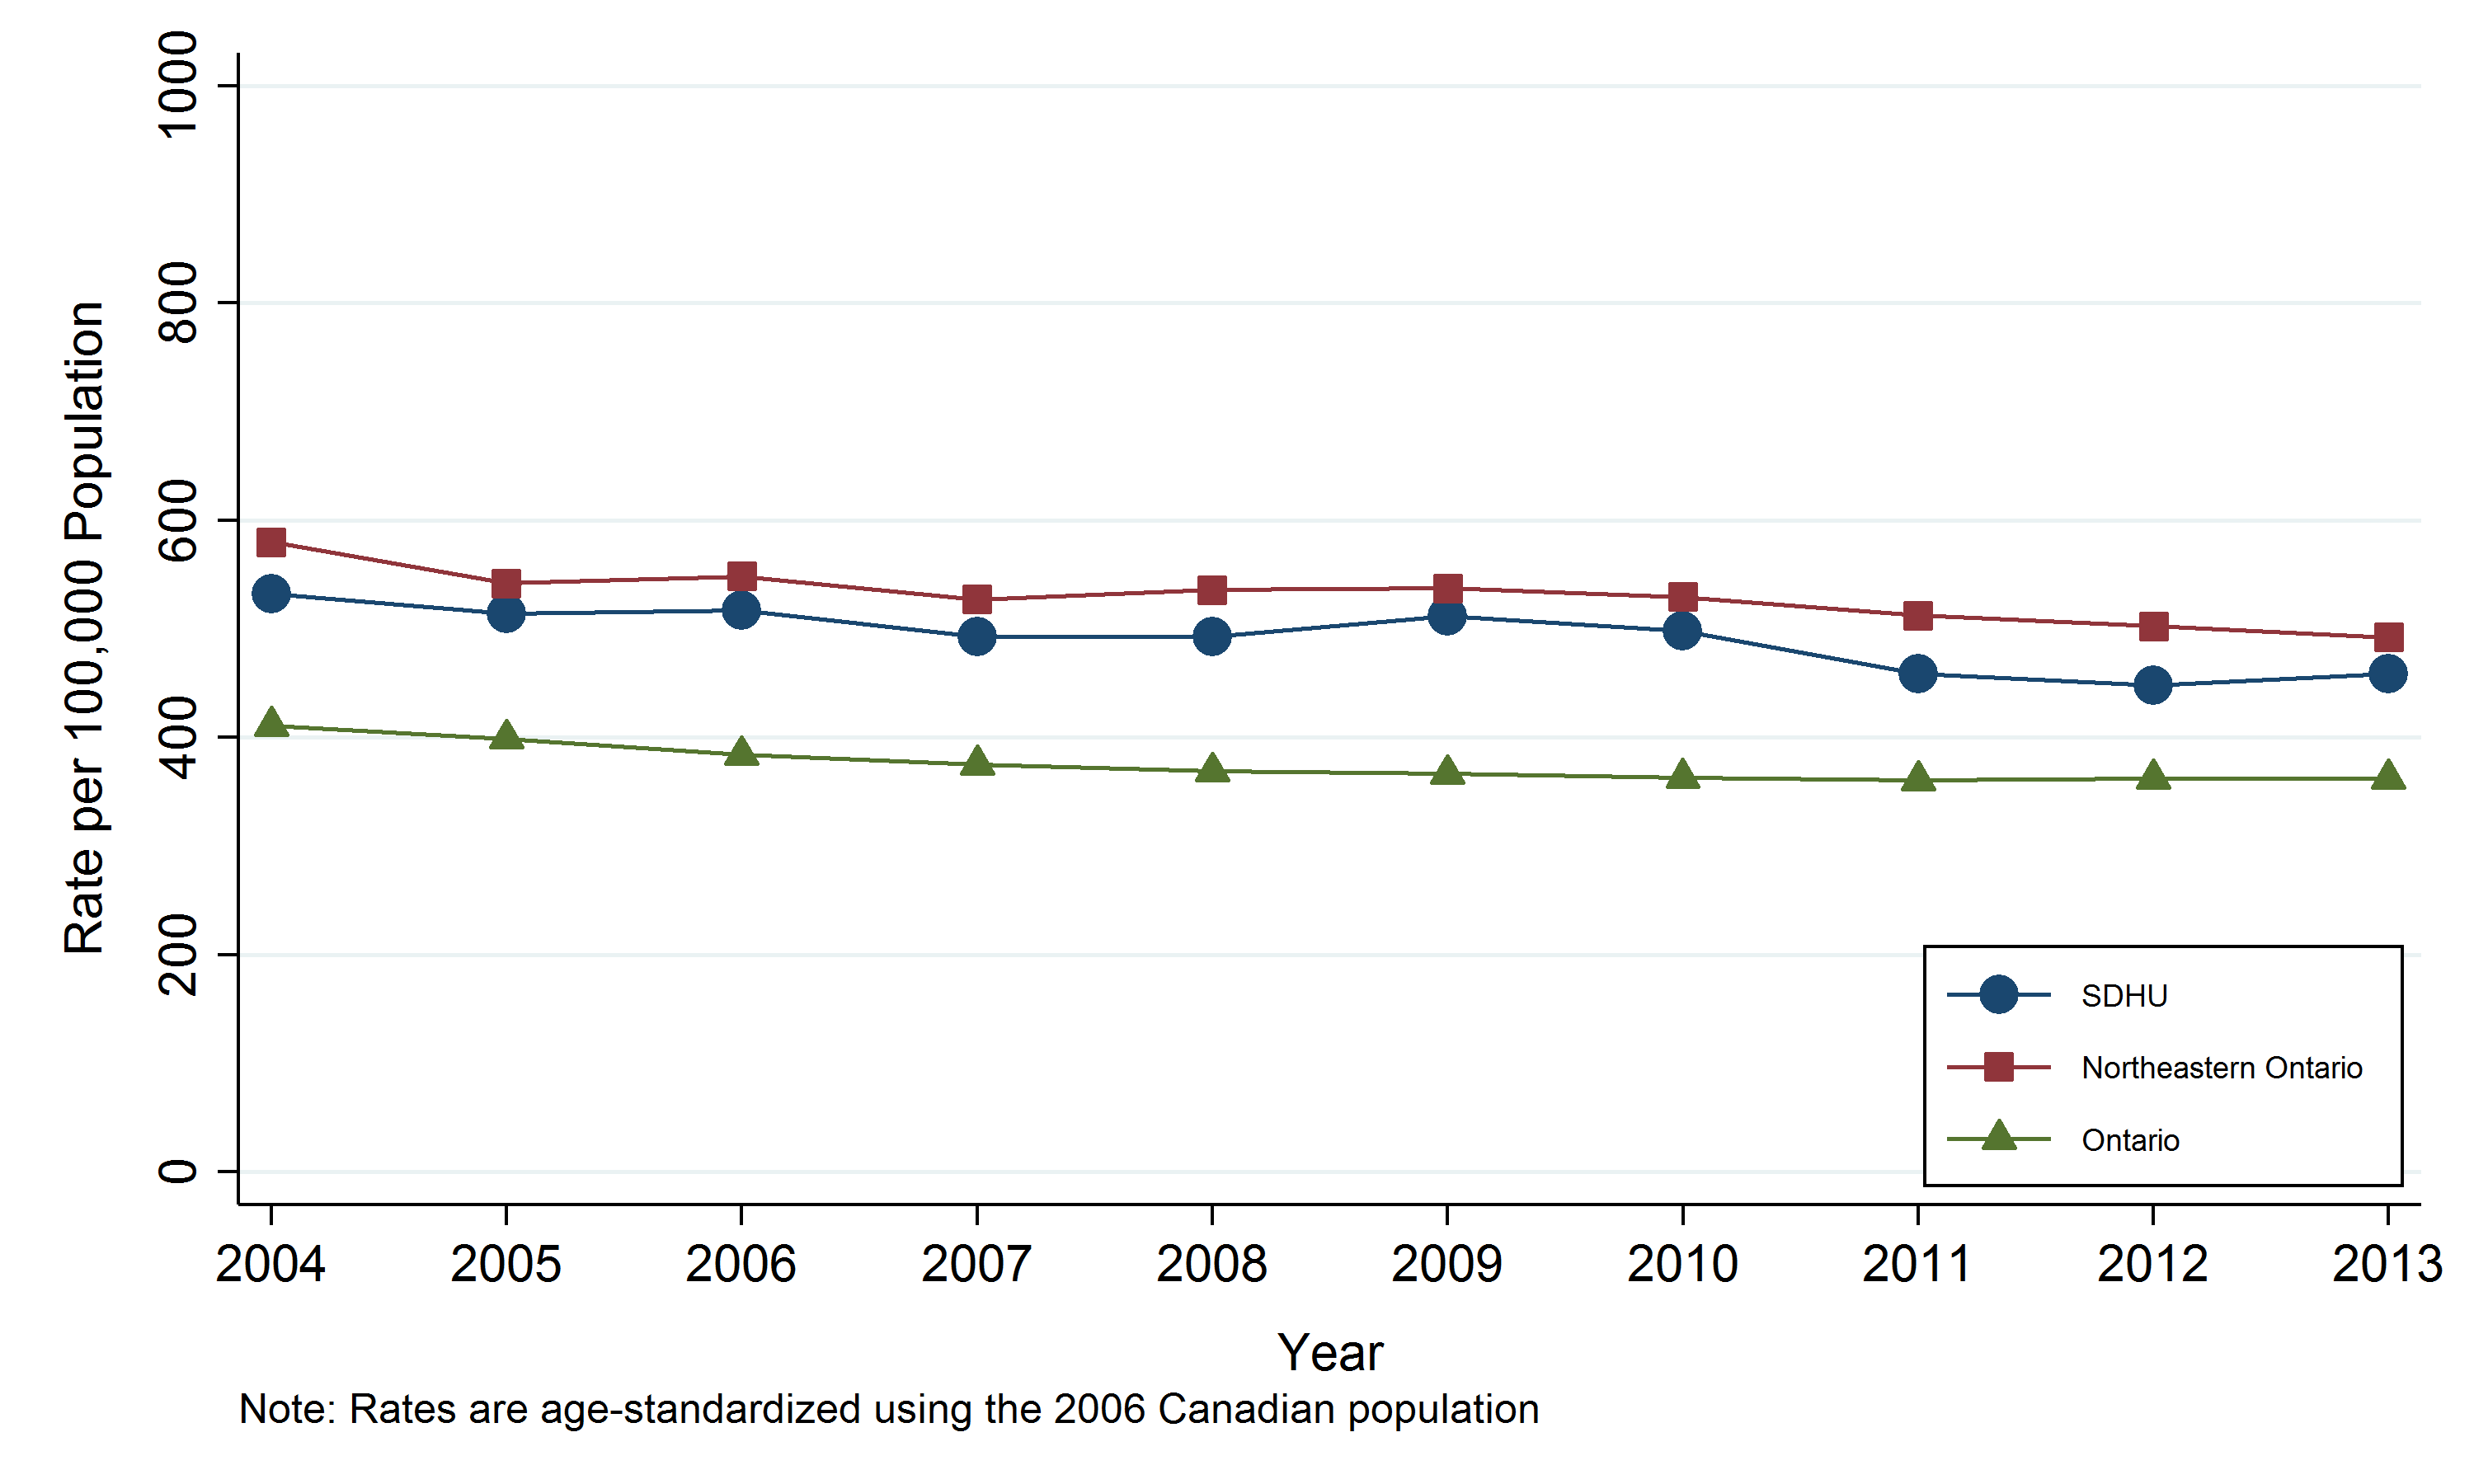
Table: Annual age-standardized hospitalization rate, other heart diseases, by geographic area, 2004-2013
| Geographic Region | 2004 | 2005 | 2006 | 2007 | 2008 | 2009 | 2010 | 2011 | 2012 | 2013 |
|---|---|---|---|---|---|---|---|---|---|---|
| SDHU | 532.2 | 514.3 | 516.9 | 492.6 | 493.1 | 511.7 | 498.4 | 458.9 | 448.2 | 458.5 |
| Northeast | 580.0 | 541.9 | 548.4 | 527.2 | 535.8 | 537.6 | 529.6 | 512.3 | 502.6 | 492.4 |
| Ontario | 410.7 | 399.1 | 384.0 | 375.4 | 368.8 | 366.6 | 363.2 | 360.9 | 362.5 | 362.4 |
Table: Annual number of hospitalization cases, other heart diseases, by geographic area, 2004-2013
| Geographic Region | 2004 | 2005 | 2006 | 2007 | 2008 | 2009 | 2010 | 2011 | 2012 | 2013 |
|---|---|---|---|---|---|---|---|---|---|---|
| SDHU | 1065 | 1066 | 1092 | 1061 | 1084 | 1136 | 1129 | 1064 | 1066 | 1107 |
| Northeast | 3539 | 3398 | 3512 | 3449 | 3576 | 3626 | 3645 | 3599 | 3591 | 3576 |
| Ontario | 47889 | 47805 | 47407 | 47594 | 48006 | 48983 | 49953 | 50996 | 52791 | 54445 |
Other heart diseases hospitalizations by Greater Sudbury and outlying areas
Key findings:
- In 2013, there were 826 hospitalizations due to other heart diseases among residents of the City of Greater Sudbury and 281 hospitalizations among residents of the SDHU district office areas.
- The rate of hospitalization due to other heart diseases among residents of Greater Sudbury was 421 hospitalizations per 100,000 population, and the rate among residents of the SDHU district office areas was 629 hospitalizations per 100,000 population in 2013.
- The rate of hospitalization due to other heart diseases among residents of Greater Sudbury has consistently been lower than that among residents of the SDHU district office areas.
- Between 2004 and 2013, the rate of hospitalization due to other heart diseases among residents of both the City of Greater Sudbury and the SDHU district office areas has decreased slightly.
Notes:
- Rates are age-standardized using the 2006 Canadian population.
- Data Source: Inpatient Discharge Data and Population Estimates and Projections, Ontario Ministry of Health and Long-Term Care, IntelliHEALTH Ontario, Extracted April 2015.
Figure: Annual age-standardized hospitalization rate, other heart diseases, Greater Sudbury vs. Sudbury & District Health Unit (SDHU) district office areas, 2004-2013
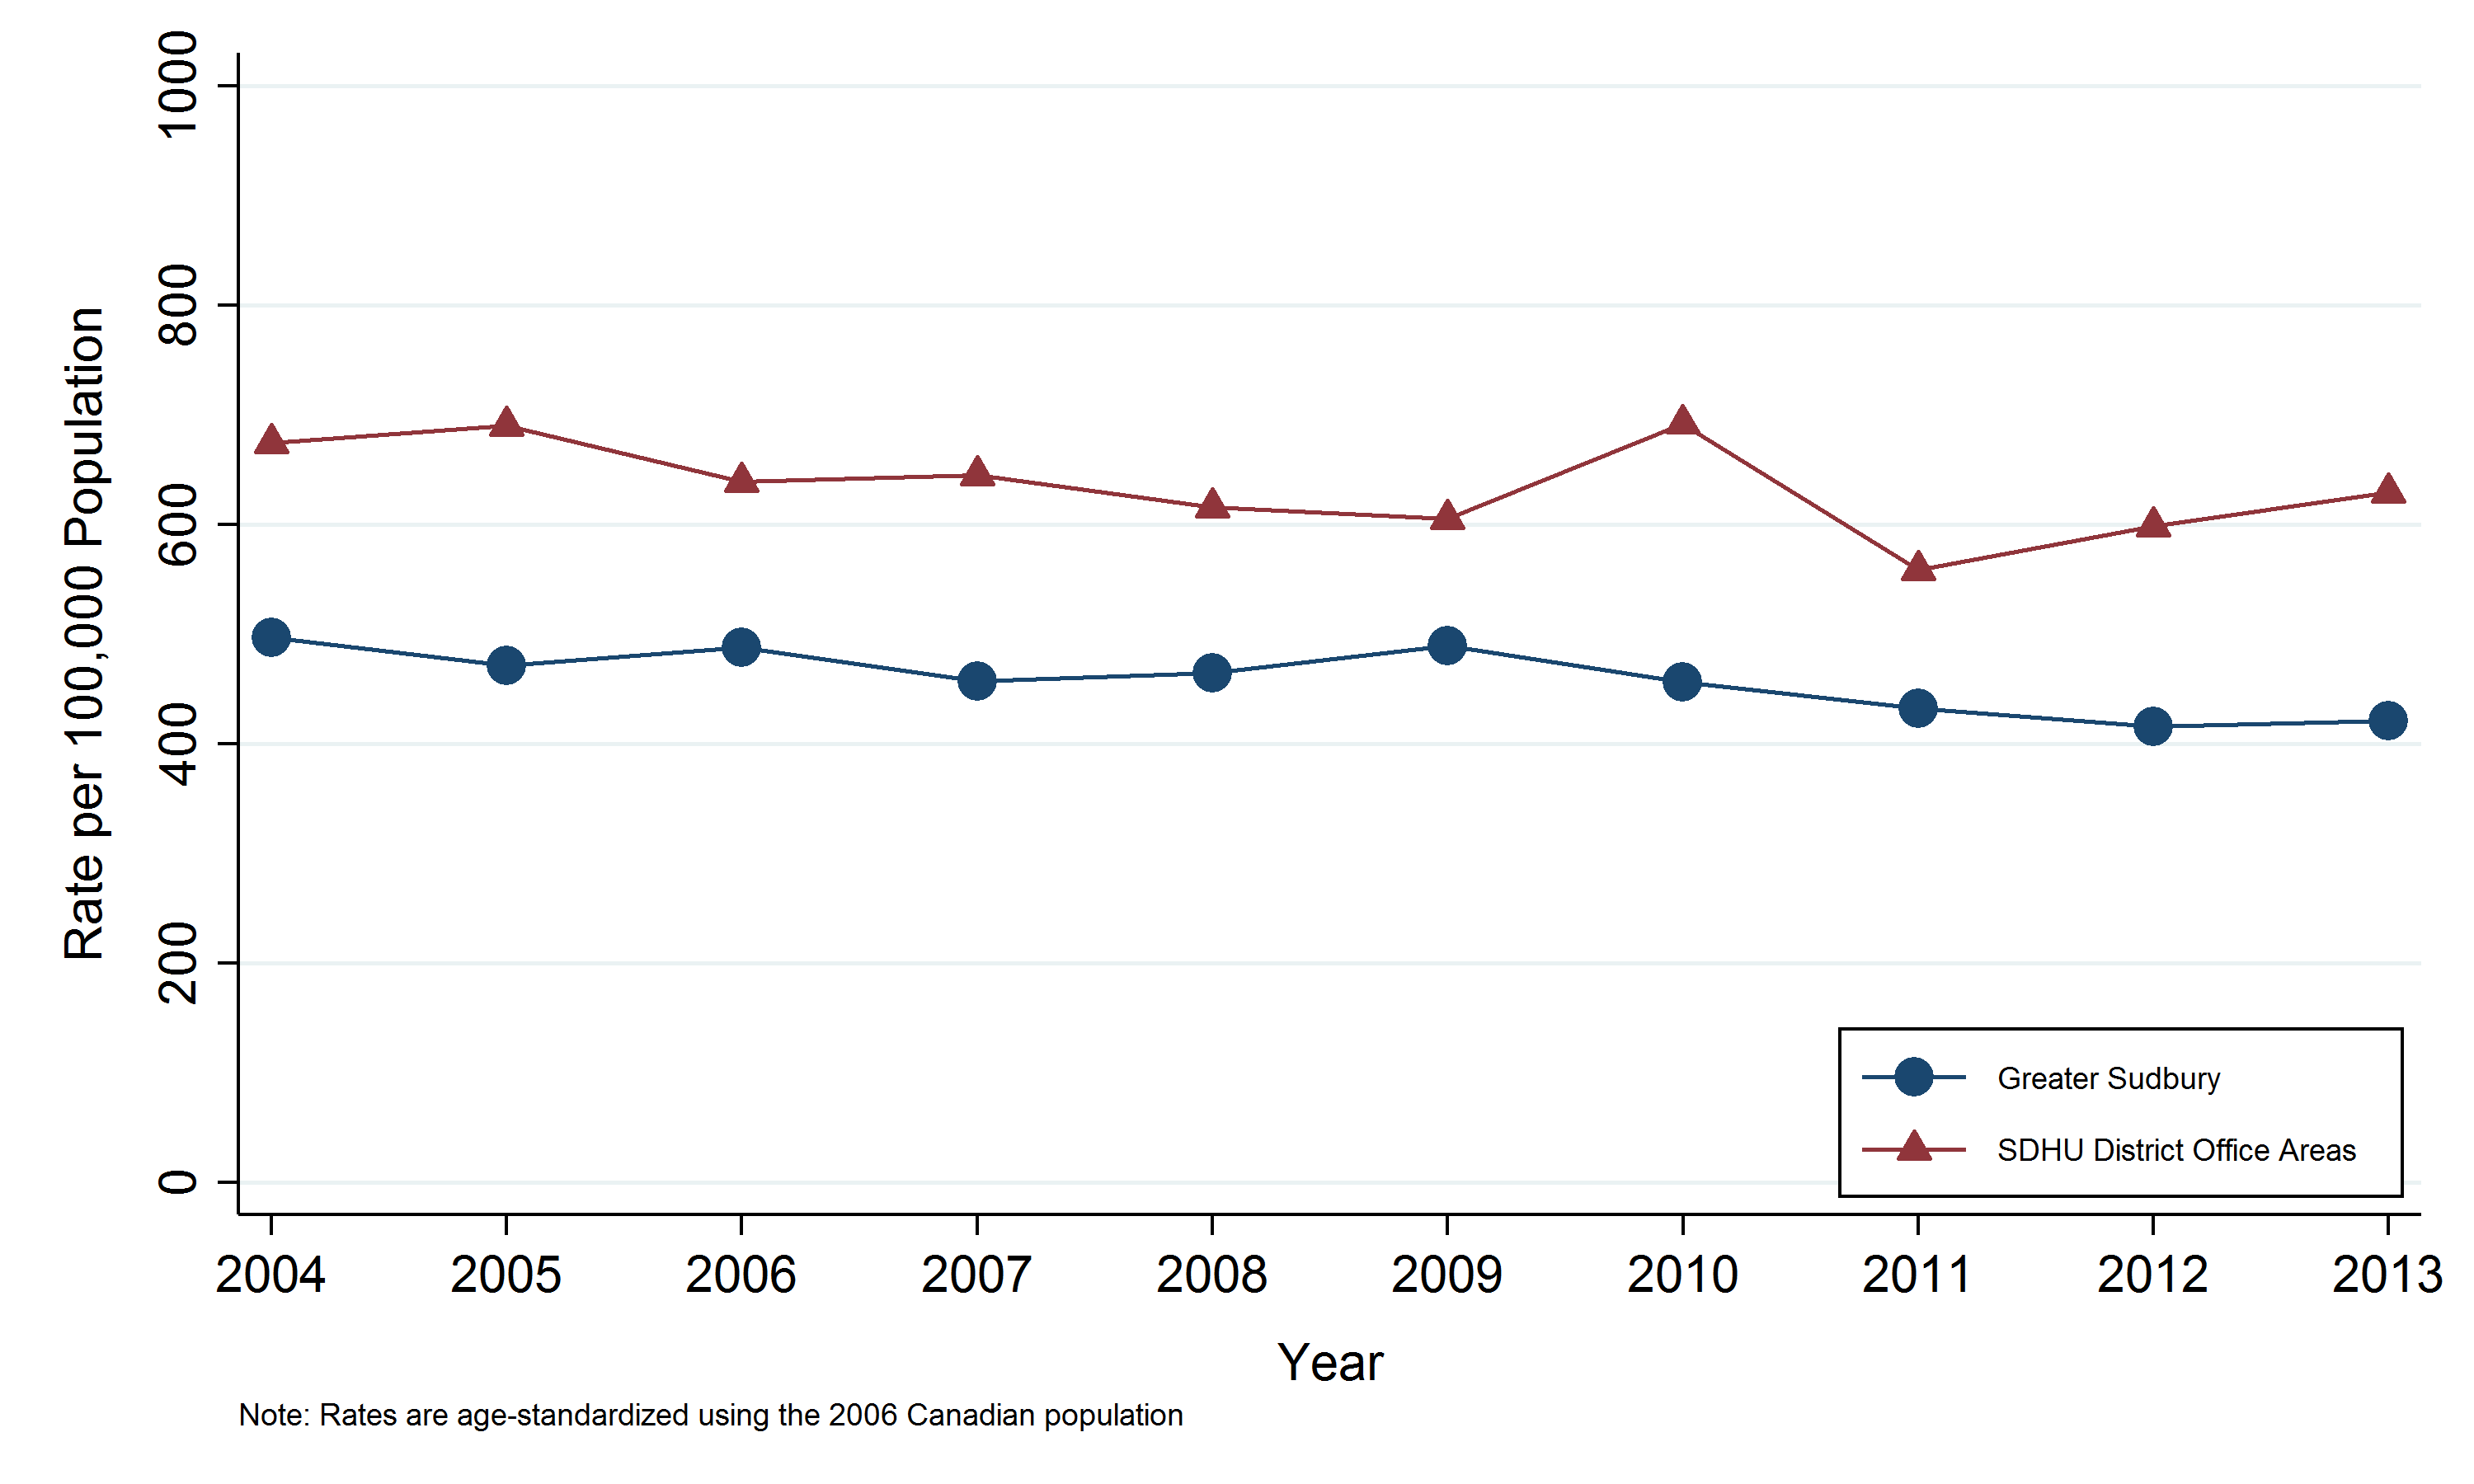
Table: Annual age-standardized hospitalization rate, other heart diseases, Greater Sudbury vs. Sudbury & District Health Unit (SDHU) district office areas, 2004-2013
| District | 2004 | 2005 | 2006 | 2007 | 2008 | 2009 | 2010 | 2011 | 2012 | 2013 |
|---|---|---|---|---|---|---|---|---|---|---|
| Greater Sudbury | 496.5 | 471.4 | 487.8 | 456.7 | 464.5 | 489.2 | 456.5 | 432.5 | 415.5 | 420.6 |
| SDHU District Office Areas | 674.2 | 690.3 | 638.7 | 644.8 | 615.6 | 604.8 | 691.8 | 558.5 | 598.3 | 629.3 |
Table: Annual number of hospitalization cases, other heart diseases, Greater Sudbury vs. Sudbury & District Health Unit (SDHU) district office areas, 2004-2013
| District | 2004 | 2005 | 2006 | 2007 | 2008 | 2009 | 2010 | 2011 | 2012 | 2013 |
|---|---|---|---|---|---|---|---|---|---|---|
| Greater Sudbury | 806 | 788 | 834 | 796 | 825 | 881 | 839 | 816 | 803 | 826 |
| SDHU District Office Areas | 259 | 278 | 258 | 265 | 259 | 255 | 290 | 248 | 263 | 281 |
Other heart diseases hospitalizations by sex
Key findings:
- In 2013, there were 571 males and 536 females hospitalized due to other heart diseases in the SDHU area.
- In the SDHU area, the rate of hospitalization due to other heart diseases in 2013 was 534 hospitalizations per 100,000 males and 397 hospitalizations per 100,000 females.
- The rate of hospitalization due to other heart diseases among males has been consistently higher than the rate among females.
- Between 2004 and 2013, the rate of hospitalization due to other heart diseases among both males and females has generally decreased.
Notes:
- Rates are age-standardized using the 2006 Canadian population.
- Data Source: Inpatient Discharge Data and Population Estimates and Projections, Ontario Ministry of Health and Long-Term Care, IntelliHEALTH Ontario, Extracted April 2015.
Figure: Annual age-standardized hospitalization rate, other heart diseases, by sex, Sudbury & District Health Unit (SDHU), 2004-2013
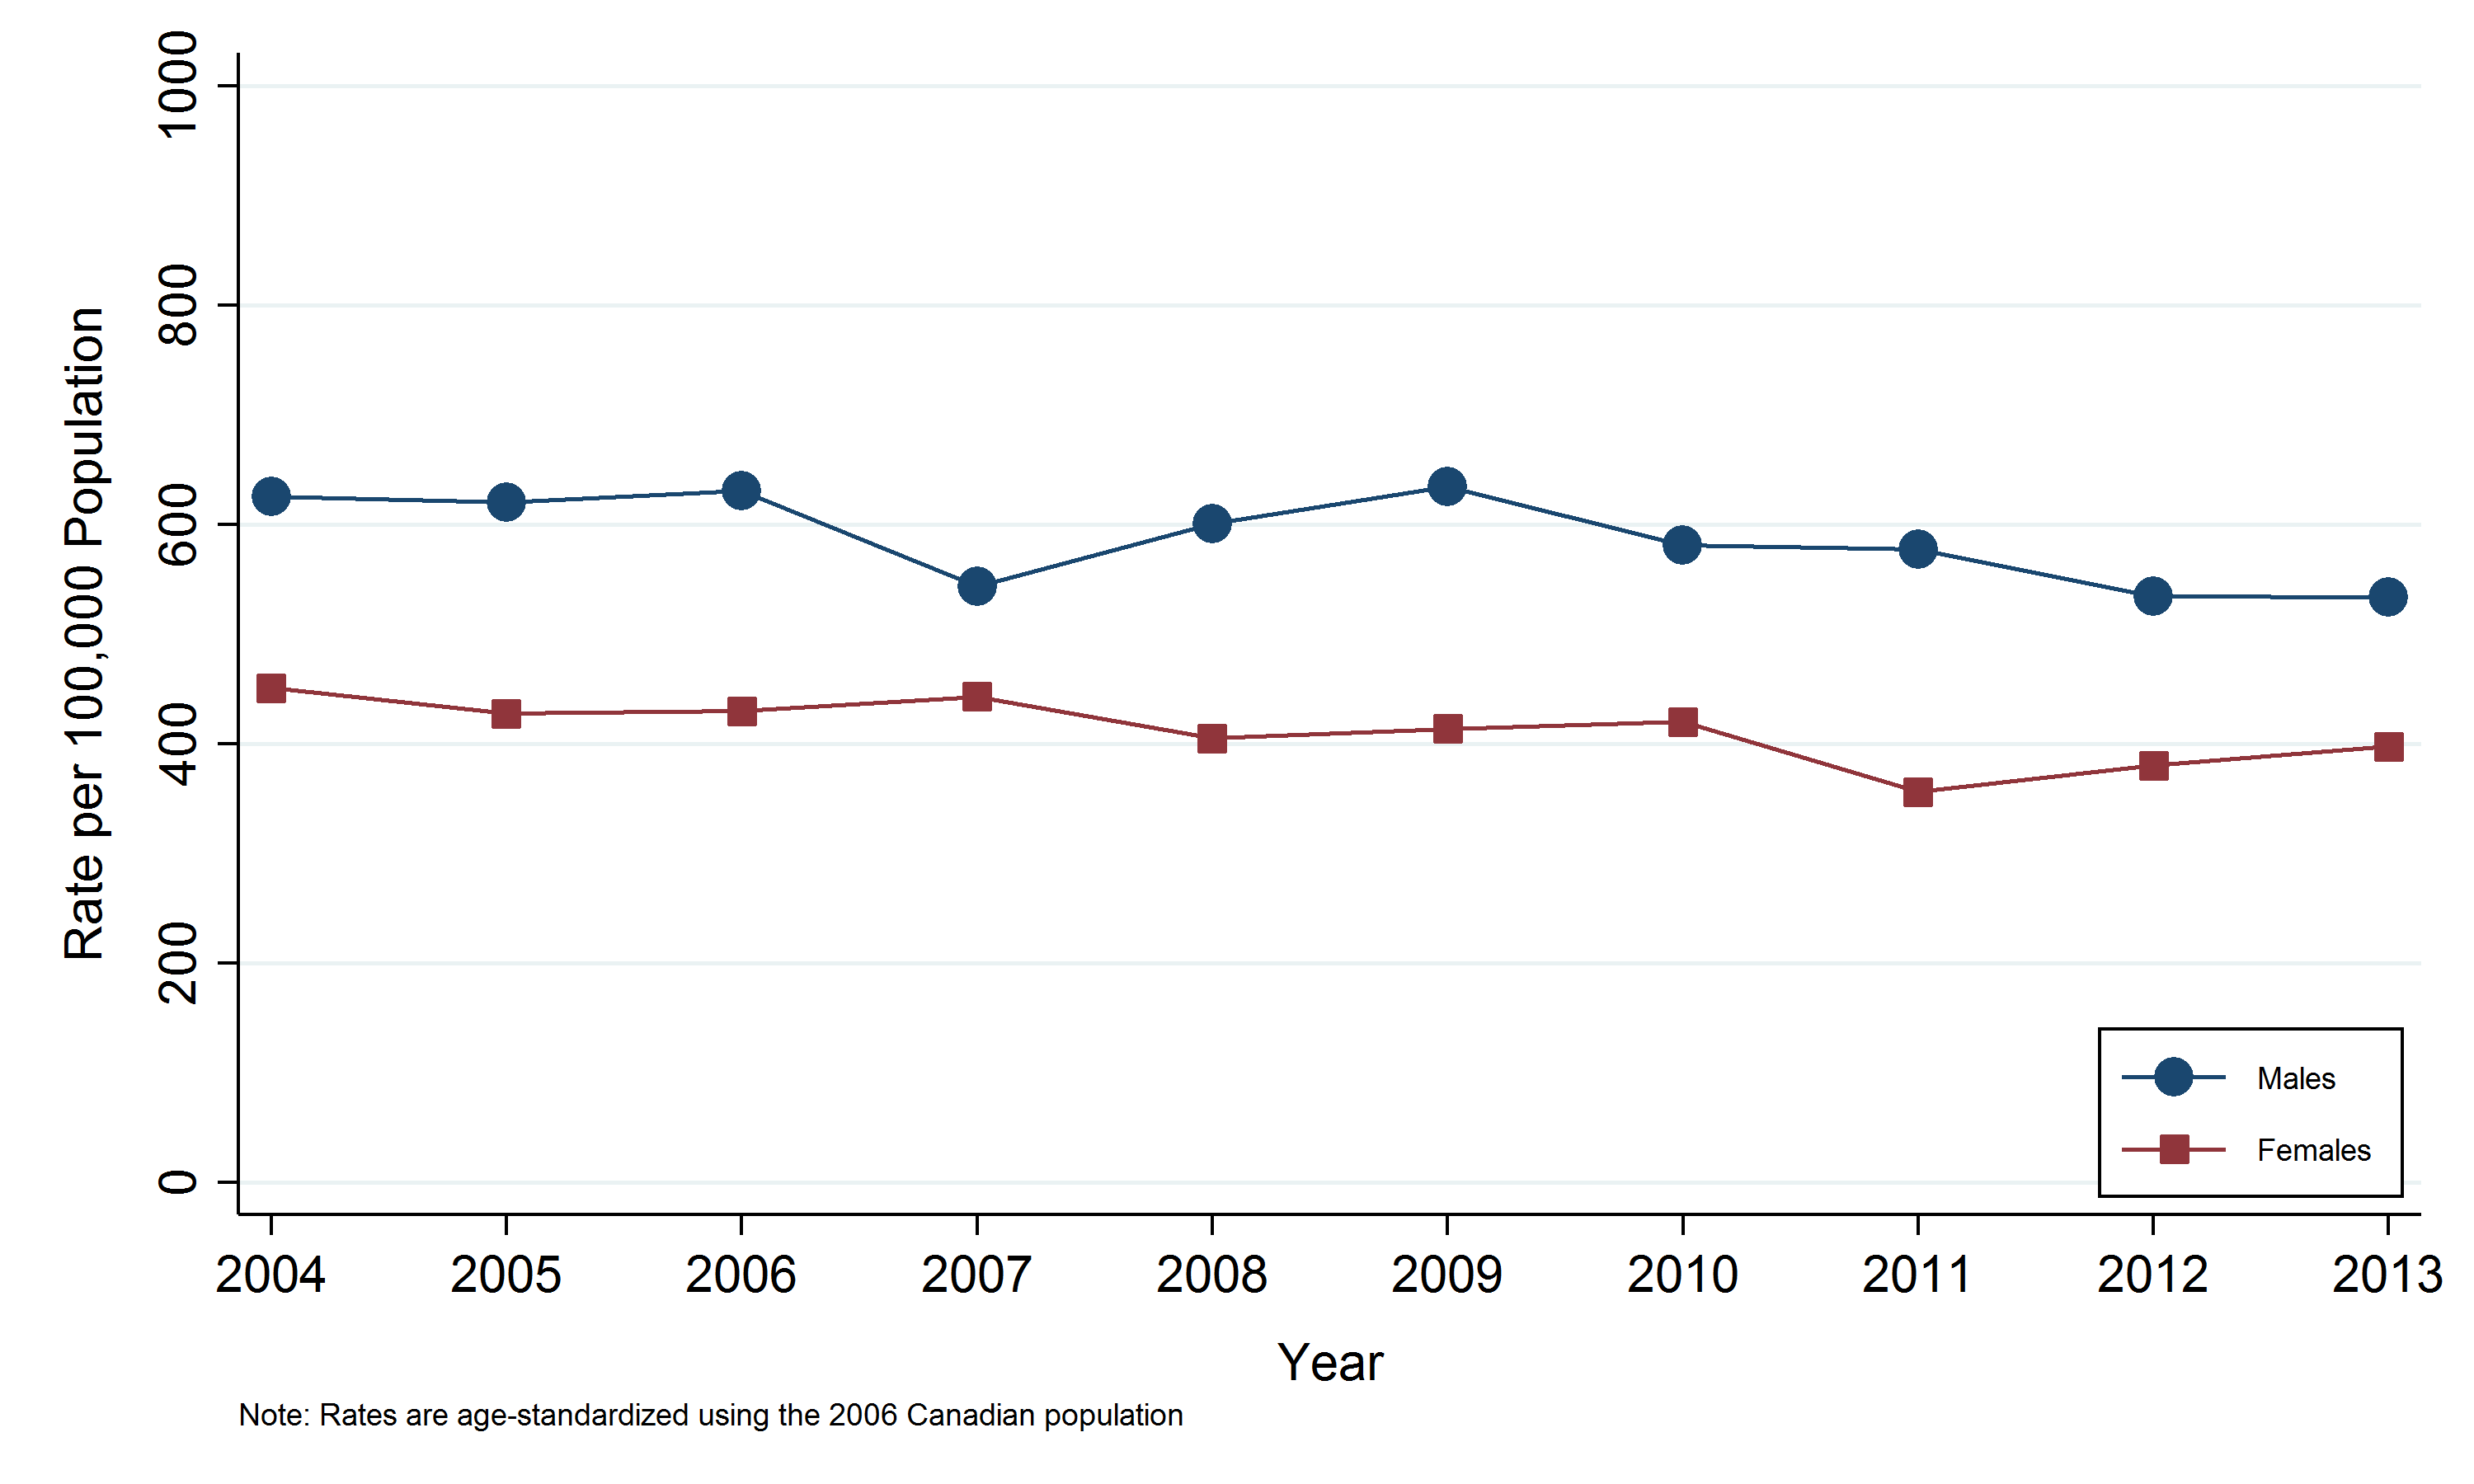
Table: Annual age-standardized hospitalization rate, other heart diseases, by sex, Sudbury & District Health Unit (SDHU), 2004-2013
| Sex | 2004 | 2005 | 2006 | 2007 | 2008 | 2009 | 2010 | 2011 | 2012 | 2013 |
|---|---|---|---|---|---|---|---|---|---|---|
| Males | 625.5 | 620.0 | 630.3 | 543.3 | 600.9 | 634.2 | 580.9 | 577.1 | 534.5 | 533.9 |
| Females | 450.8 | 427.6 | 429.5 | 442.7 | 405.0 | 413.4 | 420.0 | 356.3 | 380.2 | 397.3 |
Table: Annual number of hospitalization cases, other heart diseases, by sex, Sudbury & District Health Unit (SDHU), 2004-2013
| Sex | 2004 | 2005 | 2006 | 2007 | 2008 | 2009 | 2010 | 2011 | 2012 | 2013 |
|---|---|---|---|---|---|---|---|---|---|---|
| Males | 557 | 572 | 585 | 532 | 583 | 622 | 597 | 596 | 563 | 571 |
| Females | 508 | 494 | 507 | 529 | 501 | 514 | 532 | 468 | 503 | 536 |
Other heart diseases by age group
Key findings:
- In 2013, there were 533 hospitalizations for other heart diseases among residents of the SDHU area aged 75 years and older, the most of any age group.
- In the SDHU area, the highest rate of hospitalization due to other heart diseases was in the 75 and over age group, with 3,607 hospitalizations per 100,000 population.
- The rate of hospitalization due to other heart diseases increases with age.
- Between 2004 and 2013, the rate of hospitalization due to other heart diseases has generally decreased in the 75 and over age group, while the rate in other age groups were stable.
Notes:
- Data Source: Inpatient Discharge Data and Population Estimates and Projections, Ontario Ministry of Health and Long-Term Care, IntelliHEALTH Ontario, Extracted April 2015.
Figure: Annual hospitalization rate, other heart diseases, by age group, Sudbury & District Health Unit (SDHU), 2004-2013
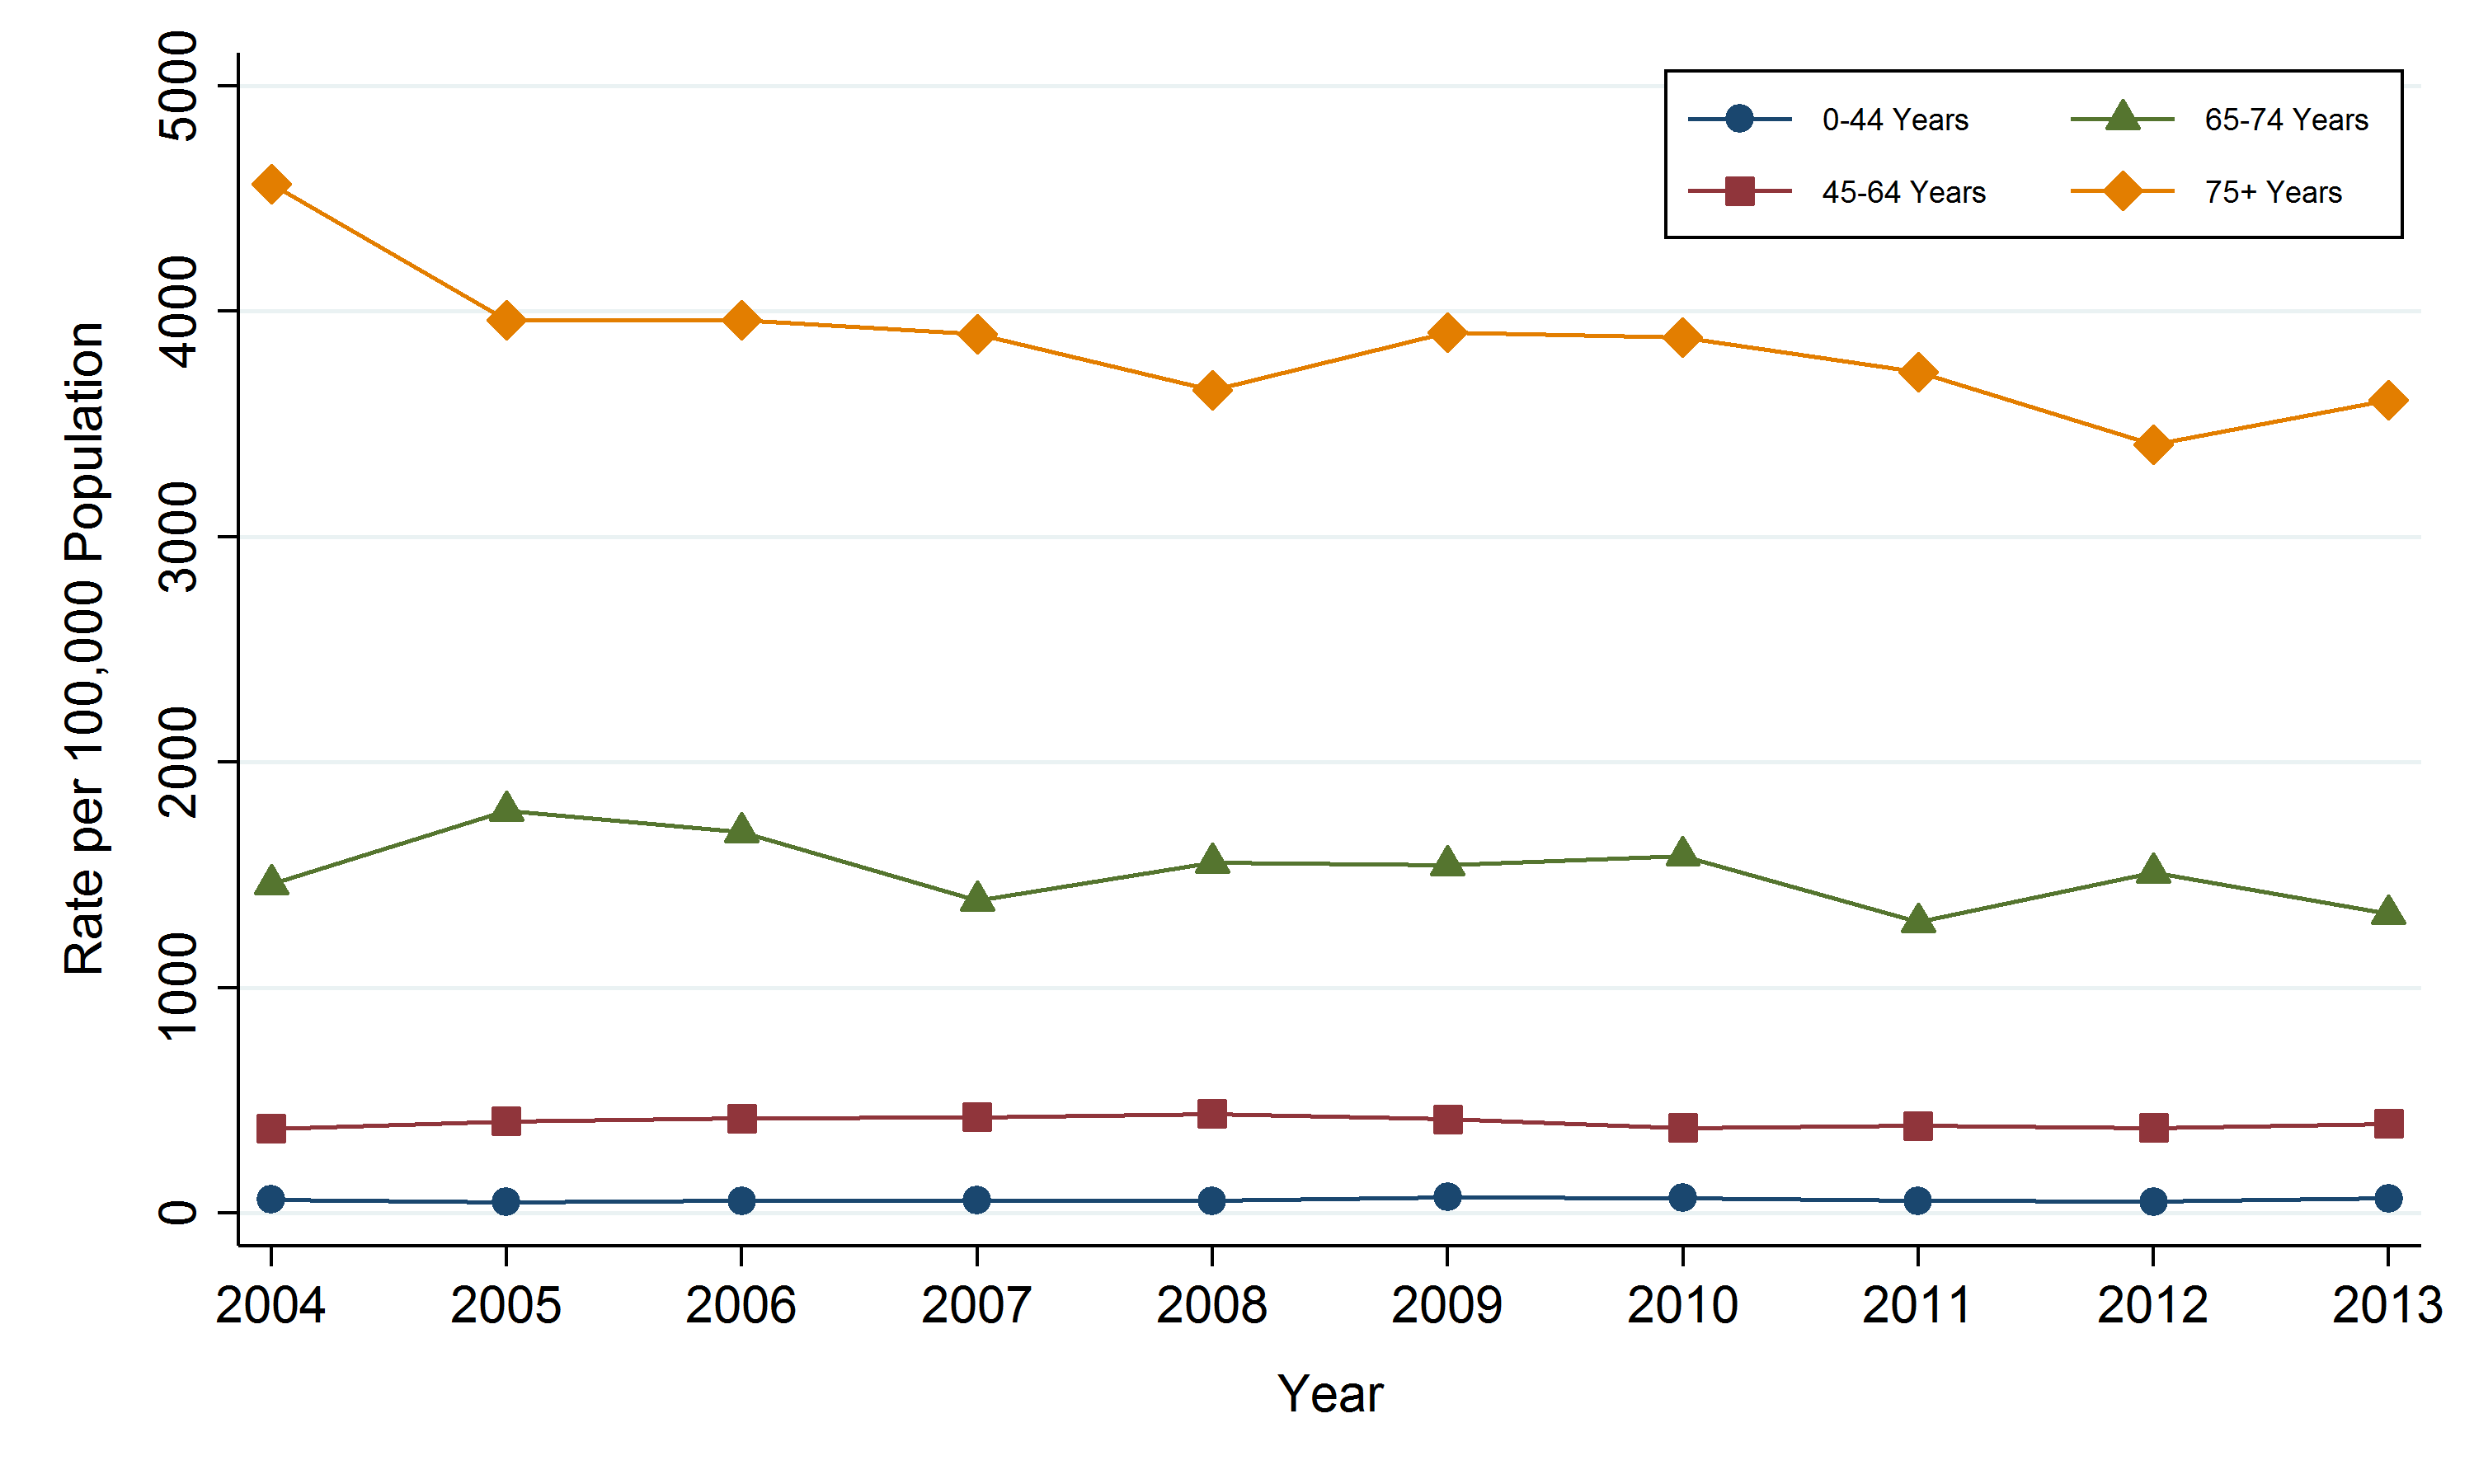
Table: Annual hospitalization rate, other heart diseases, by age group, Sudbury & District Health Unit (SDHU), 2004-2013
| Age Group (Years) | 2004 | 2005 | 2006 | 2007 | 2008 | 2009 | 2010 | 2011 | 2012 | 2013 |
|---|---|---|---|---|---|---|---|---|---|---|
| 0-44 | 61.7 | 49.2 | 55.7 | 57.4 | 56.1 | 71.5 | 67.3 | 55.8 | 51.4 | 67.1 |
| 45-64 | 375.2 | 408.1 | 420.7 | 426.2 | 441.0 | 417.7 | 378.8 | 388.8 | 378.0 | 397.6 |
| 65-74 | 1461.2 | 1786.5 | 1689.8 | 1387.6 | 1555.6 | 1543.4 | 1585.8 | 1290.6 | 1510.8 | 1327.0 |
| 75+ | 4562.2 | 3961.0 | 3960.2 | 3897.6 | 3650.0 | 3906.2 | 3884.3 | 3731.2 | 3409.5 | 3607.2 |
Table: Annual number of hospitalization cases, other heart diseases, by age group, Sudbury & District Health Unit (SDHU), 2004-2013
| Age Group (Years) | 2004 | 2005 | 2006 | 2007 | 2008 | 2009 | 2010 | 2011 | 2012 | 2013 |
|---|---|---|---|---|---|---|---|---|---|---|
| 0-44 | 71 | 56 | 63 | 64 | 62 | 78 | 72 | 59 | 54 | 70 |
| 45-64 | 205 | 228 | 240 | 249 | 263 | 253 | 233 | 240 | 232 | 242 |
| 65-74 | 233 | 287 | 275 | 229 | 263 | 267 | 279 | 233 | 286 | 262 |
| 75+ | 556 | 495 | 514 | 519 | 496 | 538 | 545 | 532 | 494 | 533 |
Other heart disease deaths by geographic area
Key findings:
- In the SDHU area, there were 86 deaths due to other heart diseases in 2011.
- In 2011, the rate of mortality from other heart diseases in the SDHU area was 38 per 100,000 population.
- The mortality rate for other heart diseases in the SDHU area, northeastern Ontario, and Ontario have been very similar.
- Between 2002 and 2011, the rate of mortality from other heart diseases in the SDHU area remained stable over time.
Notes:
- Rates are age-standardized using the 2006 Canadian population.
- Data Source: Mortality Data and Population Estimates and Projections, Ontario Ministry of Health and Long-Term Care, IntelliHEALTH Ontario, Extracted April 2015.
Figure: Annual age-standardized mortality rate, other heart diseases, by geographic area, 2002-2011
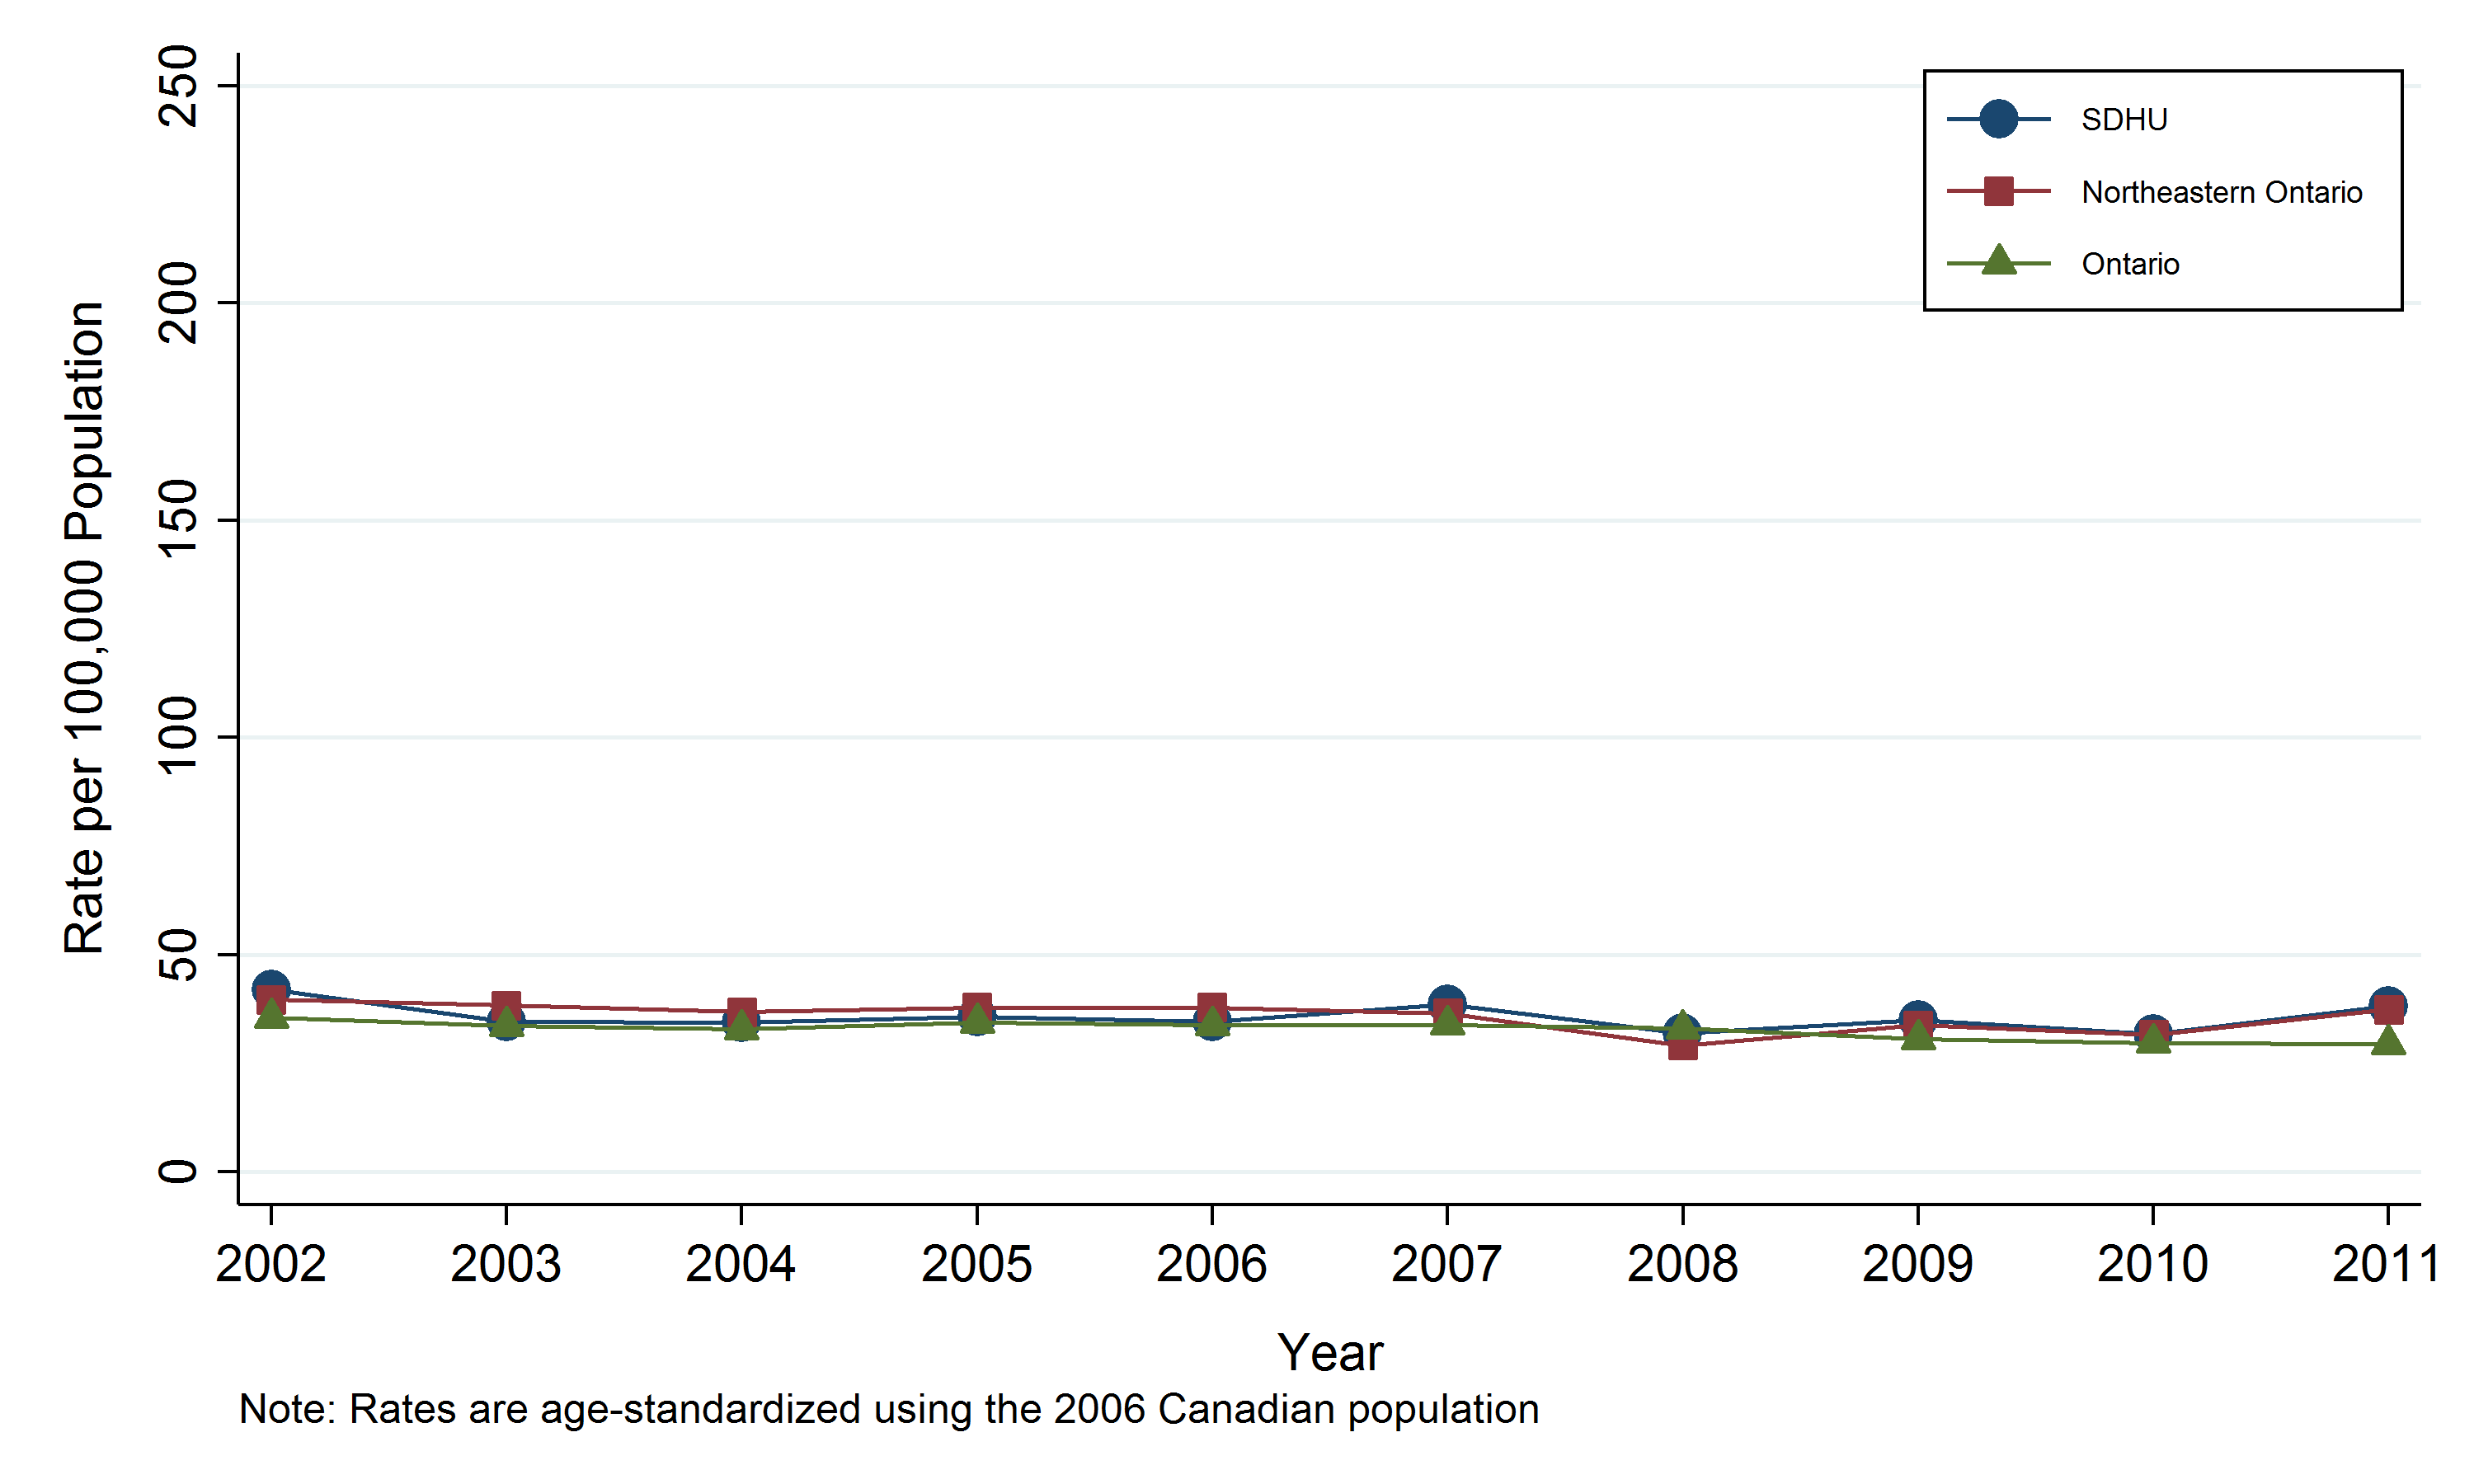
Table: Annual age-standardized mortality rate, other heart diseases, by geographic area, 2002-2011
| Geographic Region | 2002 | 2003 | 2004 | 2005 | 2006 | 2007 | 2008 | 2009 | 2010 | 2011 |
|---|---|---|---|---|---|---|---|---|---|---|
| SDHU | 42.0 | 34.7 | 34.5 | 35.7 | 34.6 | 38.6 | 31.9 | 35.0 | 31.8 | 38.3 |
| Northeast | 39.7 | 38.3 | 36.9 | 37.9 | 37.9 | 36.5 | 29.2 | 33.8 | 31.6 | 37.4 |
| Ontario | 35.5 | 33.7 | 32.9 | 34.4 | 33.8 | 33.9 | 33.0 | 30.6 | 29.7 | 29.5 |
Table: Annual number of mortality cases, other heart diseases, by geographic area, 2002-2011
| Geographic Region | 2002 | 2003 | 2004 | 2005 | 2006 | 2007 | 2008 | 2009 | 2010 | 2011 |
|---|---|---|---|---|---|---|---|---|---|---|
| SDHU | 73 | 62 | 60 | 69 | 66 | 79 | 66 | 73 | 70 | 86 |
| Northeast | 212 | 212 | 205 | 227 | 225 | 227 | 187 | 217 | 216 | 257 |
| Ontario | 3700 | 3637 | 3673 | 3983 | 4081 | 4248 | 4257 | 4077 | 4122 | 4257 |
Other heart disease potential years of life lost (PYLL) by geographic area
Key findings:
- In 2011, SDHU area residents lost 363 years of potential life due to deaths from other heart diseases before the age of 75.
- The rate of potential years of life lost (PYLLs) in the SDHU area due to other heart diseases was 184 PYLL per 100,000 population.
- The rate of PYLL due to other heart diseases in the SDHU area has generally been similar to the rate in northeastern Ontario and in Ontario overall.
- From 2002 to 2011, there has been no clear trend over time in the rate of PYLLs due to other heart diseases in the SDHU area.
Notes:
- Rates are age-standardized using the 2006 Canadian population.
- Data Source: Mortality Data and Population Estimates and Projections, Ontario Ministry of Health and Long-Term Care, IntelliHEALTH Ontario, Extracted April 2015.
Figure: Annual age-standardized rate of Potential Years of Life Lost (PYLL), other heart diseases, by geographic area, 2002-2011
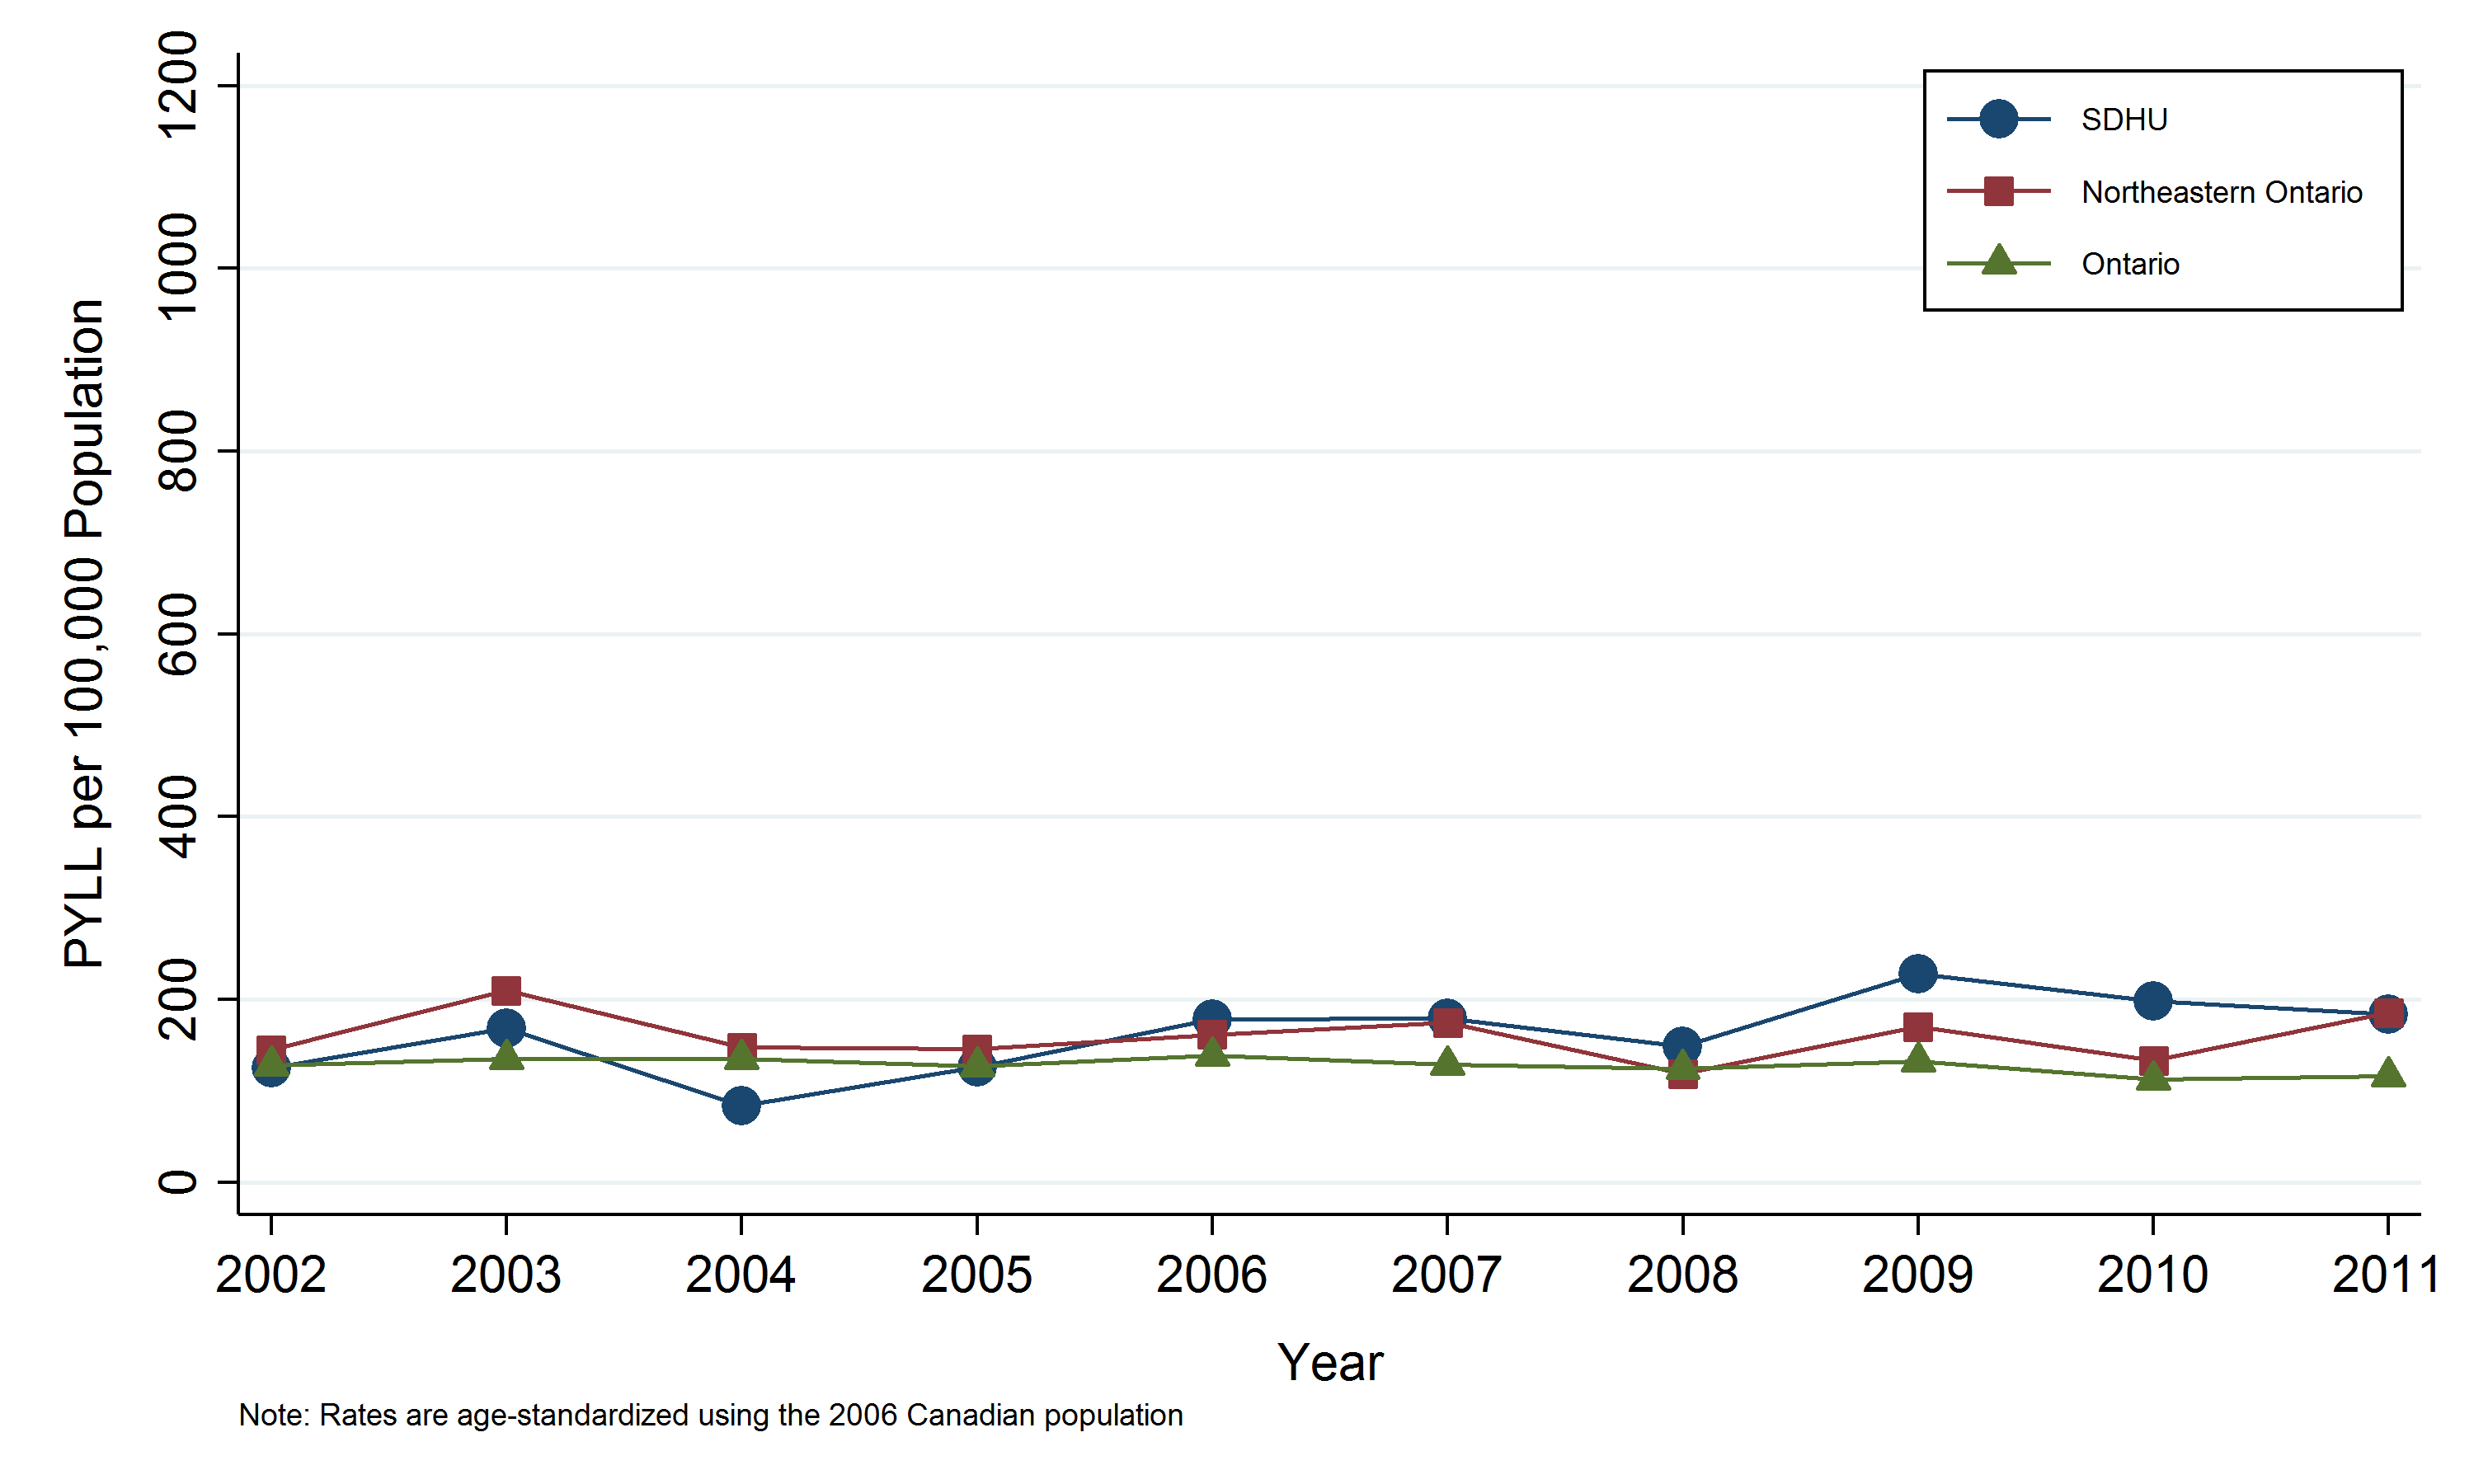
Table: Annual age-standardized rate of Potential Years of Life Lost (PYLL), other heart diseases, by geographic area, 2002-2011
| Geographic Region | 2002 | 2003 | 2004 | 2005 | 2006 | 2007 | 2008 | 2009 | 2010 | 2011 |
|---|---|---|---|---|---|---|---|---|---|---|
| SDHU | 125.1 | 168.8 | 83.6 | 126.2 | 178.7 | 179.4 | 148.5 | 227.9 | 198.7 | 183.8 |
| Northeast | 144.9 | 210 | 147.7 | 145.9 | 161.4 | 174.6 | 118.9 | 170.1 | 133.3 | 185.6 |
| Ontario | 127.7 | 135.4 | 135.3 | 127.3 | 138.4 | 128.5 | 124.3 | 132.8 | 112.3 | 116.1 |
Table: Annual number of Potential Years of Life Lost (PYLL), other heart diseases, by geographic area, 2002-2011
| Geographic Region | 2002 | 2003 | 2004 | 2005 | 2006 | 2007 | 2008 | 2009 | 2010 | 2011 |
|---|---|---|---|---|---|---|---|---|---|---|
| SDHU | 250 | 320 | 159 | 263 | 358 | 354 | 308 | 448 | 403 | 363 |
| Northeast | 818 | 1189 | 820 | 899 | 936 | 1002 | 706 | 961 | 816 | 1045 |
| Ontario | 14237 | 15447 | 15750 | 15009 | 16697 | 15769 | 15507 | 16826 | 14466 | 15232 |
This item was last modified on March 26, 2018