Stroke (cerebrovascular disease)
A stroke (Heart & Stroke Foundation) refers to a problem of circulation (blockage) in the blood vessels of the brain. Sometimes the stroke involves a partial blockage causing temporary effects, or a complete blockage with long-term effects. Vessels in the brain may also burst causing long-term effects.
Stroke hospitalizations by geographic area
Key findings:
- In the Sudbury & District Health Unit (SDHU) area, there were 333 hospitalizations due to stroke in 2013.
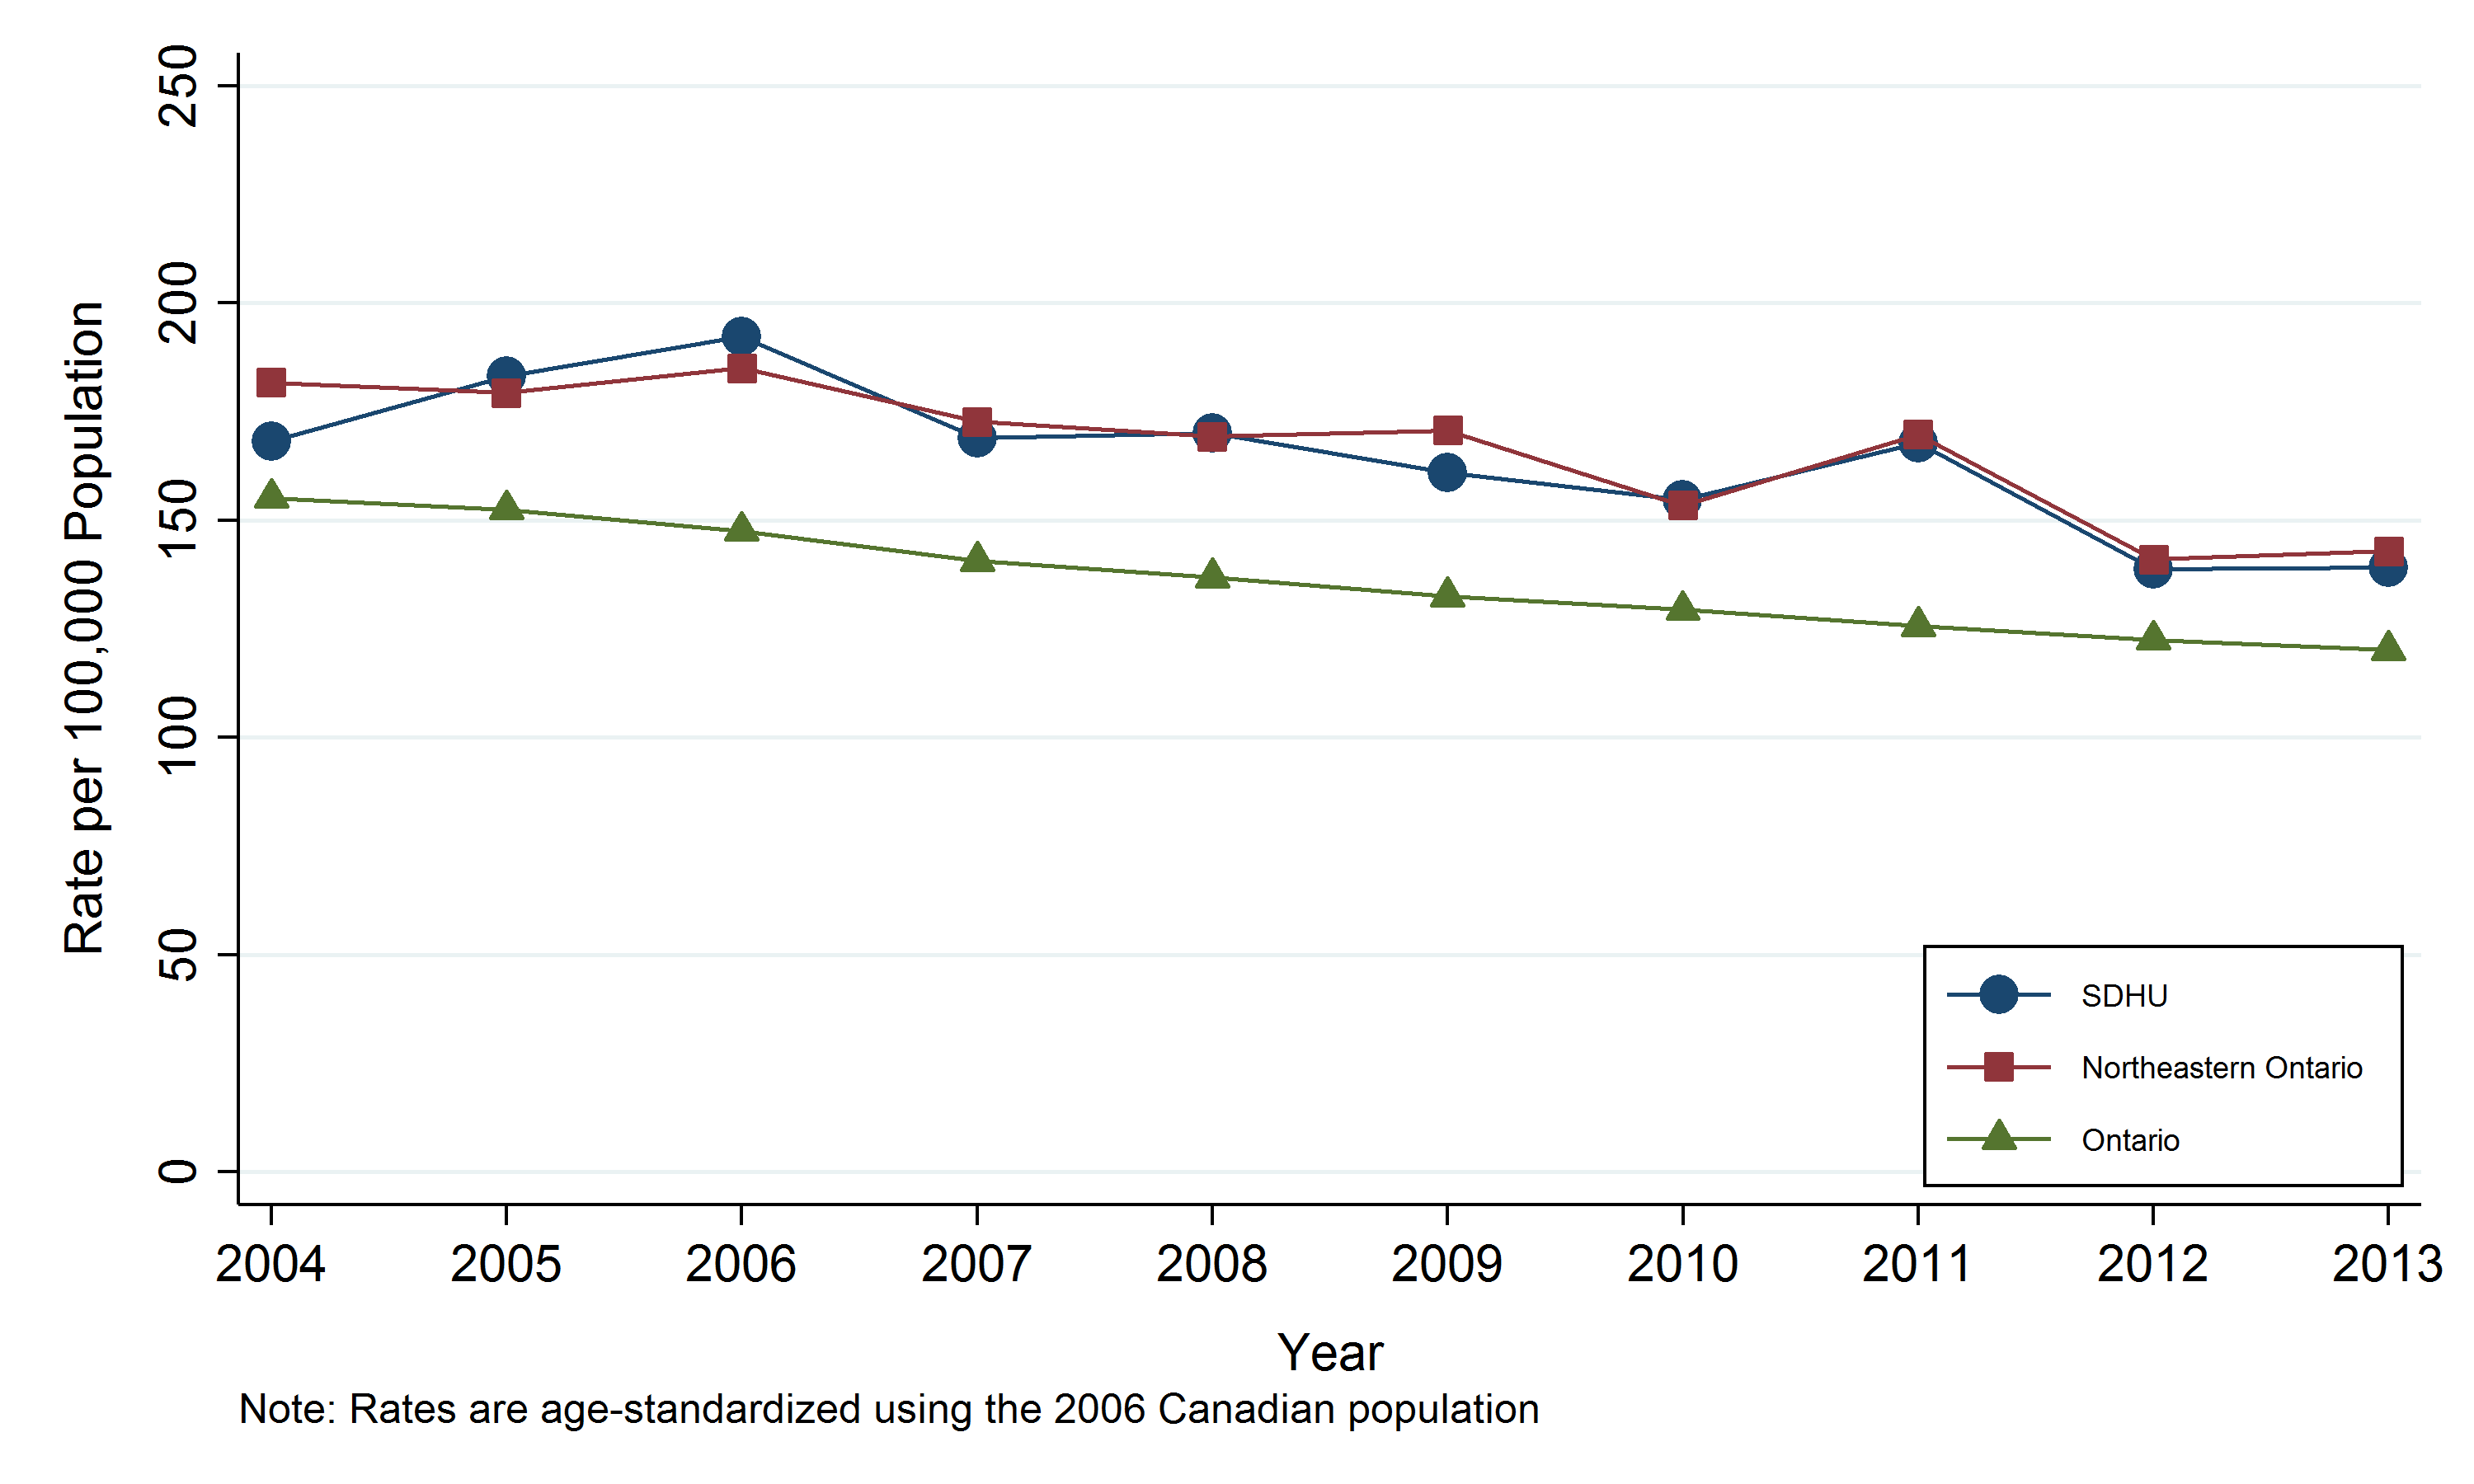
- In 2013, the rate of hospitalization due to stroke in the SDHU area was 139 hospitalizations per 100,000 population.
- The rate of hospitalization due to stroke in the SDHU area has been generally similar to that in northeastern Ontario, while the rates in both areas have consistently been higher than the rate in Ontario.
- Between 2004 and 2013, the rate of hospitalization due to stroke in the SDHU area has generally decreased.
Notes:
- Rates are age-standardized using the 2006 Canadian population.
- Data Source: Inpatient Discharge Data and Population Estimates and Projections, Ontario Ministry of Health and Long-Term Care, IntelliHEALTH Ontario, Extracted April 2015.
Figure: Annual age-standardized hospitalization rate, stroke, by geographic area, 2004-2013
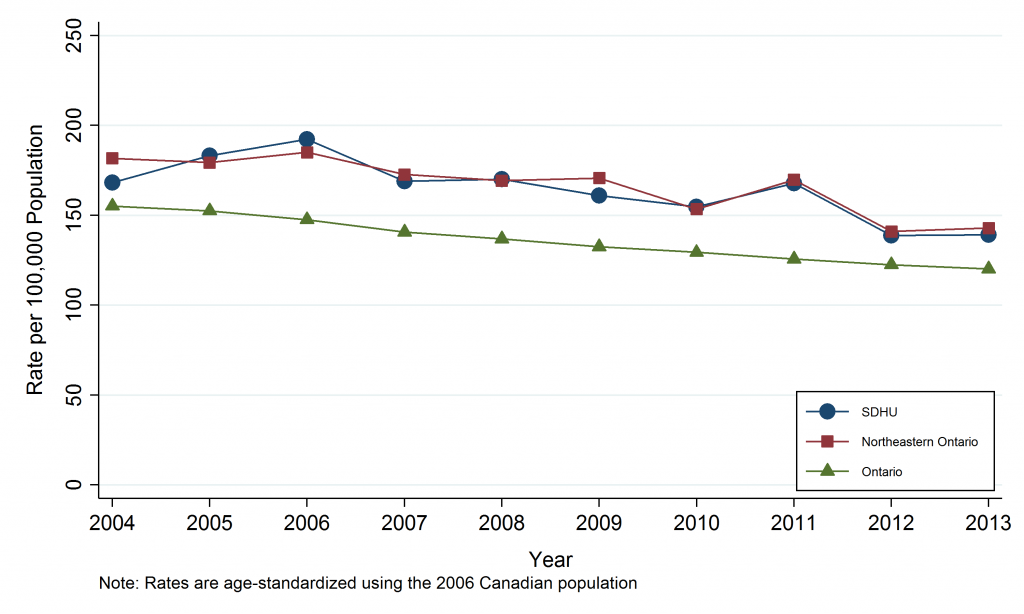
Table: Annual age-standardized hospitalization rate, stroke, by geographic area, 2004-2013
| Geographic Region | 2004 | 2005 | 2006 | 2007 | 2008 | 2009 | 2010 | 2011 | 2012 | 2013 |
| SDHU | 168.2 | 183.1 | 192.3 | 169.0 | 170.0 | 160.9 | 154.7 | 167.8 | 138.8 | 139.1 |
| Northeast | 181.7 | 179.3 | 185.1 | 172.6 | 169.2 | 170.7 | 153.4 | 169.8 | 140.9 | 142.9 |
| Ontario | 155.1 | 152.5 | 147.6 | 140.7 | 136.8 | 132.5 | 129.4 | 125.7 | 122.5 | 120.1 |
Table: Annual age-standardized hospitalization count, stroke, by geographic area, 2004-2013
| Geographic Region | 2004 | 2005 | 2006 | 2007 | 2008 | 2009 | 2010 | 2011 | 2012 | 2013 |
| SDHU | 345 | 380 | 409 | 362 | 372 | 363 | 356 | 393 | 334 | 333 |
| Northeast | 1131 | 1133 | 1196 | 1136 | 1137 | 1162 | 1063 | 1212 | 1027 | 1038 |
| Ontario | 18042 | 18247 | 18207 | 17843 | 17830 | 17726 | 17792 | 17785 | 17881 | 18098 |
Stroke hospitalizations by Greater Sudbury and outlying areas
Key findings:
- In 2013, there were 243 hospitalizations due to stroke among residents of the City of Greater Sudbury and 90 hospitalizations among residents of the SDHU district office areas.
- The rate of hospitalization due to stroke among residents of Greater Sudbury was 125 hospitalizations per 100,000 population, and the rate among residents of the SDHU district office areas was 199 hospitalizations per 100,000 population in 2013.
- The rate of hospitalization due to stroke among residents of Greater Sudbury has generally been similar to that among residents of the SDHU district office areas, though the Greater Sudbury rate was much lower in 2013.
- Between 2004 and 2013, the rate of hospitalization due to stroke among residents of both the City of Greater Sudbury and the SDHU district office areas has generally decreased.
Notes:
- Rates are age-standardized using the 2006 Canadian population.
- Data Source: Inpatient Discharge Data and Population Estimates and Projections, Ontario Ministry of Health and Long-Term Care, IntelliHEALTH Ontario, Extracted April 2015.
Table: Annual age-standardized hospitalization rate, stroke, Greater Sudbury vs. Sudbury & District Health Unit (SDHU) district office areas, 2004-2013
| District | 2004 | 2005 | 2006 | 2007 | 2008 | 2009 | 2010 | 2011 | 2012 | 2013 |
| Greater Sudbury | 159 | 179.8 | 187.3 | 170.3 | 170.4 | 160.2 | 156.9 | 167.4 | 135.7 | 125.4 |
| SDHU District Office Areas | 205.5 | 196.8 | 211.3 | 163.4 | 165.9 | 162.4 | 140.7 | 163.2 | 149 | 199.1 |
Table: Annual number of hospitalization cases, stroke, Greater Sudbury vs. Sudbury & District Health Unit (SDHU) district office areas, 2004-2013
| District | 2004 | 2005 | 2006 | 2007 | 2008 | 2009 | 2010 | 2011 | 2012 | 2013 |
| Greater Sudbury | 263 | 302 | 320 | 295 | 299 | 291 | 292 | 318 | 264 | 243 |
| SDHU District Office Areas | 82 | 78 | 89 | 67 | 73 | 72 | 64 | 75 | 70 | 90 |
Stroke hospitalizations by sex
Key findings:
- In 2013, there were 184 males and 149 females hospitalized due to a stroke in the SDHU area.
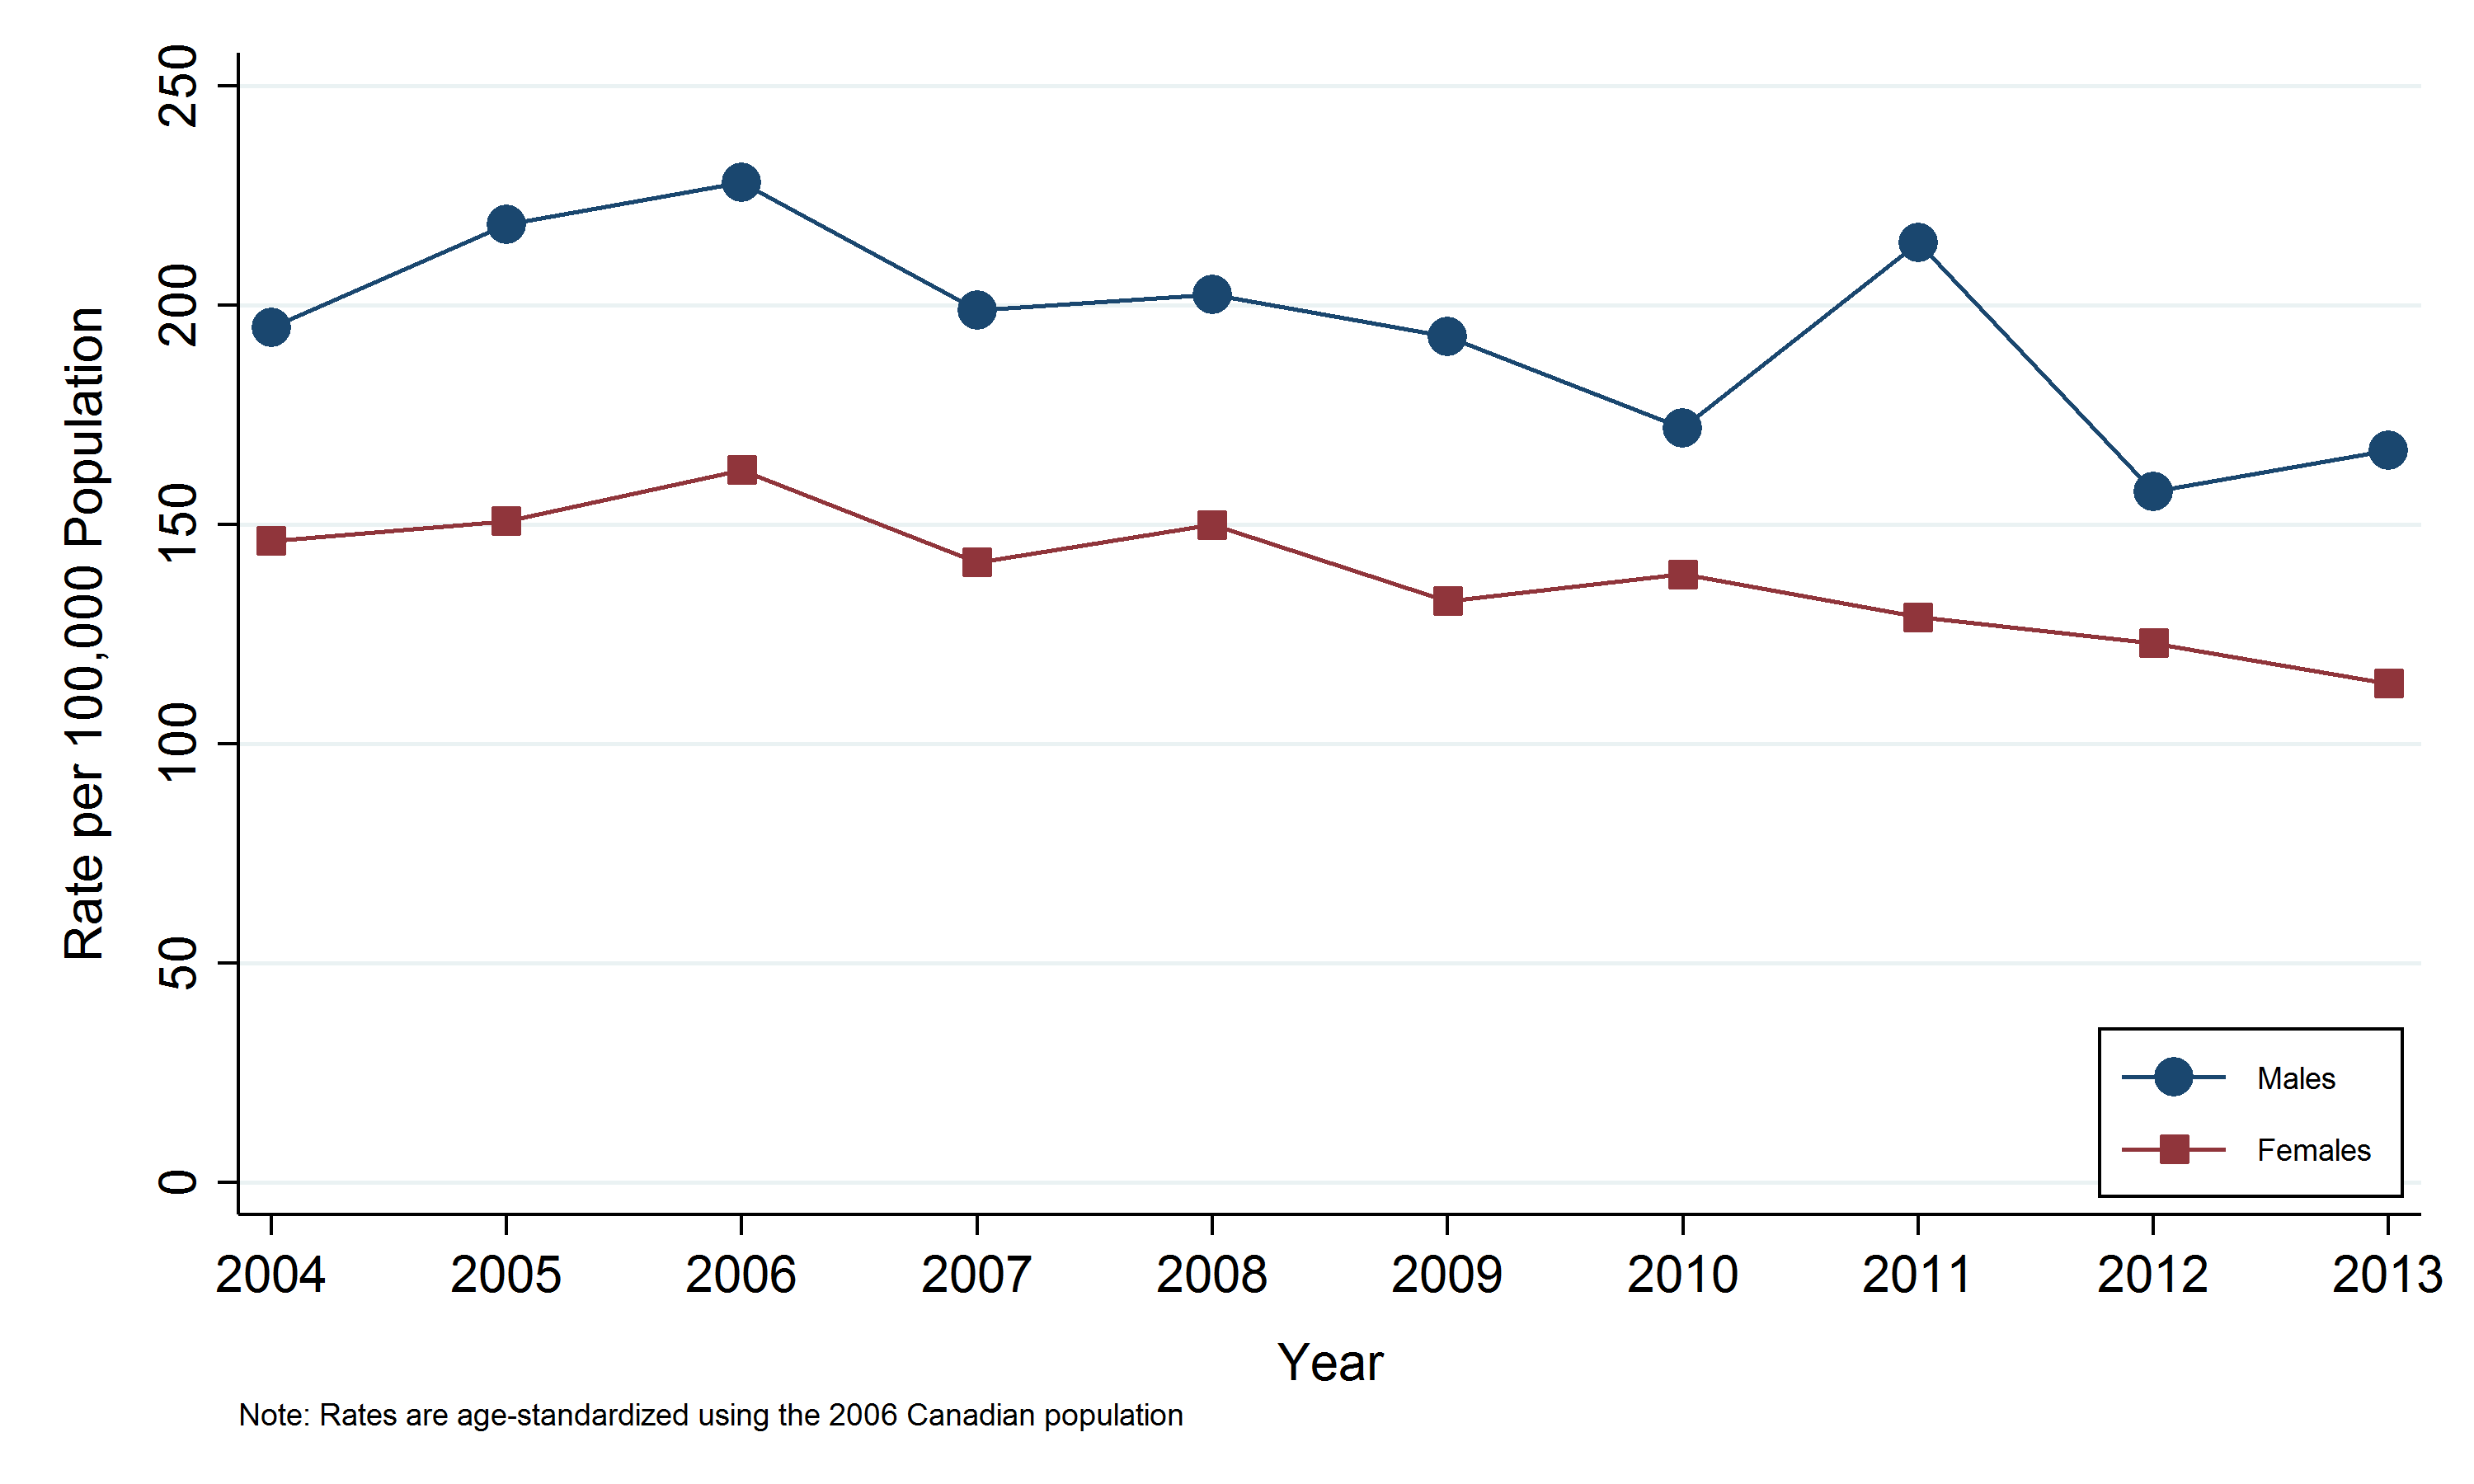
- In the SDHU area, the rate of hospitalization due to stroke in 2013 was 167 hospitalizations per 100,000 males and 114 hospitalizations per 100,000 females.
- The rate of hospitalization due to stroke among males has been consistently higher than the rate among females.
- Between 2004 and 2013, the rate of hospitalization due to stroke among both males and females has generally decreased.
Notes:
- Rates are age-standardized using the 2006 Canadian population.
- Data Source: Inpatient Discharge Data and Population Estimates and Projections, Ontario Ministry of Health and Long-Term Care, IntelliHEALTH Ontario, Extracted April 2015.
Figure: Annual age-standardized hospitalization rate, stroke, by sex, Sudbury & District Health Unit (SDHU), 2004-2013

Table: Annual age-standardized hospitalization rate, stroke, by sex, Sudbury & District Health Unit (SDHU), 2004-2013
| Sex | 2004 | 2005 | 2006 | 2007 | 2008 | 2009 | 2010 | 2011 | 2012 | 2013 |
| Males | 194.9 | 218.4 | 227.9 | 198.8 | 202.3 | 192.8 | 172.0 | 214.2 | 157.6 | 166.9 |
| Females | 146.2 | 150.8 | 162.4 | 141.4 | 149.9 | 132.5 | 138.6 | 128.8 | 123.0 | 113.8 |
Table: Annual number of hospitalization cases, stroke, by sex, Sudbury & District Health Unit (SDHU), 2004-2013.
| Sex | 2004 | 2005 | 2006 | 2007 | 2008 | 2009 | 2010 | 2011 | 2012 | 2013 |
| Males | 178 | 208 | 219 | 194 | 192 | 197 | 181 | 224 | 169 | 184 |
| Females | 167 | 172 | 190 | 168 | 180 | 166 | 175 | 169 | 165 | 149 |
Stroke hospitalizations by age group
Key findings:
- In 2013, the highest number of hospitalizations due to stroke was in the 75 and over age group, with 144 hospitalizations among residents of the SDHU area.
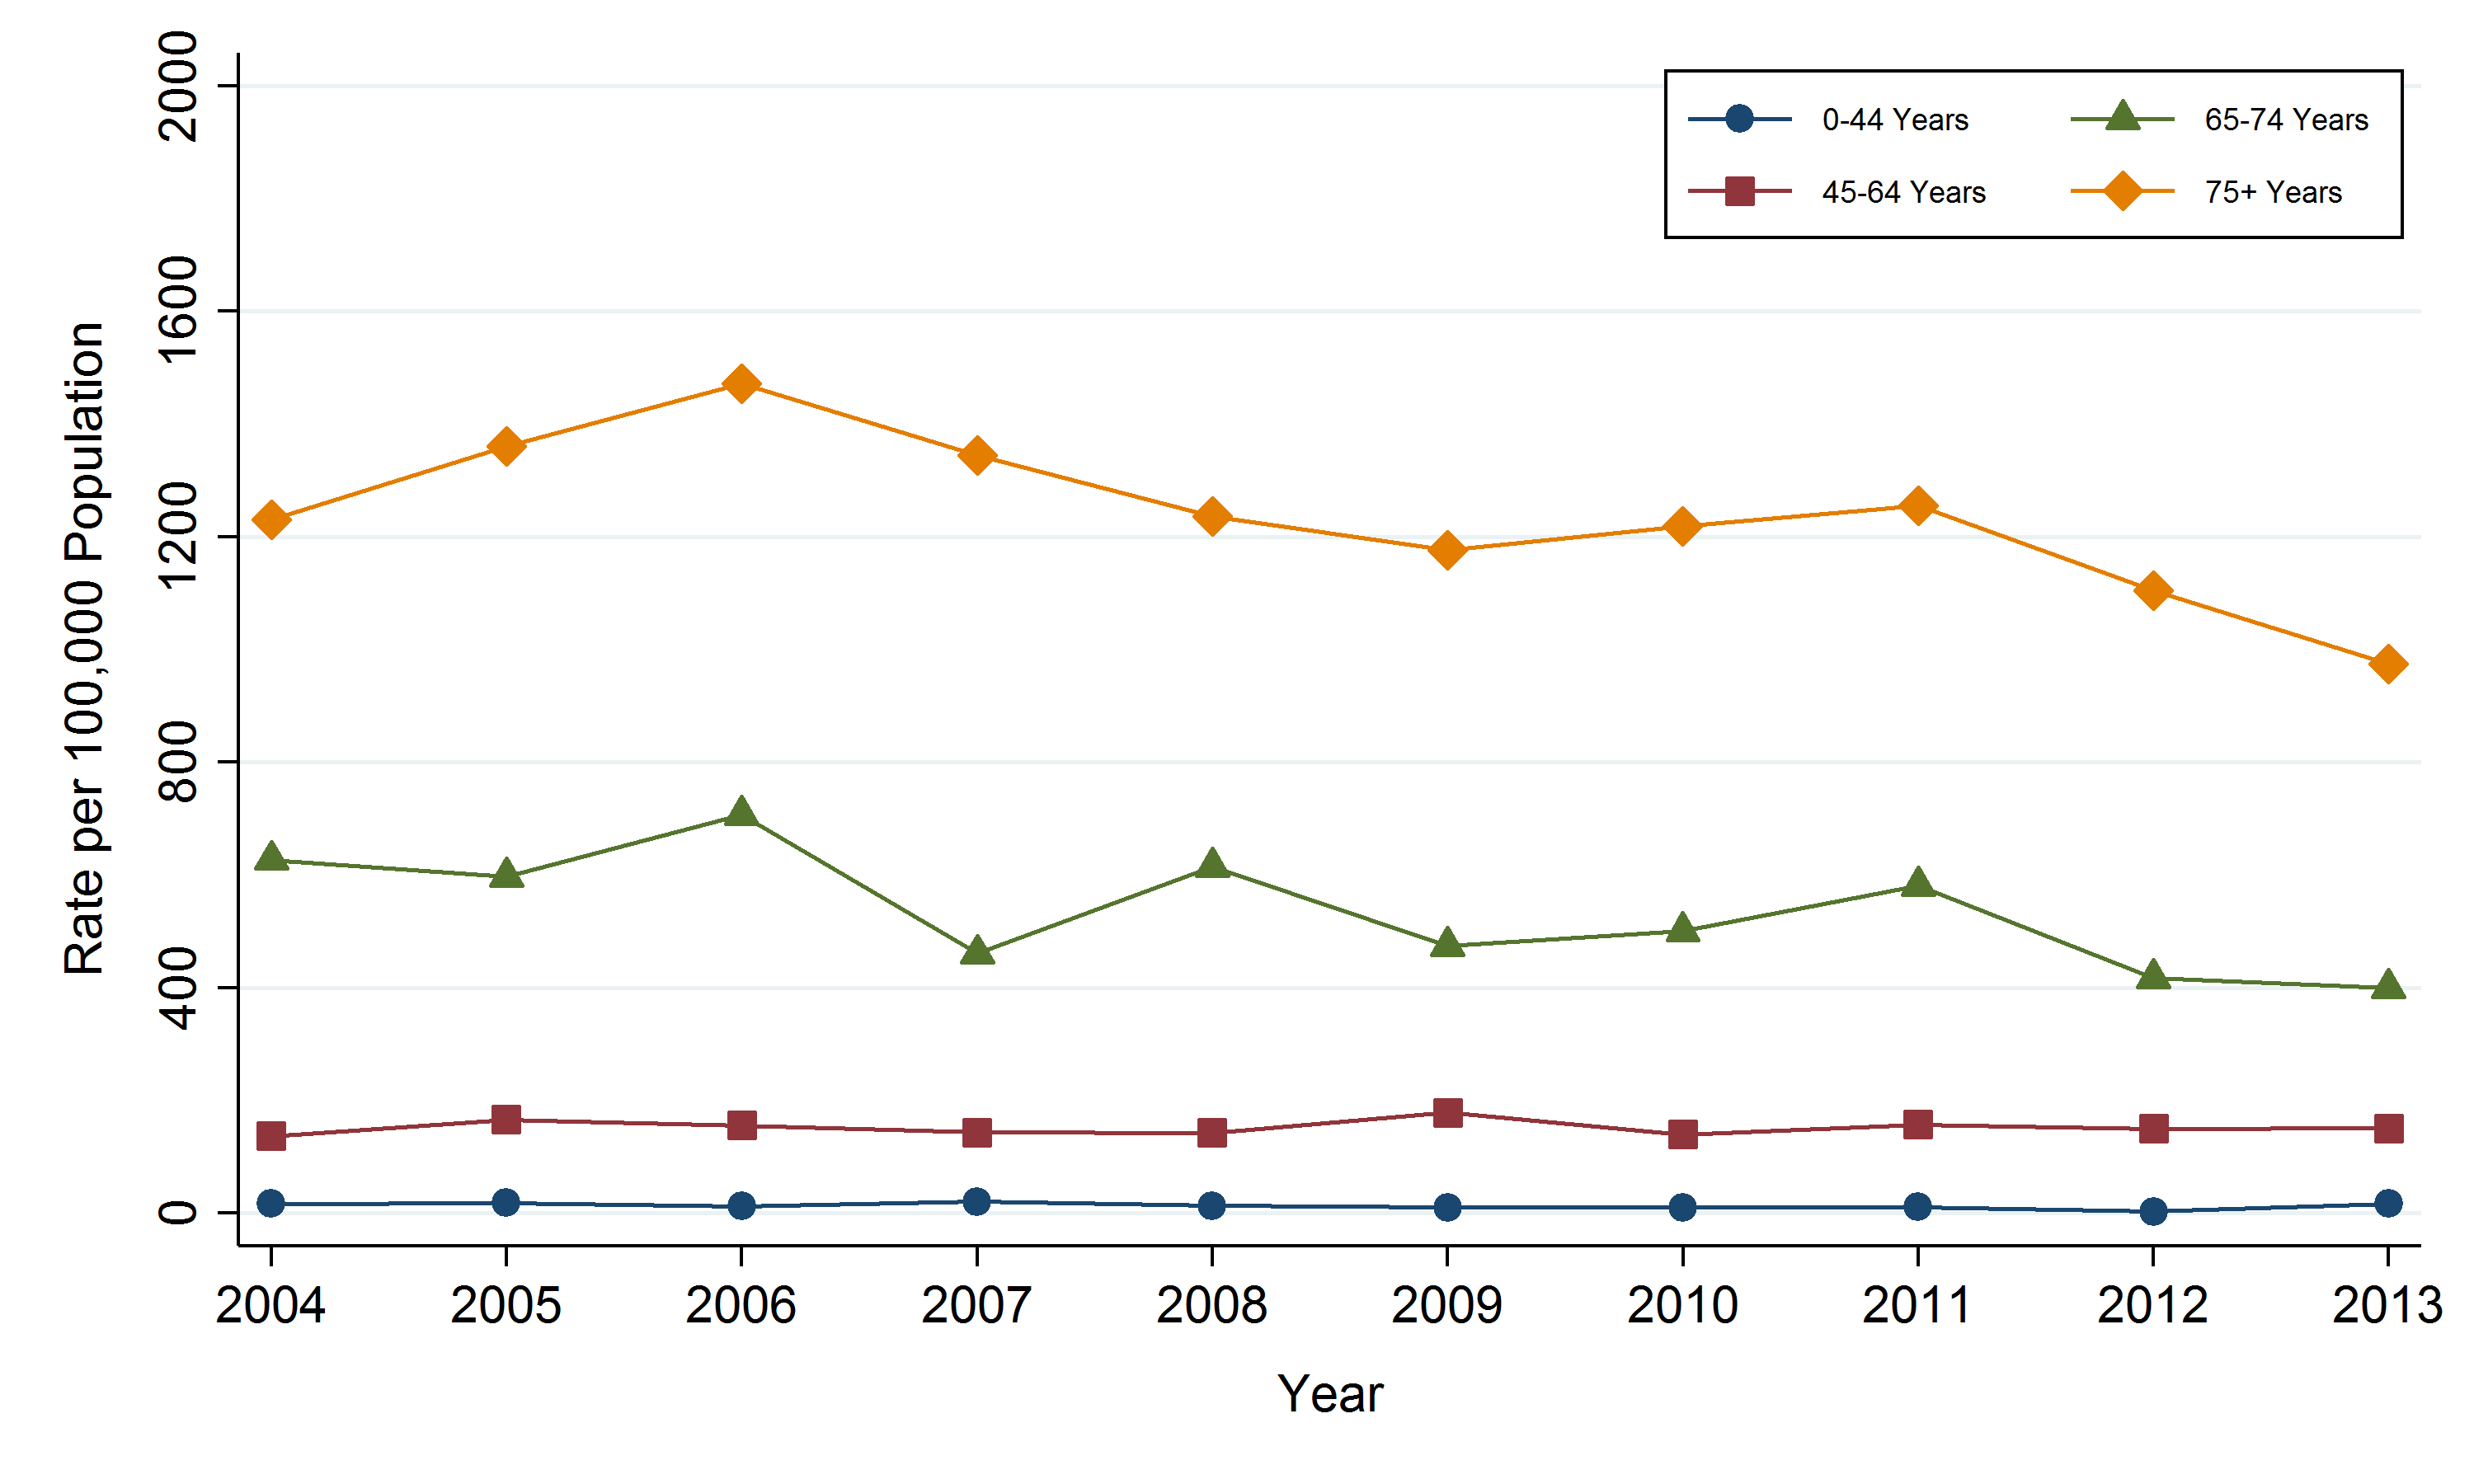
- In the SDHU area, the highest rate of hospitalization due to stroke was in the 75 and over age group, with 975 hospitalizations per 100,000 population.
- The rate of hospitalization due to stroke increases with age.
- Between 2004 and 2013, the rate of hospitalization due to stroke has generally decreased in residents of the SDHU area over 65 years of age.
Notes:
- Data Source: Inpatient Discharge Data and Population Estimates and Projections, Ontario Ministry of Health and Long-Term Care, IntelliHEALTH Ontario, Extracted April 2015.
Figure: Annual hospitalization rate, stroke, by age group, Sudbury & District Health Unit (SDHU), 2004-2013
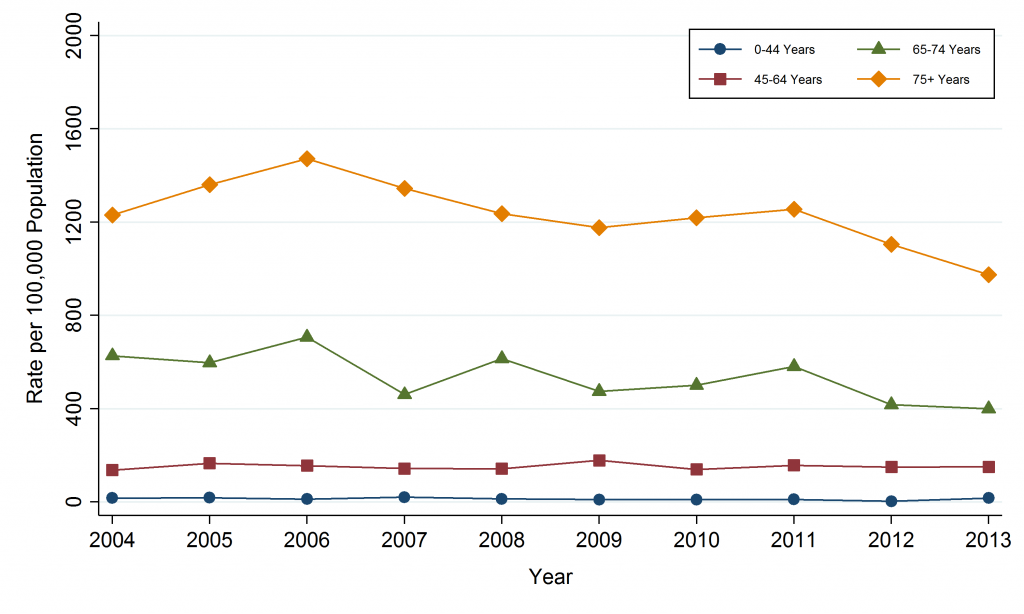
Table: Annual hospitalization rate, stroke, by age group, Sudbury & District Health Unit (SDHU), 2004-2013
| Age Group (Years) | 2004 | 2005 | 2006 | 2007 | 2008 | 2009 | 2010 | 2011 | 2012 | 2013 |
| 0-44 | 17.4 | 18.5 | 12.4 | 20.6 | 13.6 | 10.1 | 10.3 | 11.3 | 2.9 | 17.3 |
| 45-64 | 137.3 | 166.4 | 156.0 | 143.8 | 142.5 | 178.3 | 139.8 | 157.2 | 149.9 | 151.1 |
| 65-74 | 627.1 | 597.6 | 706.6 | 460.5 | 615.1 | 474.0 | 500.2 | 581.6 | 417.3 | 400.1 |
| 75+ | 1230.8 | 1360.3 | 1471.6 | 1344.2 | 1236.3 | 1176.2 | 1218.7 | 1255.4 | 1104.3 | 974.6 |
Table: Annual number of hospitalization cases, stroke, by age group, Sudbury & District Health Unit (SDHU), 2004-2013
| Age Group (Years) | 2004 | 2005 | 2006 | 2007 | 2008 | 2009 | 2010 | 2011 | 2012 | 2013 |
| 0-44 | 20 | 21 | 14 | 23 | 15 | 11 | 11 | 12 | 3 | 18 |
| 45-64 | 75 | 93 | 89 | 84 | 85 | 108 | 86 | 97 | 92 | 92 |
| 65-74 | 100 | 96 | 115 | 76 | 104 | 82 | 88 | 105 | 79 | 79 |
| 75+ | 150 | 170 | 191 | 179 | 168 | 162 | 171 | 179 | 160 | 144 |
Stroke deaths by geographic area
Key findings:
- In the SDHU area, there were 86 deaths due to stroke in 2011.
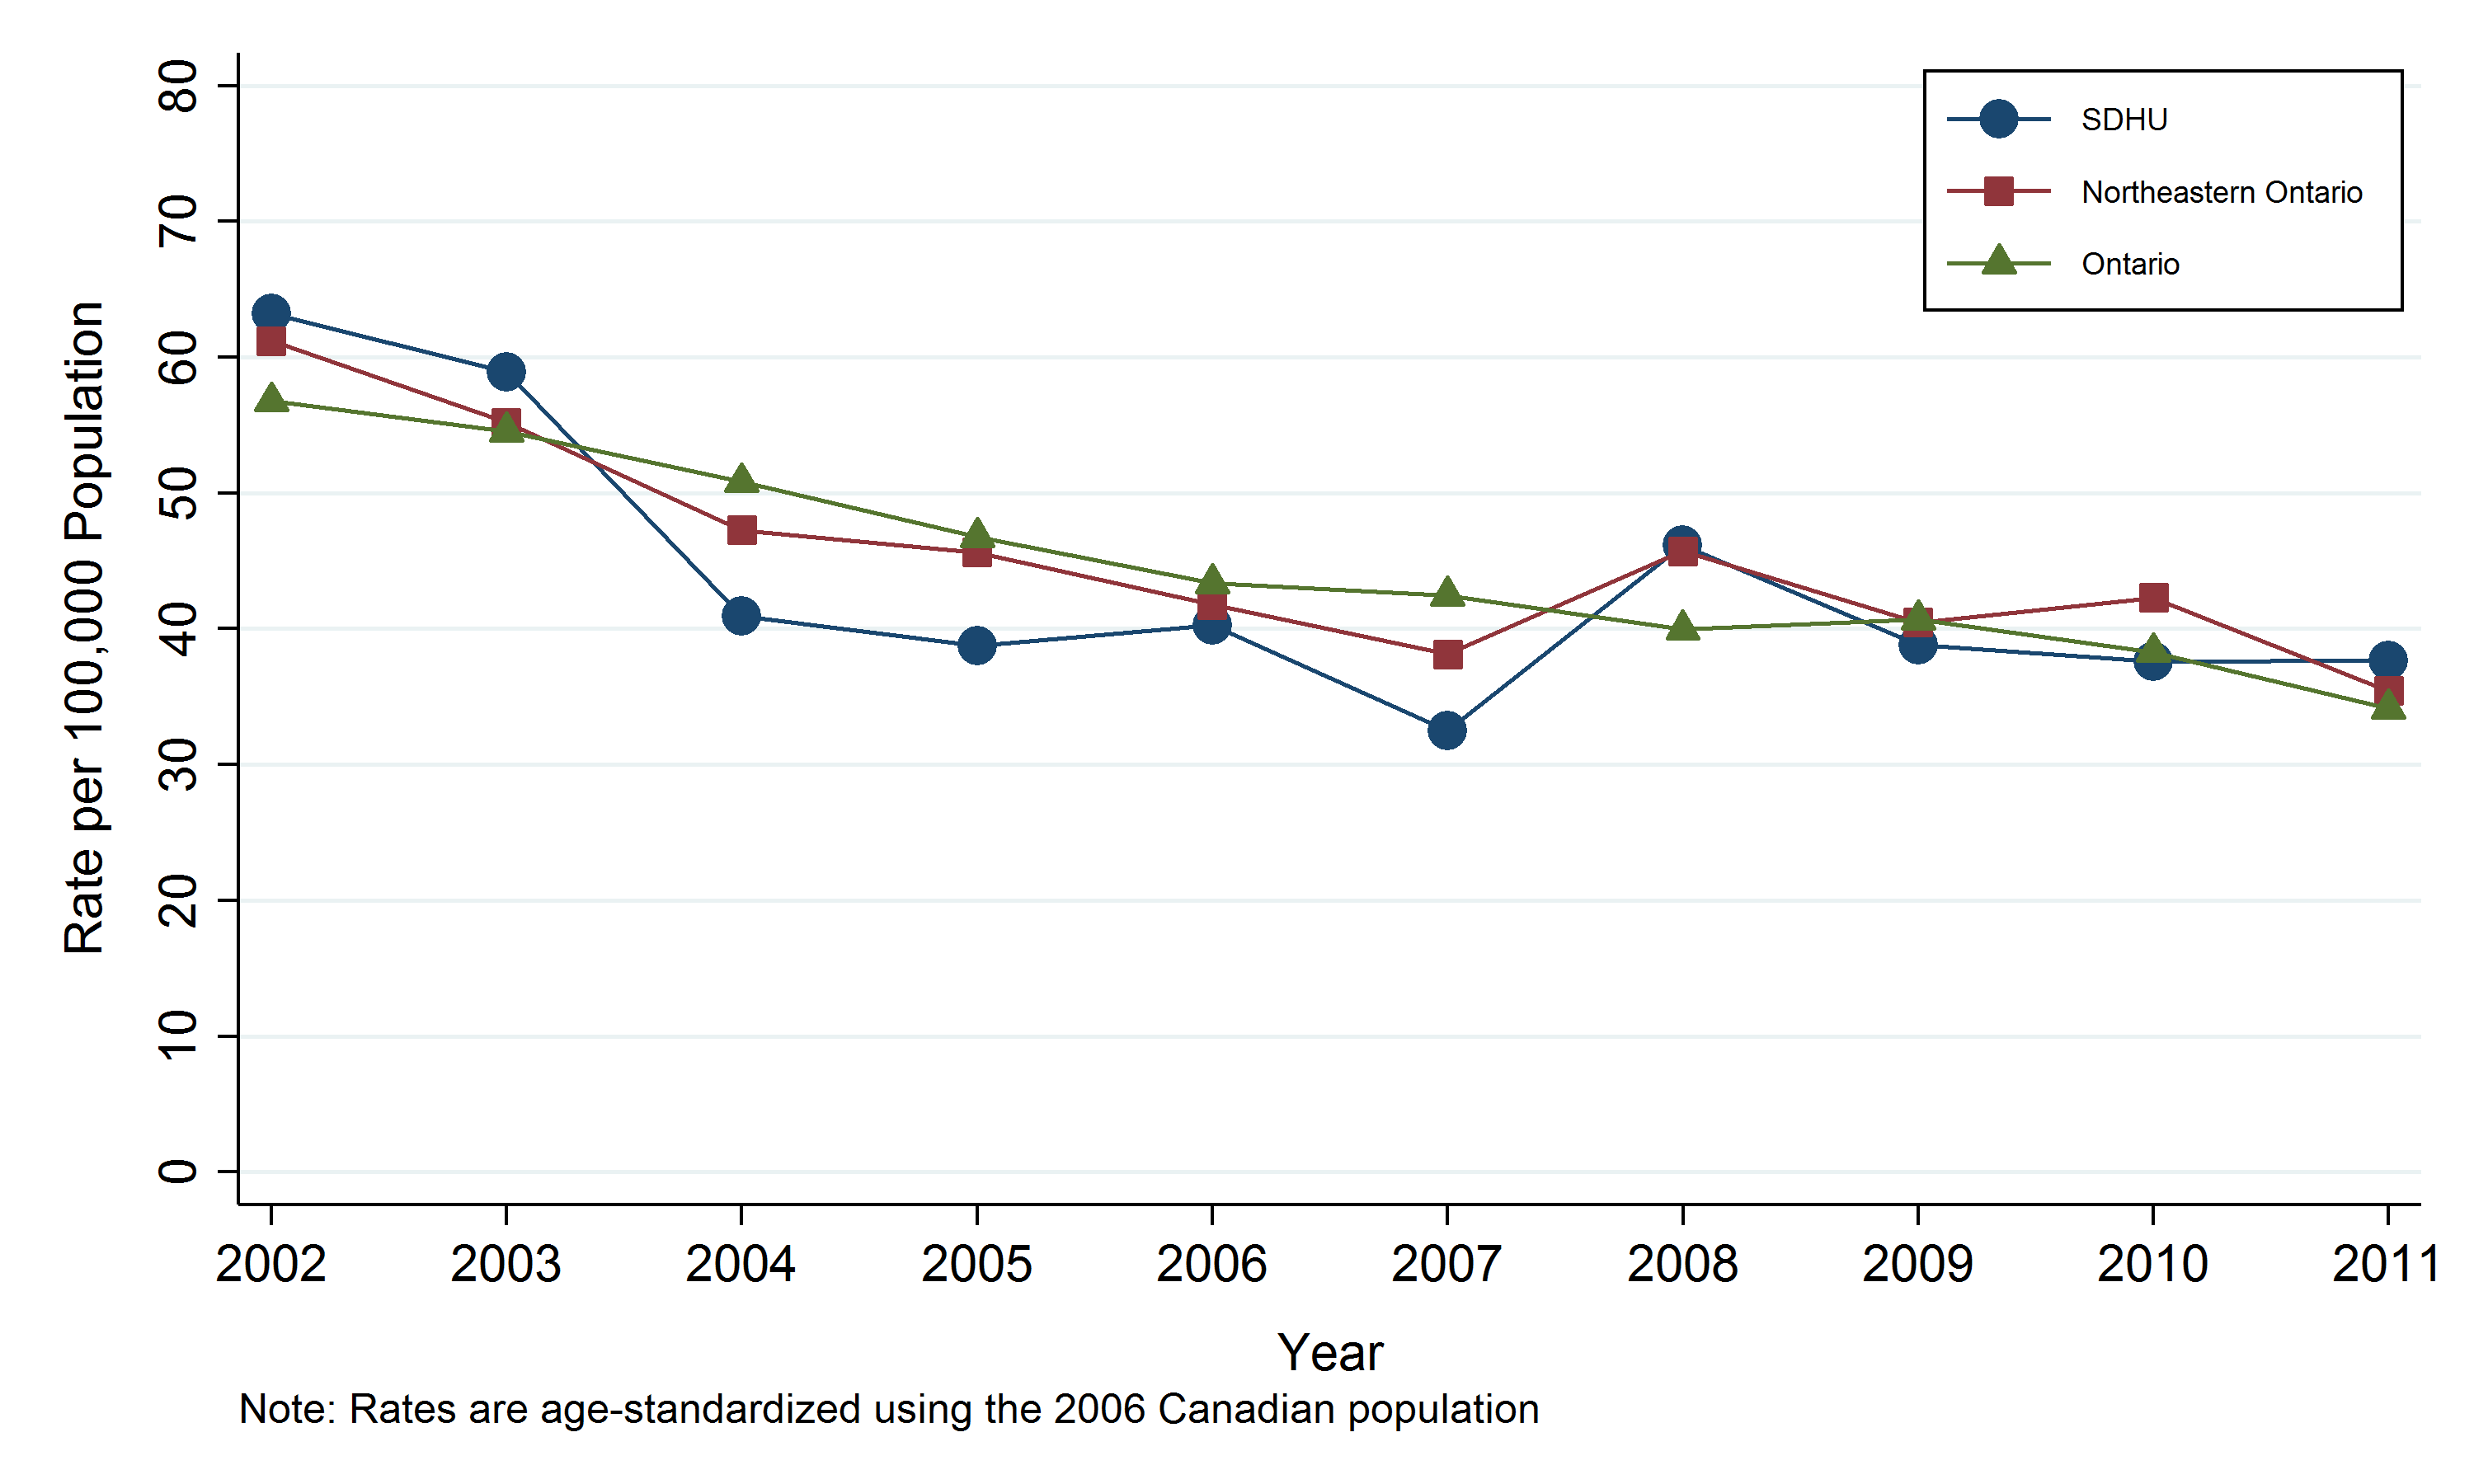
- In 2011, the stroke mortality rate in the SDHU area was 38 per 100,000 population.
- The stroke mortality rates in the SDHU area, northeastern Ontario, and Ontario have been fairly similar, despite fluctuations.
- Between 2002 and 2011, the stroke mortality rate in the SDHU area has decreased.
Notes:
- Rates are age-standardized using the 2006 Canadian population.
- Data Source: Mortality Data and Population Estimates and Projections, Ontario Ministry of Health and Long-Term Care, IntelliHEALTH Ontario, Extracted April 2015.
Figure: Annual age-standardized mortality rate, stroke, by geographic area, 2002-2011

Table: Annual age-standardized mortality rate, stroke, by geographic area, 2002-2011
| Geographic Region | 2002 | 2003 | 2004 | 2005 | 2006 | 2007 | 2008 | 2009 | 2010 | 2011 |
| SDHU | 63.2 | 58.9 | 40.9 | 38.8 | 40.3 | 32.5 | 46.1 | 38.8 | 37.6 | 37.7 |
| Northeast | 61.2 | 55.2 | 47.3 | 45.6 | 41.8 | 38.1 | 45.7 | 40.5 | 42.3 | 35.4 |
| Ontario | 56.8 | 54.6 | 50.8 | 46.8 | 43.4 | 42.5 | 40.0 | 40.7 | 38.3 | 34.1 |
Table: Annual number of mortality cases, stroke, by geographic area, 2002-2011
| Geographic Region | 2002 | 2003 | 2004 | 2005 | 2006 | 2007 | 2008 | 2009 | 2010 | 2011 |
| SDHU | 111 | 104 | 79 | 76 | 80 | 65 | 96 | 84 | 83 | 86 |
| Northeast | 329 | 308 | 274 | 272 | 255 | 236 | 296 | 264 | 286 | 250 |
| Ontario | 5905 | 5873 | 5673 | 5424 | 5247 | 5314 | 5163 | 5430 | 5306 | 4921 |
Stroke potential years of life lost (PYLL) by geographic area
Key findings:
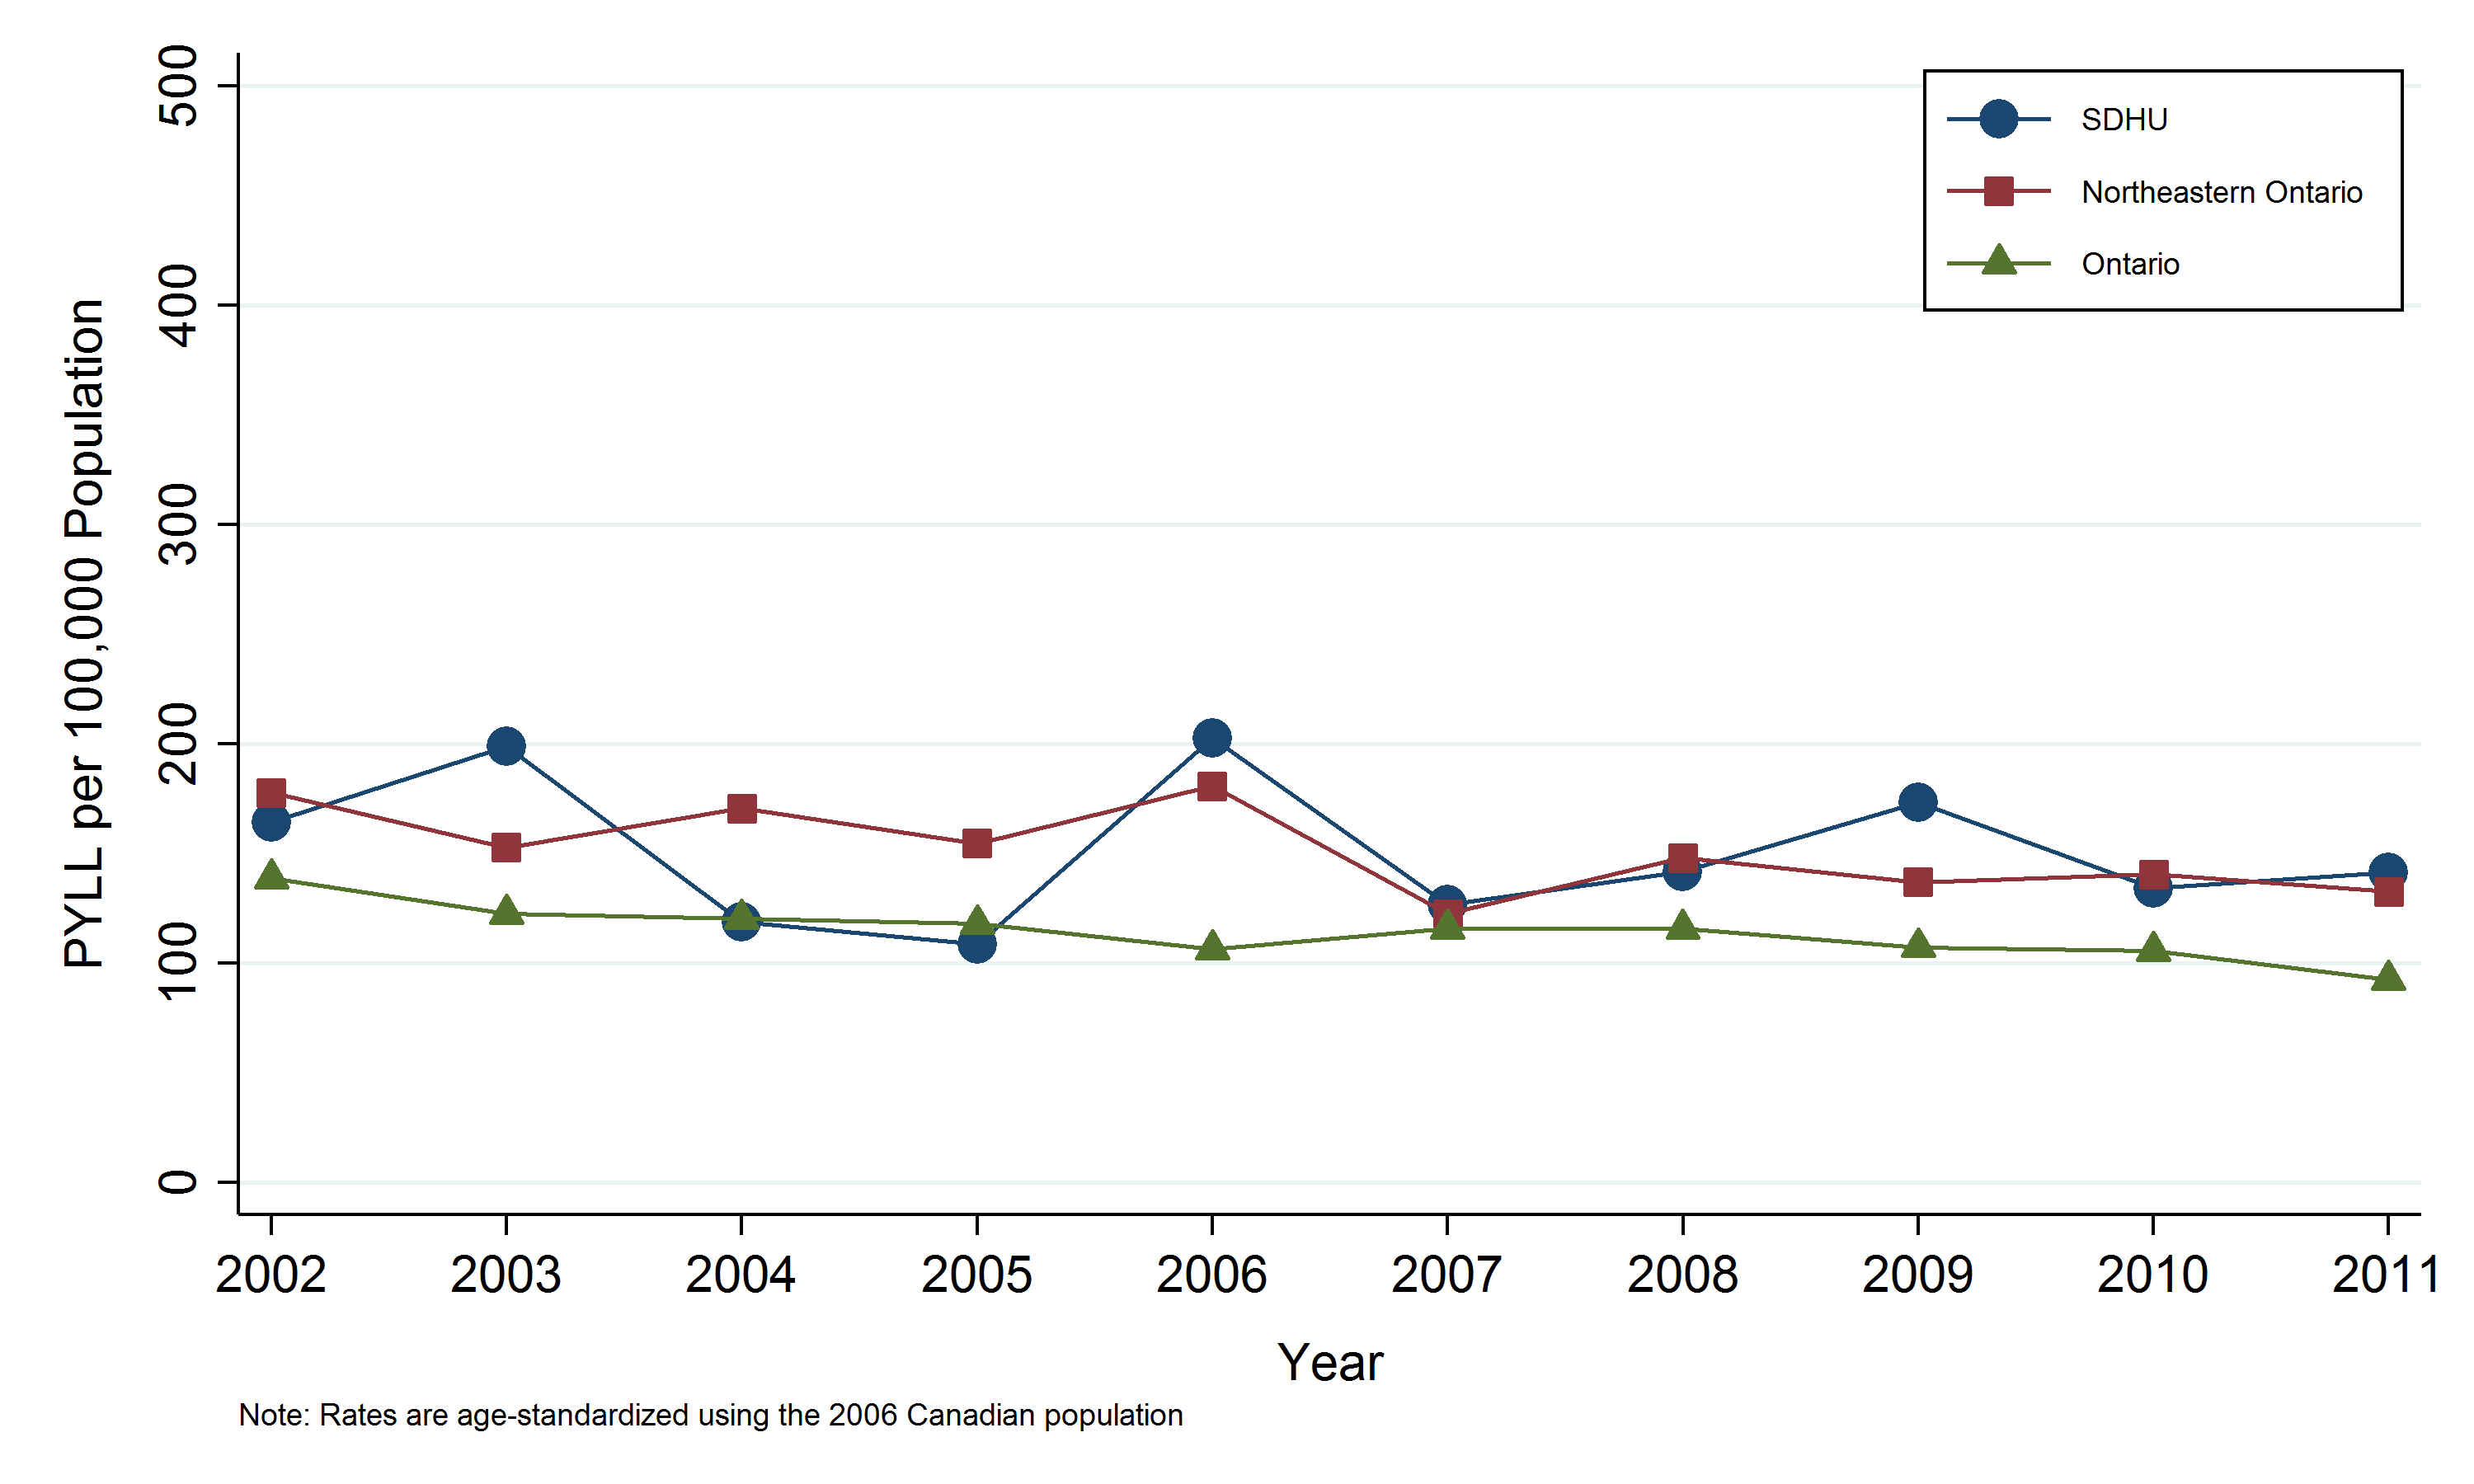
- In 2011, the SDHU area residents lost 326 years of potential life due to deaths from stroke before the age of 75.
- The rate of potential years of life lost (PYLLs) in the SDHU area due to stroke was 141 PYLL per 100,000 population.
- The rate of PYLL due to stroke in the SDHU area has been similar to the rate in northeastern Ontario, while the rates in both areas have generally been higher than the rate in Ontario.
- Between 2002 and 2011, the rate of PYLL due to stroke in the SDHU area has been fairly stable.
Notes:
- Rates are age-standardized using the 2006 Canadian population.
- Data Source: Mortality Data and Population Estimates and Projections, Ontario Ministry of Health and Long-Term Care, IntelliHEALTH Ontario, Extracted April 2015.
Figure: Annual age-standardized rate of potential years of life lost (PYLL), stroke, by geographic area, 2002-2011

Table: Annual age-standardized rate of potential years of life lost (PYLL), stroke, by geographic area, 2002-2011
| Geographic Region | 2002 | 2003 | 2004 | 2005 | 2006 | 2007 | 2008 | 2009 | 2010 | 2011 |
| SDHU | 164.2 | 198.7 | 118.6 | 108.4 | 202.7 | 126.6 | 141.8 | 173.3 | 134.3 | 141.3 |
| Northeast | 177.6 | 152.6 | 170.4 | 154.5 | 180.7 | 122.4 | 148.0 | 136.9 | 140.4 | 132.5 |
| Ontario | 138.6 | 122.4 | 120.3 | 117.8 | 106.4 | 115.7 | 115.7 | 107.2 | 105.7 | 92.3 |
Table: Annual number of potential years of life lost (PYLL), stroke, by geographic area, 2002-2011
| Geographic Region | 2002 | 2003 | 2004 | 2005 | 2006 | 2007 | 2008 | 2009 | 2010 | 2011 |
| SDHU | 326 | 391 | 241 | 221 | 400 | 259 | 293 | 359 | 281 | 326 |
| Northeast | 1031 | 912 | 1002 | 921 | 1065 | 740 | 901 | 831 | 863 | 854 |
| Ontario | 15176 | 13627 | 13772 | 13774 | 12711 | 14140 | 14472 | 13749 | 13782 | 12408 |
This item was last modified on March 26, 2018