All Injuries and poisonings
The injuries in this section include all injuries and poisonings except those resulting from complications of medical or surgical care, which are excluded.
Emergency department (ED) visits due to all injuries and poisonings by geographic region
Key findings:
- Among residents of the Sudbury & District Health Unit (SDHU) area, there were a total of 20,726 emergency department (ED) visits due to injuries and poisonings in 2015.
- In 2015, the ED visits rate for all injuries and poisonings in the SDHU area was 106.8 per 1,000 population per year.
- The rate of ED visits for all injuries and poisonings in the SDHU area has been consistently lower than that of northeastern Ontario, yet higher than the rate for Ontario overall.
- Between 2006 and 2015, the rate of ED visits for all injuries and poisonings in the SDHU area remained stable over time.
Notes:
- Geographic areas and/or time periods in which there is less access to walk-in clinics and other alternatives to the local ED can be expected to have higher rates of injury-related ED visits than they would otherwise.
- Rates are age-standardized using the 2011 Canadian population.
- Data Source: Ambulatory Emergency External Cause 2006 to 2015 (extracted June 6, 2016) and Population Estimates 2006 to 2015 (extracted October 7, 2016), Ontario Ministry of Health and Long-Term Care, IntelliHEALTH Ontario.
Figure: Annual age-standardized rate of emergency department visits, all injuries and poisonings, by geographic region, 2006 to 2015
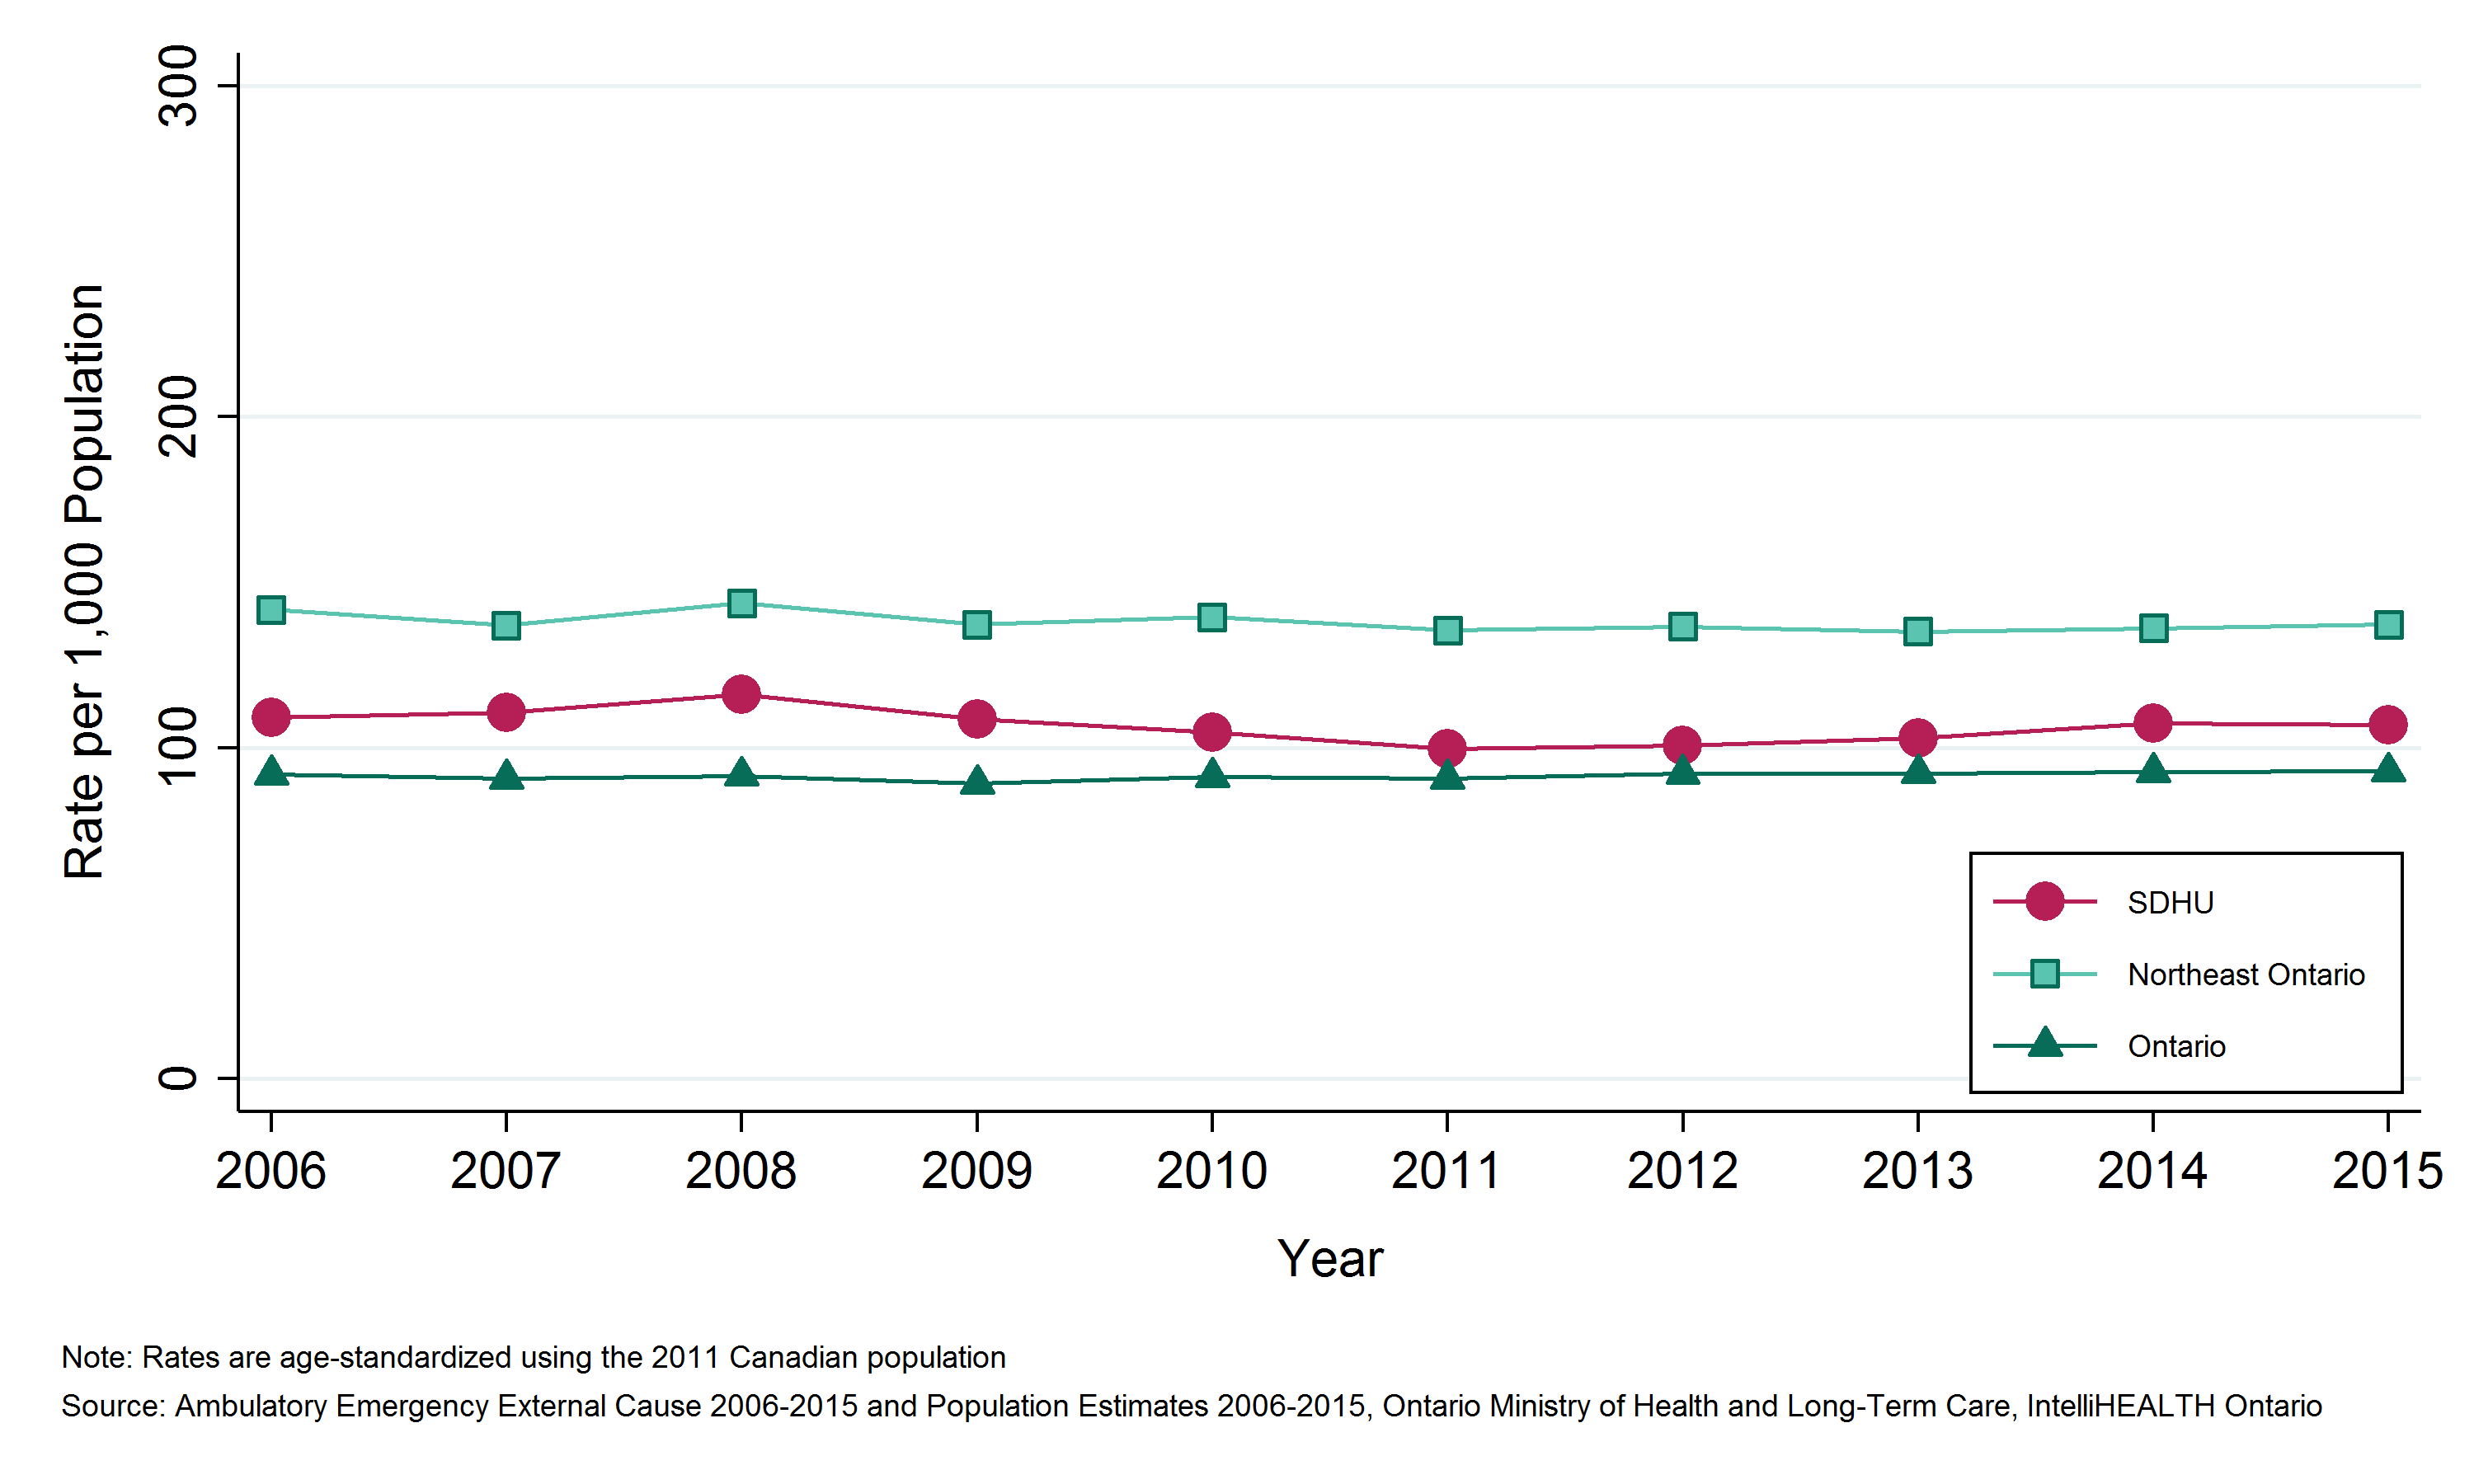
Table: Annual age-standardized rate of emergency department visits, all injuries and poisonings, by geographic region, 2006 to 2015
| Geographic Region | 2006 | 2007 | 2008 | 2009 | 2010 | 2011 | 2012 | 2013 | 2014 | 2015 |
| SDHU | 109.2 | 110.5 | 116.1 | 108.7 | 104.7 | 99.6 | 100.7 | 102.8 | 107.5 | 106.8 |
| Northeast | 141.7 | 137.0 | 143.6 | 137.3 | 139.5 | 135.5 | 136.6 | 135.1 | 136.1 | 137.3 |
| Ontario | 92.0 | 90.7 | 91.6 | 89.1 | 91.2 | 90.7 | 92.2 | 92.3 | 92.8 | 92.9 |
Table: Annual number of emergency department visits, all injuries and poisonings, by geographic region, 2006 to 2015
| Geographic Region | 2006 | 2007 | 2008 | 2009 | 2010 | 2011 | 2012 | 2013 | 2014 | 2015 |
| SDHU | 21,737 | 22,004 | 23,124 | 21,636 | 20,748 | 19,696 | 19,858 | 20,204 | 21,047 | 20,726 |
| Northeast | 80,392 | 77,527 | 80,973 | 77,047 | 78,084 | 75,634 | 75,782 | 74,611 | 74,889 | 74,889 |
| Ontario | 1,177,649 | 1,168,758 | 1,187,973 | 1,164,175 | 1,203,761 | 1,206,641 | 1,238,825 | 1,249,908 | 1,267,734 | 1,278,175 |
Leading causes of injury by geographic region
Key findings:
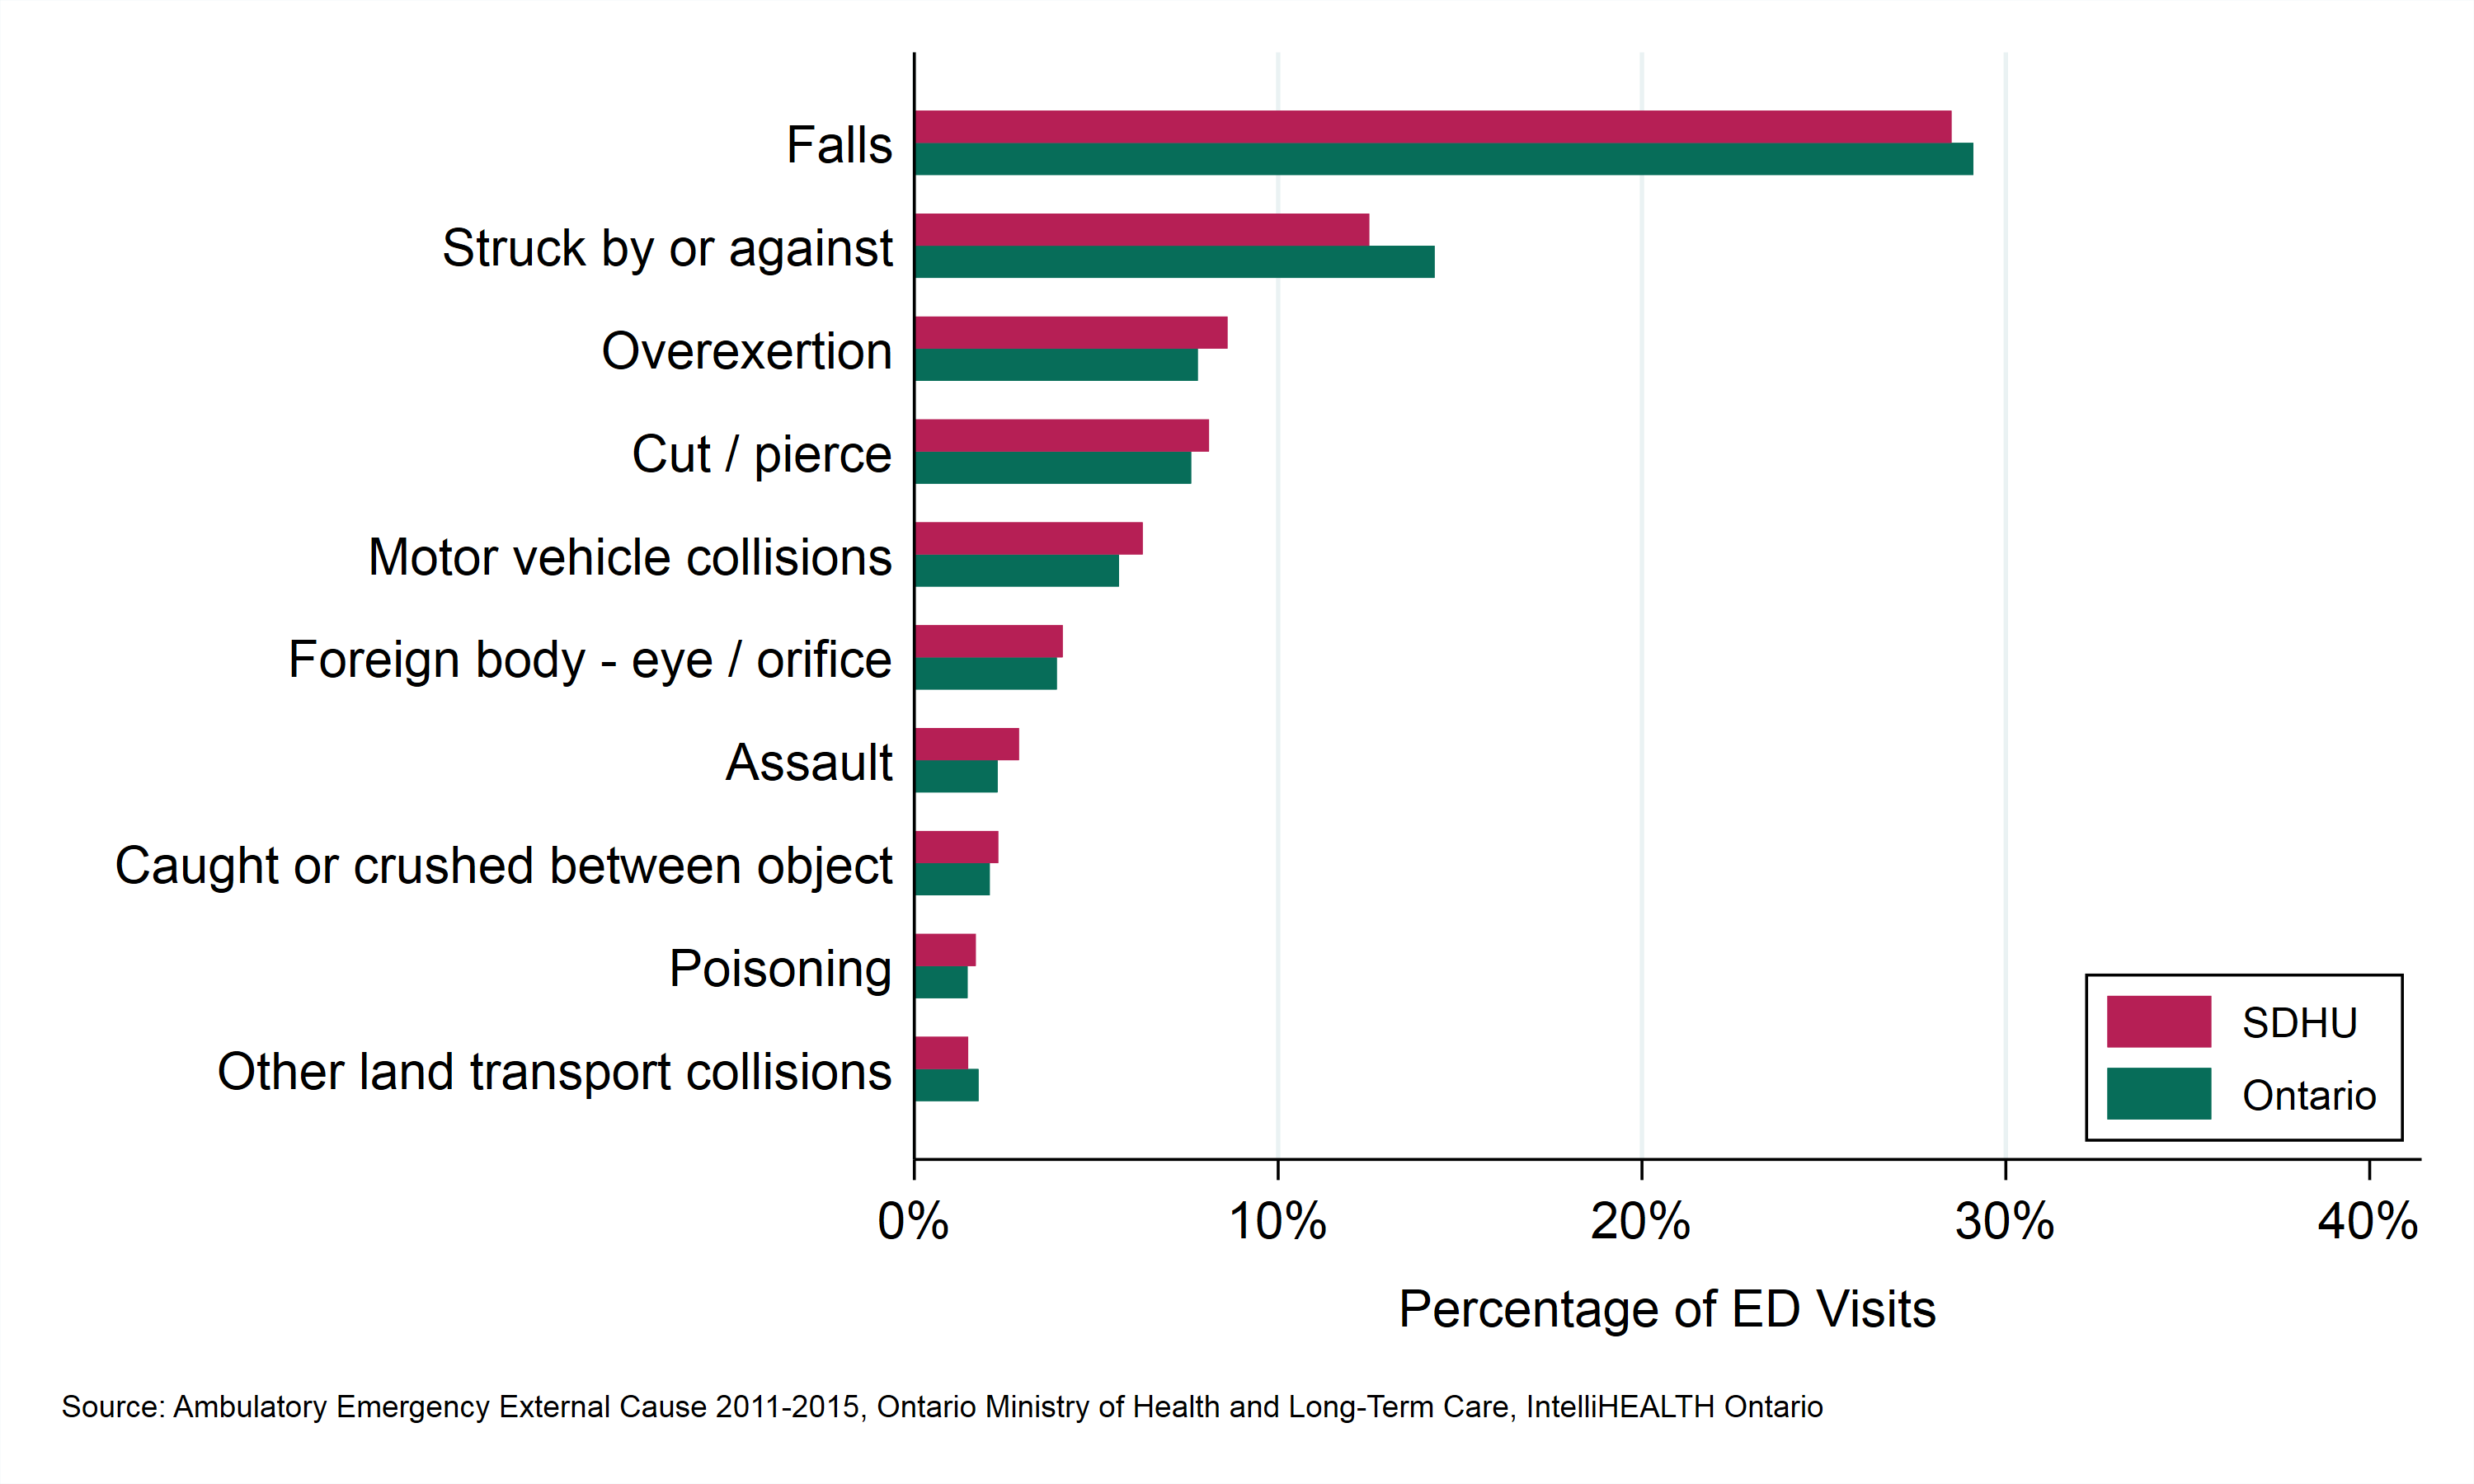
- The most common cause of injury-related emergency department visits among the Sudbury & District Health Unit (SDHU) area residents between 2011 and 2015 was falls, which accounted for 29% of all visits. Being struck by or against an object was the second-most common cause, at 13%.
- Between 2011 and 2015, an average of 6,600 people in the SDHU area were treated in emergency departments each year due to a fall, while 2,895 people on average were treated for an injury due to being struck by or against an object.
- The percentage of injuries and poisonings due to both falls and being struck by or against an object in the SDHU area was slightly lower than the percentage of injuries and poisonings by these causes in Ontario.
Notes:
- Data Source: Ambulatory Emergency External Cause 2011 to 2015, Ontario Ministry of Health and Long-Term Care, IntelliHEALTH Ontario.
Figure: Leading causes of injury-related emergency department visits (%), by geographic region, 2011 to 2015
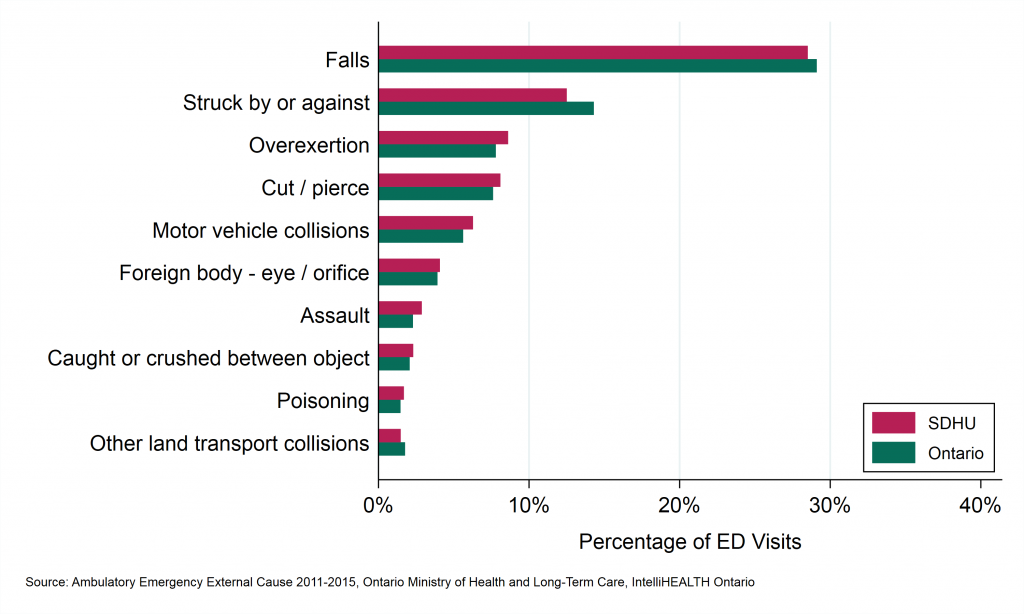
Table: Percent of leading causes of injury-related emergency department visits (%), by geographic region, 2011 to 2015
| Rank | Leading Cause | SDHU | Ontario |
| 1 | Falls | 28.5 | 29.1 |
| 2 | Struck by or against | 12.5 | 14.3 |
| 3 | Overexertion | 8.6 | 7.8 |
| 4 | Cut / pierce | 8.1 | 7.6 |
| 5 | Motor vehicle collisions | 6.3 | 5.6 |
| 6 | Foreign body - eye / orifice | 4.1 | 3.9 |
| 7 | Assault | 2.9 | 2.3 |
| 8 | Caught or crushed between object | 2.3 | 2.1 |
| 9 | Poisoning | 1.7 | 1.5 |
| 10 | Other land transport collisions | 1.5 | 1.8 |
Table: Annual number of leading causes of injury-related emergency department visits (%), by geographic region, 2006 to 2015
| Rank | Leading Cause | Total Count, SDHU | Total Counts, Ontario | Average Annual Count, SDHU | Average Annual Count, Ontario |
| 1 | Falls | 32,998 | 2,065,798 | 6,600 | 413,160 |
| 2 | Struck by or against | 14,474 | 1,014,829 | 2,895 | 202,966 |
| 3 | Overexertion | 9,965 | 552,987 | 1,993 | 110,597 |
| 4 | Cut / pierce | 9,376 | 540,067 | 1,875 | 108,013 |
| 5 | Motor vehicle collisions | 7,267 | 399,236 | 1,453 | 79,847 |
| 6 | Foreign body - eye / orifice | 4,722 | 278,077 | 944 | 55,615 |
| 7 | Assault | 3,331 | 162,567 | 666 | 32,513 |
| 8 | Caught or crushed between object | 2,670 | 147,147 | 534 | 29,429 |
| 9 | Poisoning | 1,955 | 103,958 | 391 | 20,792 |
| 10 | Other land transport collisions | 1,715 | 125,304 | 343 | 25,061 |
Emergency department (ED) visits due to all injuries and poisonings by Greater Sudbury and outlying areas
Key findings:
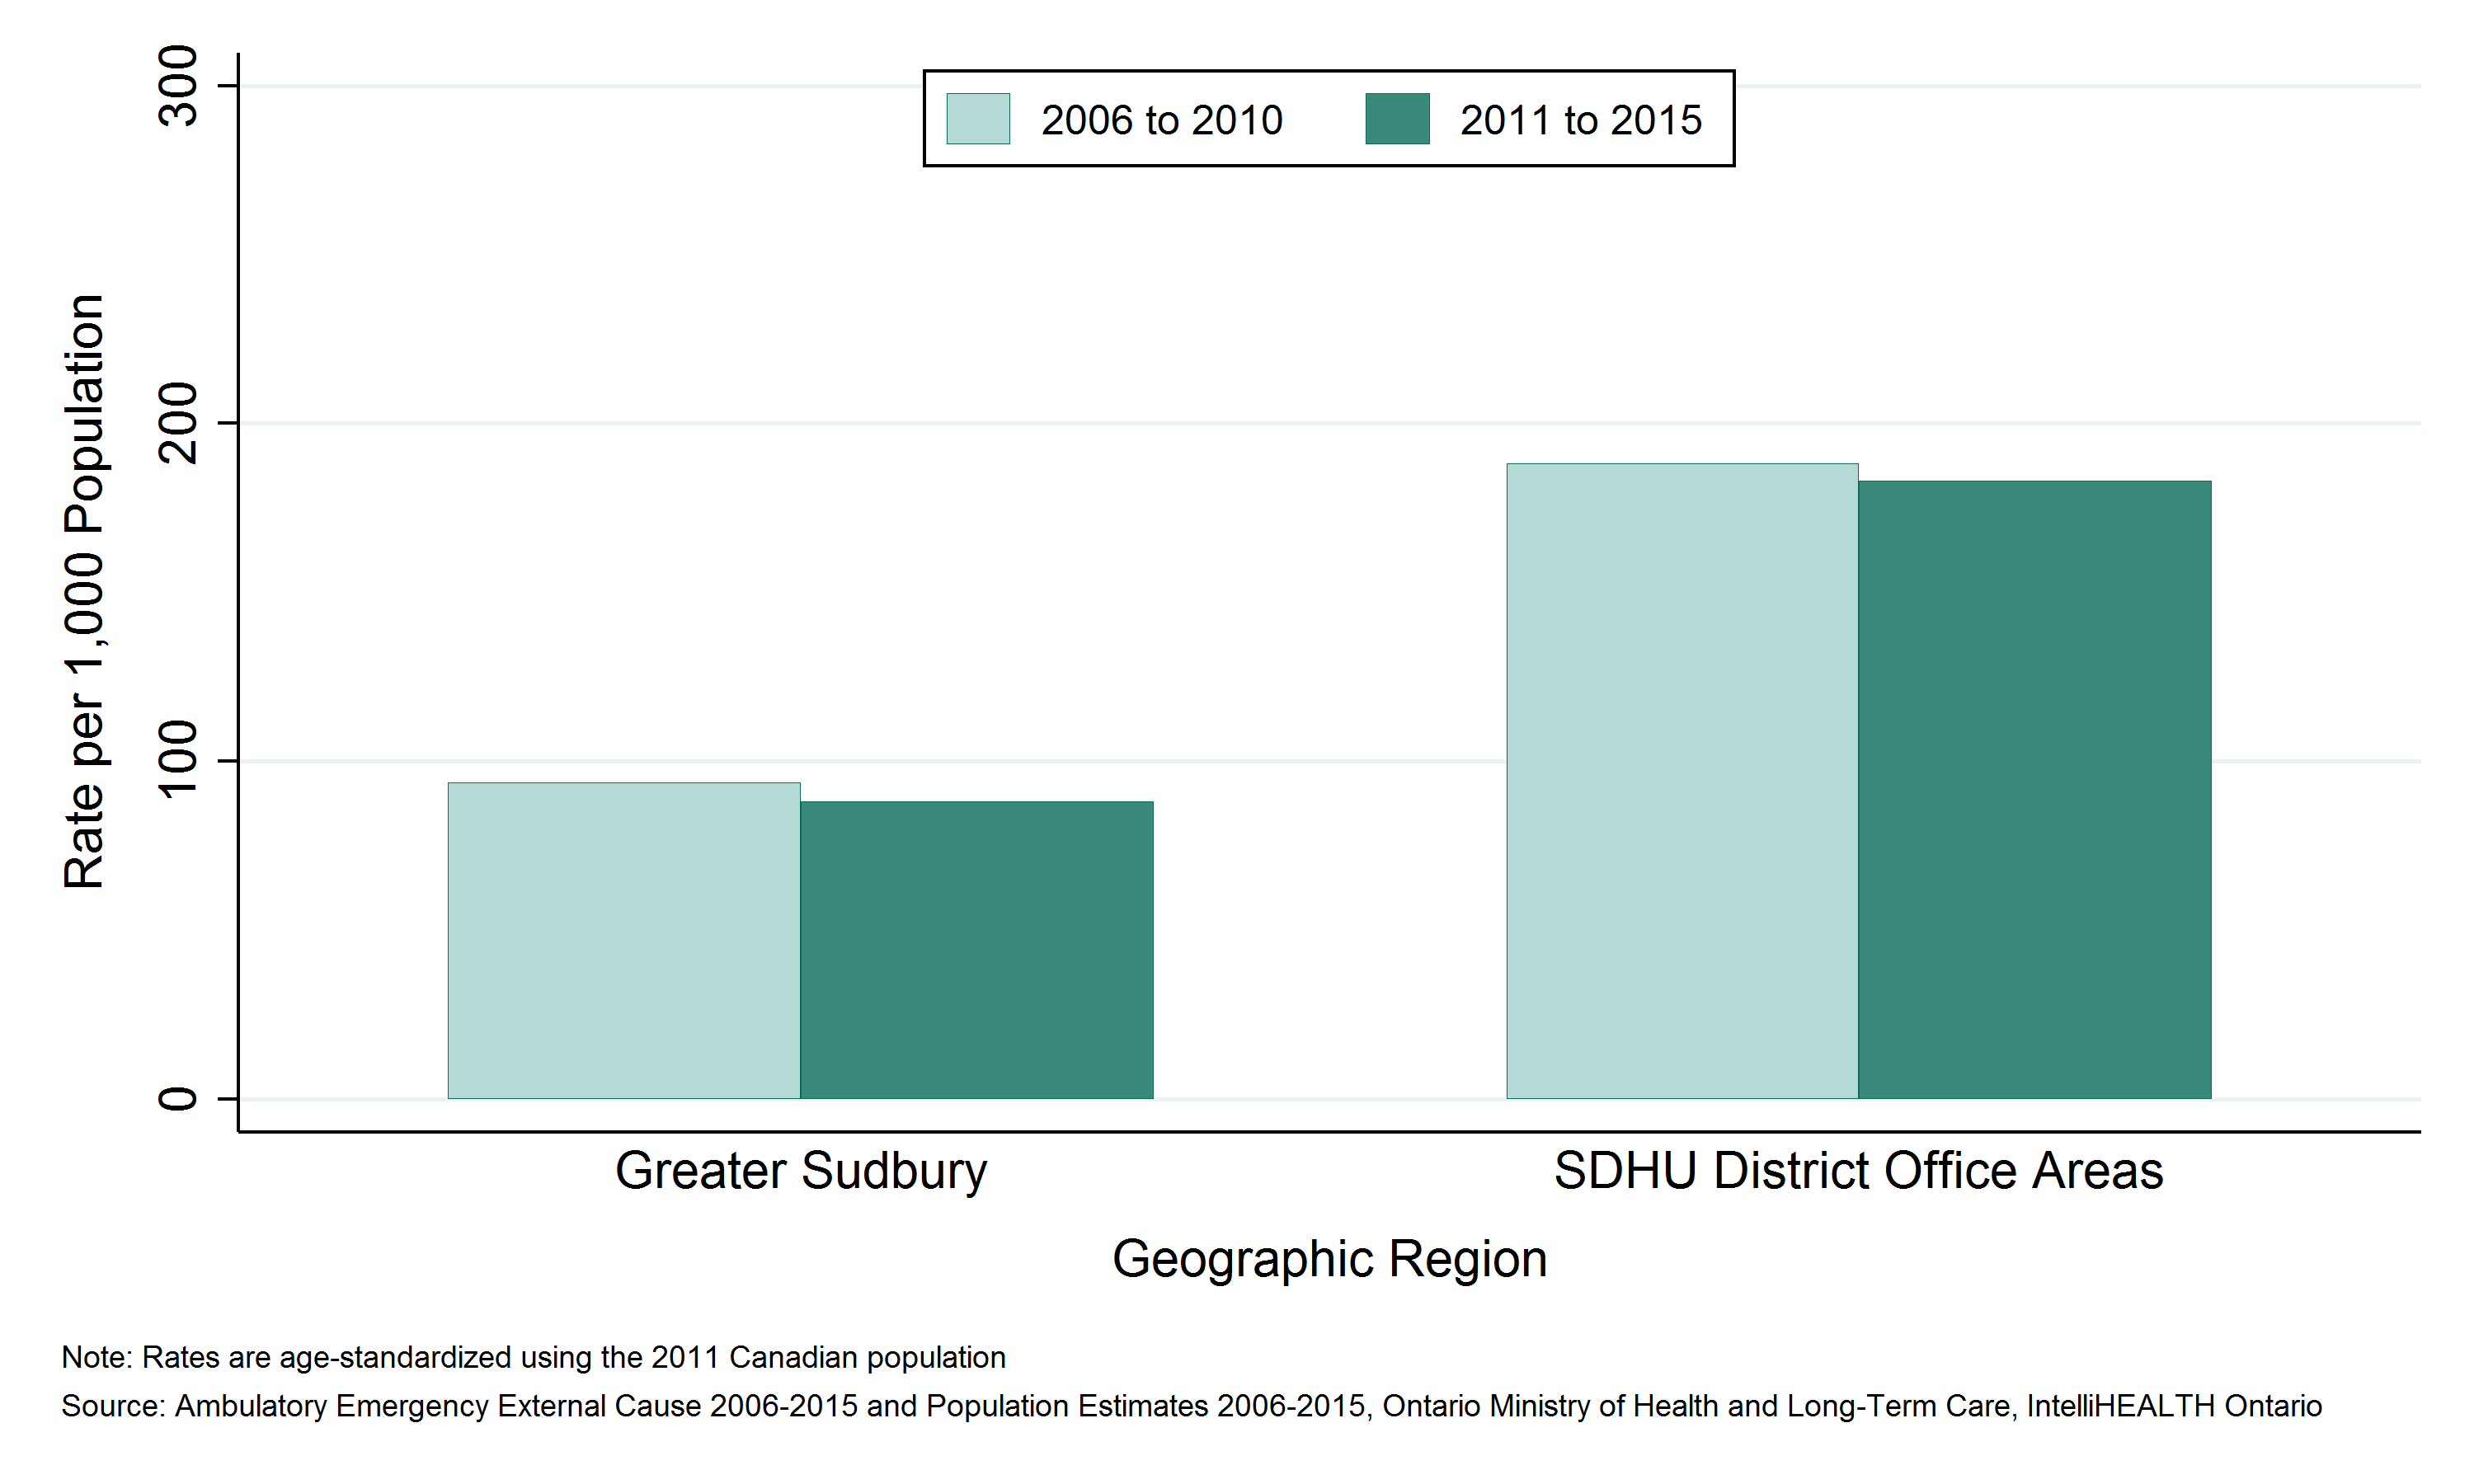
- Between 2011 and 2015, there were 71,918 emergency department (ED) visits for all injuries and poisonings in Greater Sudbury and 29,613 ED visits for all injuries and poisonings in the Sudbury & District Health Unit (SDHU) district office areas, an average of 14,384 and 5,923 per year, respectively
- The rate of ED visits for all injuries and poisonings was 88.0 per 1,000 population per year in Greater Sudbury and 183.1 per 1,000 population per year in the SDHU district office areas between 2011 and 2015.
- The rate of ED visits for all injuries and poisonings in Greater Sudbury has been consistently lower than the rate in the SDHU district office areas.
- The rates of ED visits for all injuries and poisonings in Greater Sudbury and the SDHU district office areas have remained stable between 2006 to 2010 and 2011 to 2015.
Notes:
- Geographic areas and/or time periods in which there is less access to walk-in clinics and other alternatives to the local ED can be expected to have higher rates of injury-related ED visits than they would otherwise.
- Rates are age-standardized using the 2011 Canadian population.
- Data Source: Ambulatory Emergency External Cause 2006 to 2015 (extracted June 6, 2016) and Population Estimates 2006 to 2015 (extracted October 7, 2016), Ontario Ministry of Health and Long-Term Care, IntelliHEALTH Ontario.
Figure: Annual age-standardized rate of emergency department visits, all injuries and poisonings, by Greater Sudbury and outlying areas, 2006 to 2010 and 2011 to 2015.
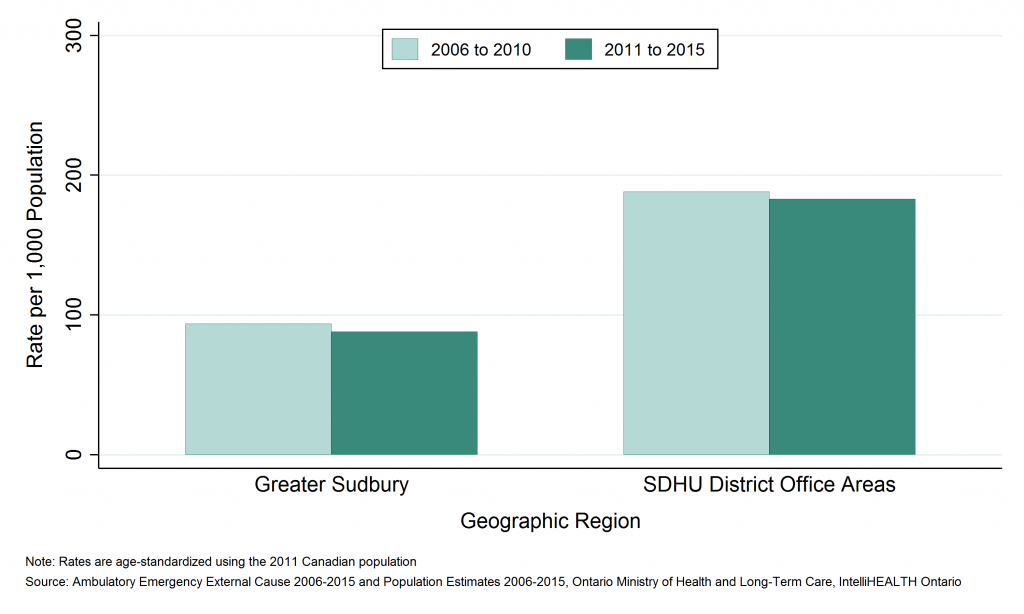
Table: Annual age-standardized rate of emergency department visits, all injuries and poisonings, by Greater Sudbury and outlying areas, 2006 to 2010 and 2011 to 2015.
| Geographic Region | Rate per 1000 2006 to 2010 | Rate per 1000 2011 to 2015 |
| Greater Sudbury | 93.8 | 88.0 |
| SDHU District Office Areas | 188.2 | 183.1 |
Figure: Annual number of emergency department visits, all injuries and poisonings, by Greater Sudbury and outlying areas, 2006 to 2010 and 2011 to 2015.
| Geographic Region | Total Counts, 2006 to 2010 | Total Counts, 2011 to 2015 | Average Annual Counts, 2006 to 2010 | Average Annual Counts, 2011 to 2015 |
| Greater Sudbury | 6,481 | 7,232 | 1,296.2 | 1,446.4 |
| SDHU District Office Areas | 2,147 | 2,411 | 429.4 | 482.2 |
Emergency department (ED) visits due to all injuries and poisonings by sex
Key findings:
- Between 2011 and 2015, there were 56,594 emergency department (ED) visits for all injuries and poisonings among males, and 44,931 for all injuries and poisonings among females in the Sudbury & District Health Unit (SDHU) area, an average of 11,319 and 8,986 per year, respectively.
- The rate of ED visits for all injuries and poisonings was 116.7 per 1,000 males and 89.7 per 1,000 females in the SDHU area between 2011 and 2015.
- The rate of ED visits for all injuries and poisonings among males has been consistently higher than the rate among females.
- In the SDHU area, the rates of ED visits for all injuries and poisonings have decreased slightly among males and remained stable among females over time between 2006 to 2010 and 2011 to 2015.
Notes:
- Geographic areas and/or time periods in which there is less access to walk-in clinics and other alternatives to the local ED can be expected to have higher rates of injury-related ED visits than they would otherwise.
- Rates are age-standardized using the 2011 Canadian population.
- Data Source: Ambulatory Emergency External Cause 2006 to 2015 (extracted June 6, 2016) and Population Estimates 2006 to 2015 (extracted October 7, 2016), Ontario Ministry of Health and Long-Term Care, IntelliHEALTH Ontario.
Figure: Annual age-standardized rate of emergency department visits, all injuries and poisonings, by sex, SDHU, 2006 to 2010 and 2011 to 2015.
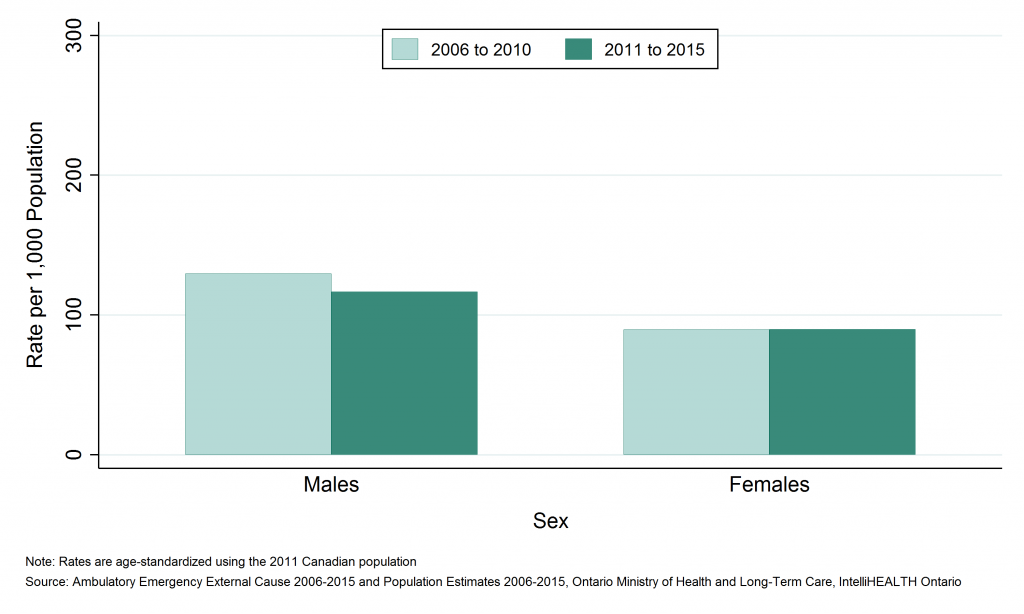
Table: Annual age-standardized rate of emergency department visits, all injuries and poisonings, by sex, SDHU, 2006 to 2010 and 2011 to 2015.
| Sex | Rate per 100,000, 2006 to 2010 | Rate per 100,000, 2011 to 2015 |
| Males | 129.6 | 116.7 |
| Females | 89.5 | 89.7 |
Table: Annual number of emergency department visits, all injuries and poisonings, by sex, SDHU, 2006 to 2010 and 2011 to 2015.
| Sex | Total Counts, 2006 to 2010 | Total Counts, 2011 to 2015 | Average Annual Counts, 2006 to 2010 | Average Annual Counts, 2011 to 2015 |
| Males | 64,064 | 56,594 | 12,812.8 | 11,318.8 |
| Females | 45,185 | 44,931 | 9,037.0 | 8,986.2 |
Emergency department (ED) visits due to all injuries and poisonings by age group
Key findings:
- Among residents of the Sudbury & District Health Unit (SDHU) area, the 25 to 44 age group visited the emergency department (ED) the most for injuries and poisonings, with 25,573 ED visits between 2011 and 2015, or 5,115 ED visits per year on average.
- Between 2011 and 2015, the 85 and over age group had the highest ED visits rate for injuries and poisonings with 175.8 ED visits per 1,000 population per year.
- Rates of ED visits for injuries and poisonings are high among youth and young adults. Rates then decrease with age until the 65 to 69 age group, after which they increase again.
- In the SDHU area, the ED visits rate for injuries and poisonings decreased slightly in all age groups below age 45 between 2006 to 2010 and 2011 to 2015. Rates for all other age groups have remained stable.
Notes:
- Geographic areas and/or time periods in which there is less access to walk-in clinics and other alternatives to the local ED can be expected to have higher rates of injury-related ED visits than they would otherwise.
- Data Source: Ambulatory Emergency External Cause 2006 to 2015 (extracted June 6, 2016) and Population Estimates 2006 to 2015 (extracted October 7, 2016), Ontario Ministry of Health and Long-Term Care, IntelliHEALTH Ontario.
Figure: Annual rate of emergency department visits, all injuries and poisonings, by age group, SDHU, 2006 to 2010 and 2011 to 2015.
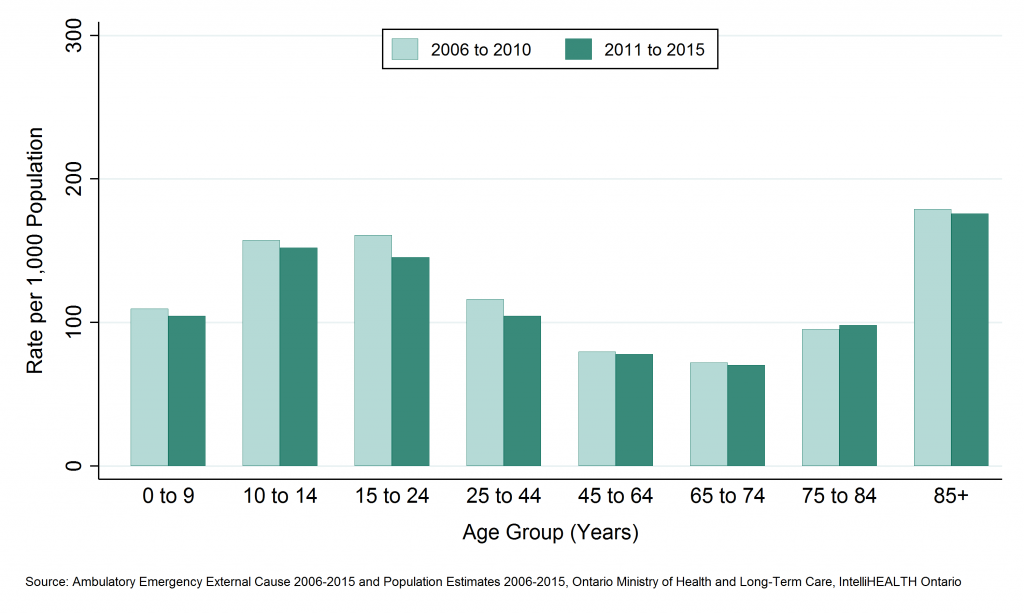
Table: Annual rate of emergency department visits, all injuries and poisonings, by age group, SDHU, 2006 to 2010 and 2011 to 2015.
| Age Group | Rate per 1000, 2006 to 2010 | Rate per 1000, 2011 to 2015 |
| 0 to 9 | 109.6 | 104.5 |
| 10 to 14 | 157.2 | 152.0 |
| 15 to 24 | 160.8 | 145.4 |
| 25 to 44 | 116.1 | 104.6 |
| 45 to 64 | 79.6 | 78.0 |
| 65 to 74 | 71.9 | 70.2 |
| 75 to 84 | 95.3 | 98.2 |
| 85+ | 178.8 | 175.8 |
Table: Annual number of emergency department visits, all injuries and poisonings, by age group, SDHU, 2006 to 2010 and 2011 to 2015.
| Age Group | Total Counts, 2006 to 2010 | Total Counts, 2011 to 2015 | Average Annual Counts, 2006 to 2010 | Average Annual Counts, 2011 to 2015 |
| 0 to 9 | 10,809 | 10,024 | 2,161.8 | 2,004.8 |
| 10 to 14 | 9,499 | 7,841 | 1,899.8 | 1,568.2 |
| 15 to 24 | 21,386 | 18,716 | 4,277.2 | 3,743.2 |
| 25 to 44 | 30,089 | 25,573 | 6,017.8 | 5,114.6 |
| 45 to 64 | 23,652 | 23,695 | 4,730.4 | 4,739.0 |
| 65 to 74 | 6,080 | 6,880 | 1,216.0 | 1,376.0 |
| 75 to 84 | 4,982 | 5,347 | 996.4 | 1,069.4 |
| 85+ | 2,752 | 3,455 | 550.4 | 691.0 |
Deaths due to all injuries and poisonings by geographic region
Key findings:
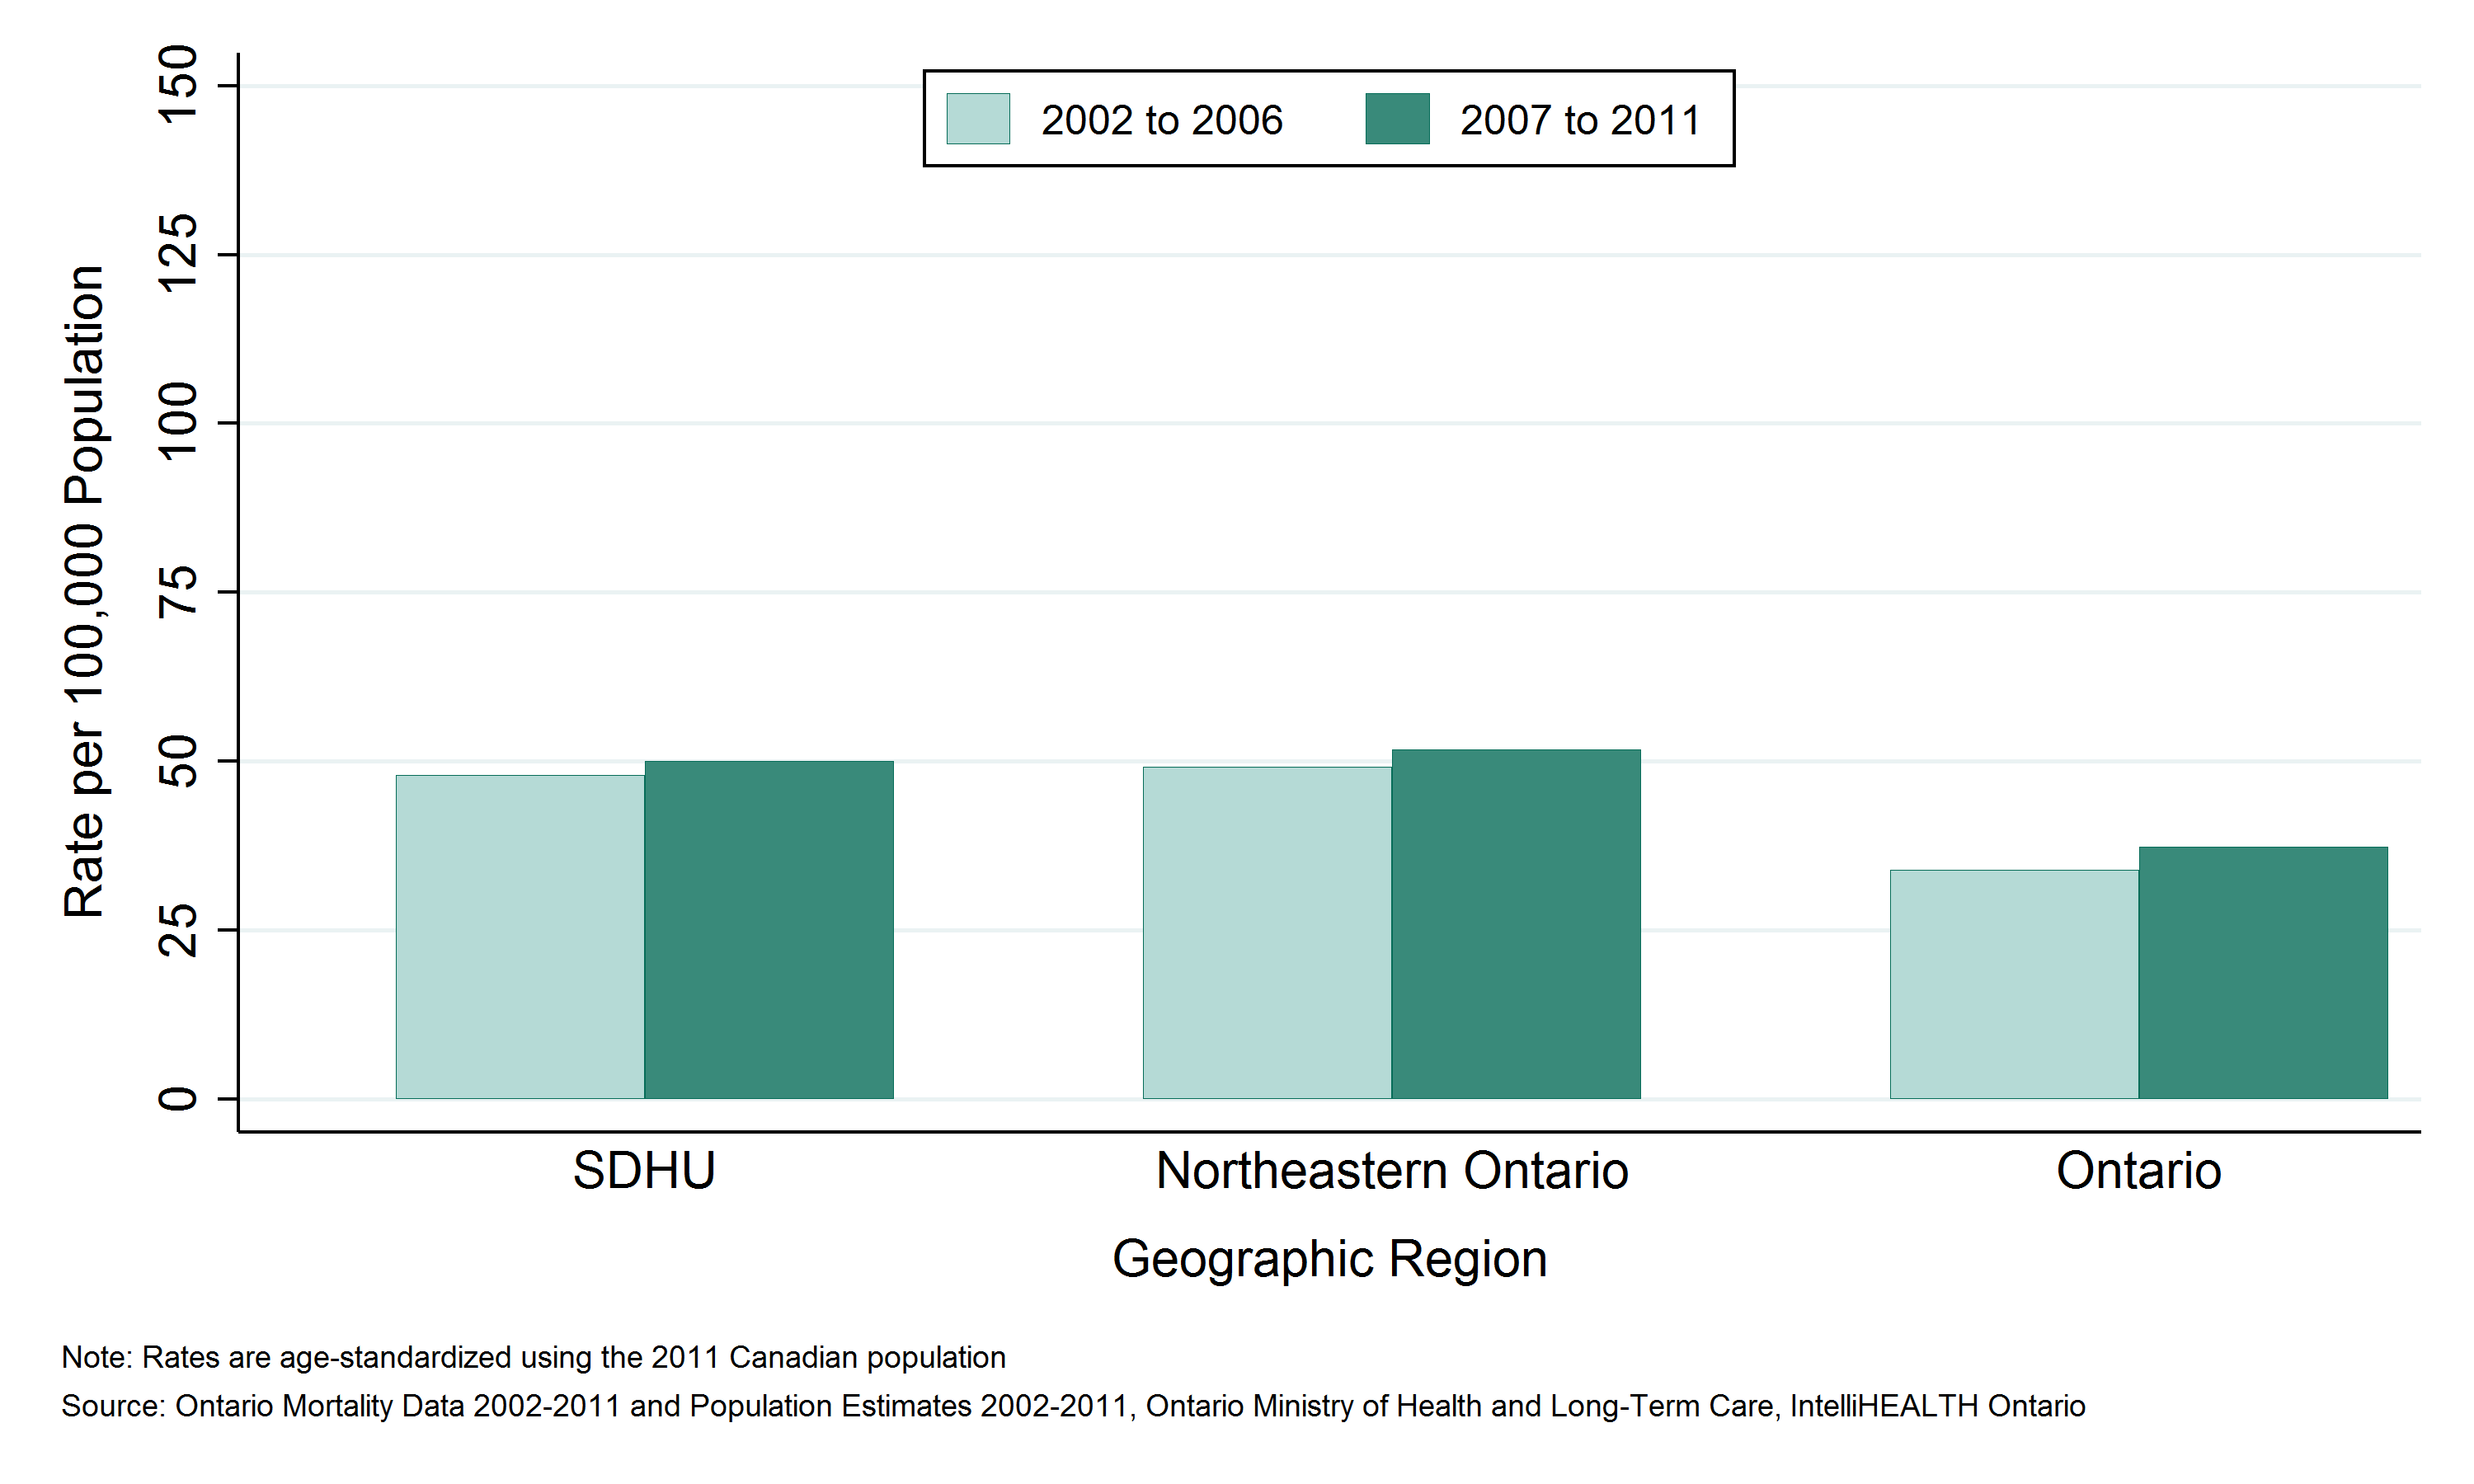
- Among residents of the Sudbury & District Health Unit (SDHU) area, there were 489 deaths due to injuries and poisonings between 2007 and 2011, an average of 98 per year.
- Between 2006 and 2015, the mortality rate for injuries and poisonings in the SDHU area was 50 deaths per 100,000 population per year.
- The mortality rate for injuries and poisonings in the SDHU area has been similar to the rate in northeastern Ontario. Rates in both regions have been slightly higher than the rate in Ontario overall.
- Between 2002 to 2006 and 2007 to 2011, the mortality rate for injuries and poisonings in the SDHU area remained stable.
Notes:
- Rates are age-standardized using the 2011 Canadian population.
- Data Source: Ontario Mortality Data 2002 to 2011 (extracted June 6, 2016) and Population Estimates 2006 to 2015 (extracted October 7, 2016), Ontario Ministry of Health and Long-Term Care, IntelliHEALTH Ontario.
Figure: Annual age-standardized mortality rate, all injuries and poisonings, by geographic region, 2002 to 2006 and 2007 to 2011
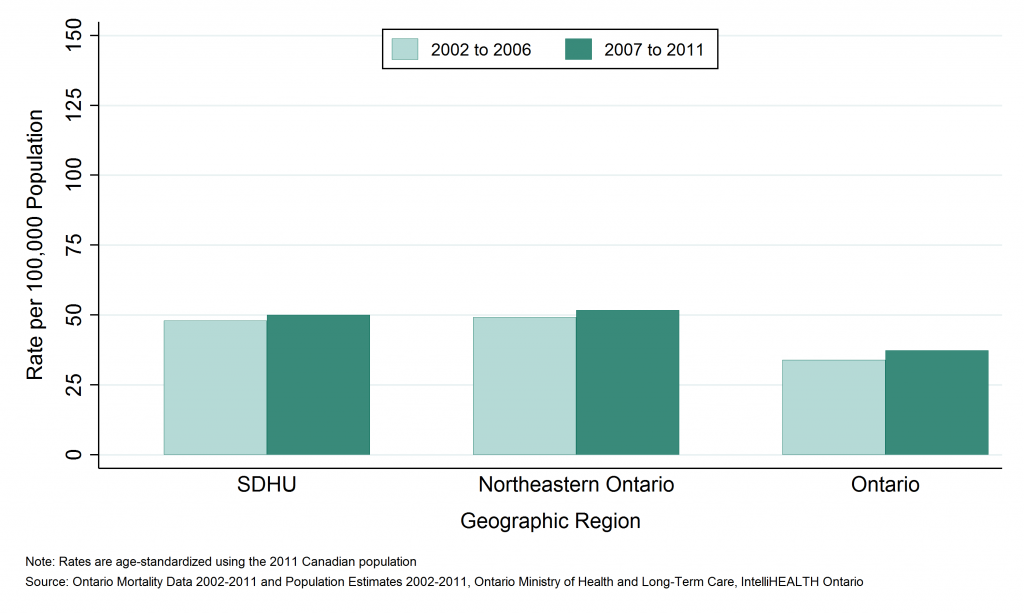
Table: Annual age-standardized mortality rate, all injuries and poisonings, by geographic region, 2002 to 2006 and 2007 to 2011
| Geographic Region | Rate per 100,000 2002 to 2006 | Rate per 100,000 2007 to 2011 |
| SDHU | 48.0 | 50.1 |
| Northeast | 49.2 | 51.7 |
| Ontario | 33.9 | 37.3 |
Table: Annual number of all deaths, all injuries and poisonings, by geographic region, 2002 to 2006 and 2007 to 2011
| Geographic Region | Total Counts 2002 to 2006 | Total Counts 2007 to 2011 | Average Annual Counts, 2002 to 2006 | Average Annual Counts, 2007 to 2011 |
| SDHU | 434 | 489 | 86.8 | 97.8 |
| Northeast | 1,316 | 1,482 | 263.2 | 296.4 |
| Ontario | 18,592 | 23,120 | 3,718.4 | 4,624.0 |
Potential years of life lost (PYLL) due to all injuries and poisonings by geographic region
Key findings:
- Between 2006 and 2015, residents of the Sudbury & District Health Unit (SDHU) area lost 9,233 years of potential life due to deaths from injuries and poisonings before the age of 75, an average of 1,847 per year.
- The rate of potential years of life lost (PYLL) in the SDHU area due to injuries and poisonings was 968 per 100,000 population per year.
- The rate of PYLL due to injuries and poisonings in the SDHU area has been similar to that of northeastern Ontario, while rates in both areas have been higher than the rate in Ontario overall.
- Between 2002 to 2006 and 2007 to 2011, the rate of PYLL due to injuries and poisonings remained stable.
Notes:
- Rates are age-standardized using the 2011 Canadian population.
- Data Source: Ontario Mortality Data 2002 to 2011 (extracted June 6, 2016) and Population Estimates 2006 to 2015 (extracted October 7, 2016), Ontario Ministry of Health and Long-Term Care, IntelliHEALTH Ontario.
Figure: Annual age-standardized rate of potential years of life lost (PYLL), all injuries and poisonings, by geographic region, 2002 to 2006 and 2007 to 2011
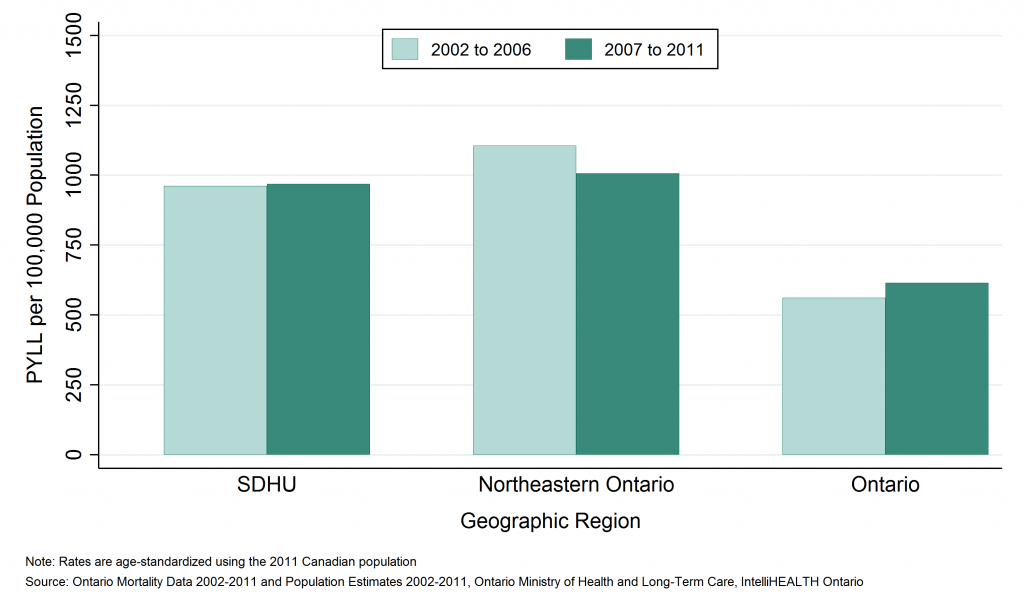
Table: Annual age-standardized rate of potential years of life lost (PYLL), all injuries and poisonings, by geographic region, 2002 to 2006 and 2007 to 2011
| Geographic Region | Rate per 100,000, 2002 to 2006 | Rate per 100,000, 2007 to 2011 |
| SDHU | 961.7 | 968.4 |
| Northeast | 1,105.1 | 1,006.1 |
| Ontario | 561.2 | 615.4 |
Table: Annual number of potential years of life lost (PYLL), all injuries and poisonings, by geographic region, 2002 to 2006 and 2007 to 2011
| Geographic Region | Total PYLL, 2002 to 2006 | Total PYLL, 2007 to 2011 | Average Annual Counts, 2002 to 2006 | Average Annual Counts, 2007 to 2011 |
| SDHU | 9,257 | 9,233 | 1,851.4 | 1,846.6 |
| Northeast | 30,213 | 26,755 | 6,042.6 | 5,351.0 |
| Ontario | 344,070 | 391,797 | 68,814.0 | 78,359.4 |
This item was last modified on August 8, 2017