Injuries and poisonings in children and youth (ages 0 to 18)
The injuries in this section include of all injuries and poisonings in children and youth except those resulting from complications of medical or surgical care, which are excluded.
Emergency department (ED) visits due to all injuries and poisonings in children and youth (ages 0 to 18) by geographic region
Key Findings:
- Among children and youth 0 to 18 years of age who reside in the Sudbury & District Health Unit (SDHU) area, there were 5,665 injury-related emergency department (ED) visits in 2015.
- In 2015, the ED visits rate due to injuries and poisonings in the SDHU area was 150 per 1,000 children and youth.
- The rate of ED visits due to injuries and poisonings in children and youth in the SDHU area has been consistently lower than that in northeastern Ontario, but slightly higher than that in Ontario overall in most years.
- Between 2006 and 2015, the injury-related ED visit rate in children and youth in the SDHU area remained stable over time.
Notes:
- Geographic areas and/or time periods in which there is less access to walk-in clinics and other alternatives to the local ED can be expected to have higher rates of injury-related ED visits than they would otherwise.
- Data Source: Ambulatory Emergency External Cause 2006 to 2015 (extracted June 6, 2016) and Population Estimates 2006 to 2015 (extracted October 7, 2016), Ontario Ministry of Health and Long-Term Care, IntelliHEALTH Ontario.
Figure: Annual rate of emergency department visits, all injuries and poisonings, ages 0 to 18, by geographic region, 2006 to 2015
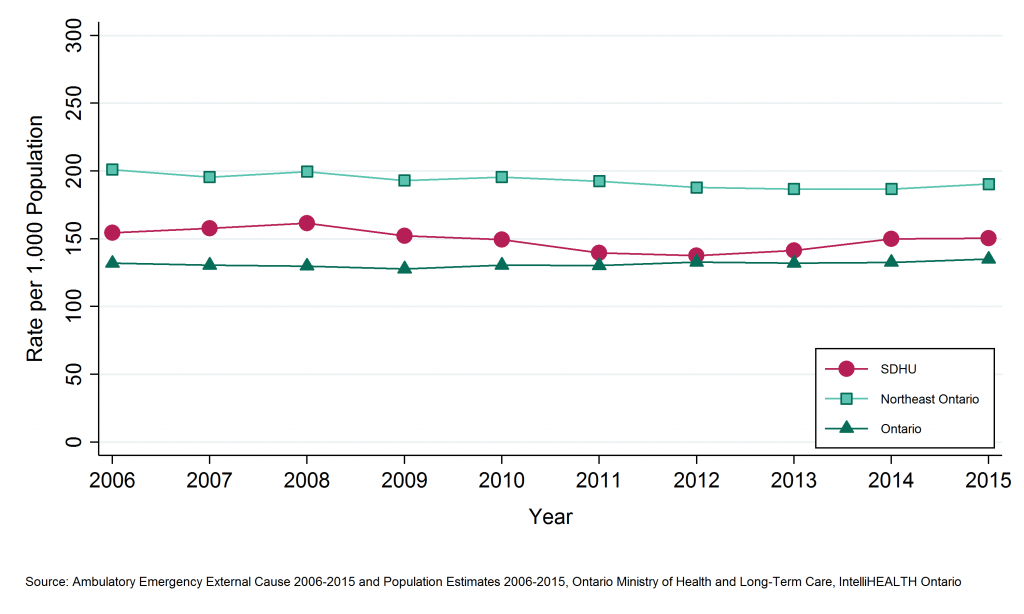
Table: Annual rate of emergency department visits, all injuries and poisonings, ages 0 to 18, by geographic region, 2006 to 2015
| Geographic Region | 2006 | 2007 | 2008 | 2009 | 2010 | 2011 | 2012 | 2013 | 2014 | 2015 |
| SDHU | 154.4 | 157.7 | 161.6 | 152.3 | 149.4 | 139.7 | 137.6 | 141.4 | 150.0 | 150.4 |
| Northeast | 201.1 | 195.5 | 199.6 | 193.1 | 195.6 | 192.6 | 187.9 | 186.8 | 186.7 | 190.4 |
| Ontario | 131.9 | 130.5 | 129.9 | 127.7 | 130.6 | 130.3 | 132.8 | 132.0 | 132.7 | 135.0 |
Table: Annual number of emergency department visits, all injuries and poisonings, ages 0 to 18, by geographic region, 2006 to 2015
| Geographic Region | 2006 | 2007 | 2008 | 2009 | 2010 | 2011 | 2012 | 2013 | 2014 | 2015 |
| SDHU | 6,763 | 6,823 | 6,910 | 6,421 | 6,193 | 5,696 | 5,508 | 5,553 | 5,769 | 5,665 |
| Northeast | 25,059 | 23,932 | 24,031 | 22,798 | 22,731 | 22,089 | 21,154 | 20,646 | 20,261 | 20,329 |
| Ontario | 389,722 | 384,362 | 381,829 | 374,080 | 381,610 | 379,855 | 385,252 | 380,508 | 379,750 | 384,615 |
Leading causes of injury in children and youth (ages 0 to 18) by geographic region
Key Findings:
- Between 2011 and 2015, the two most common causes of injury-related emergency department (ED) visit among children and youth residing in the Sudbury & District Health Unit (SDHU) area was falls, representing 29% of all injuries and poisonings treated in emergency departments, and being struck by or against an object, representing 22%.
- On average 1,608 children and youth in the SDHU area were treated in emergency departments for a fall each year, while 1,226 children and youth on average were treated due to being struck by or against an object.
- The percentage of visits that were due to falls and being struck by or against an object in the SDHU area is slightly lower than that in Ontario.
Notes:
- Data Source: Ambulatory Emergency External Cause 2006 to 2015 (extracted June 6, 2016), Ontario Ministry of Health and Long-Term Care, IntelliHEALTH Ontario.
Figure: Leading causes of injury-related emergency department visits (%), ages 0 to 18, by geographic region, 2011 to 2015
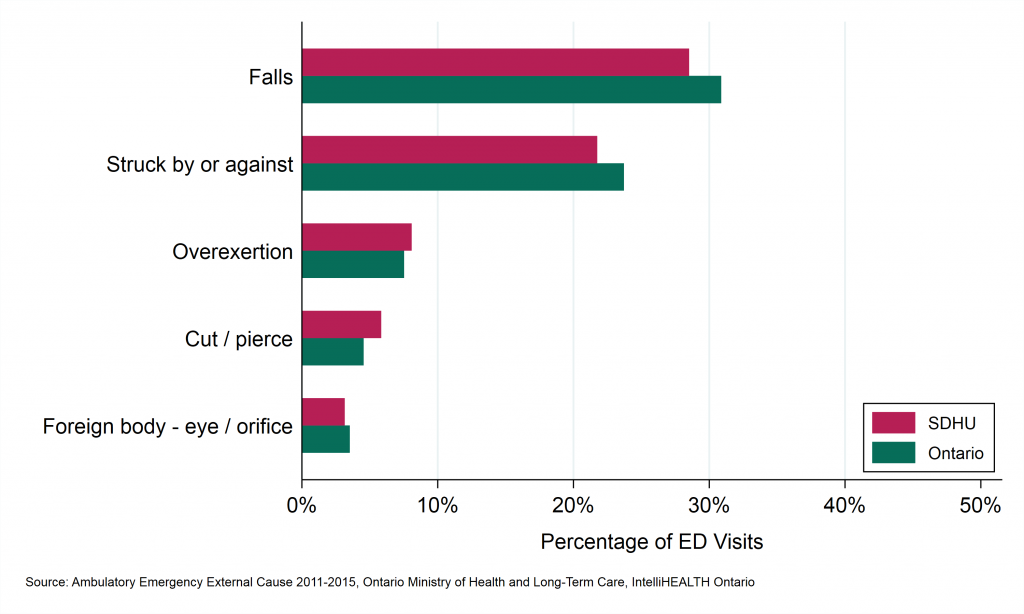
Table: Percent of leading causes of injury-related emergency department visits (%), ages 0 to 18, by geographic region, 2011 to 2015
| Rank | Leading Cause | SDHU | Ontario |
| 1 | Falls | 28.5 | 30.9 |
| 2 | Struck by or against | 21.7 | 23.7 |
| 3 | Overexertion | 8.1 | 7.5 |
| 4 | Cut / pierce | 5.8 | 4.5 |
| 5 | Foreign body - eye / orifice | 3.2 | 3.5 |
Table: Number of leading causes of injury-related emergency department visits (%), ages 0 to 18, by geographic region, 2006 to 2015
| Rank | Leading Cause | Total Count, SDHU | Total Counts, Ontario | Average Annual Count, SDHU | Average Annual Count, Ontario |
| 1 | Falls | 8,039 | 589,814 | 1,608 | 117,963 |
| 2 | Struck by or against | 6,130 | 452,988 | 1,226 | 90,598 |
| 3 | Overexertion | 2,279 | 143,762 | 456 | 28,752 |
| 4 | Cut / pierce | 1,645 | 86,760 | 329 | 17,352 |
| 5 | Foreign body - eye / orifice | 889 | 67,285 | 178 | 13,457 |
Emergency department (ED) visits due to all injuries and poisonings in children and youth (ages 0 to 18) by Greater Sudbury and outlying areas
Key Findings:
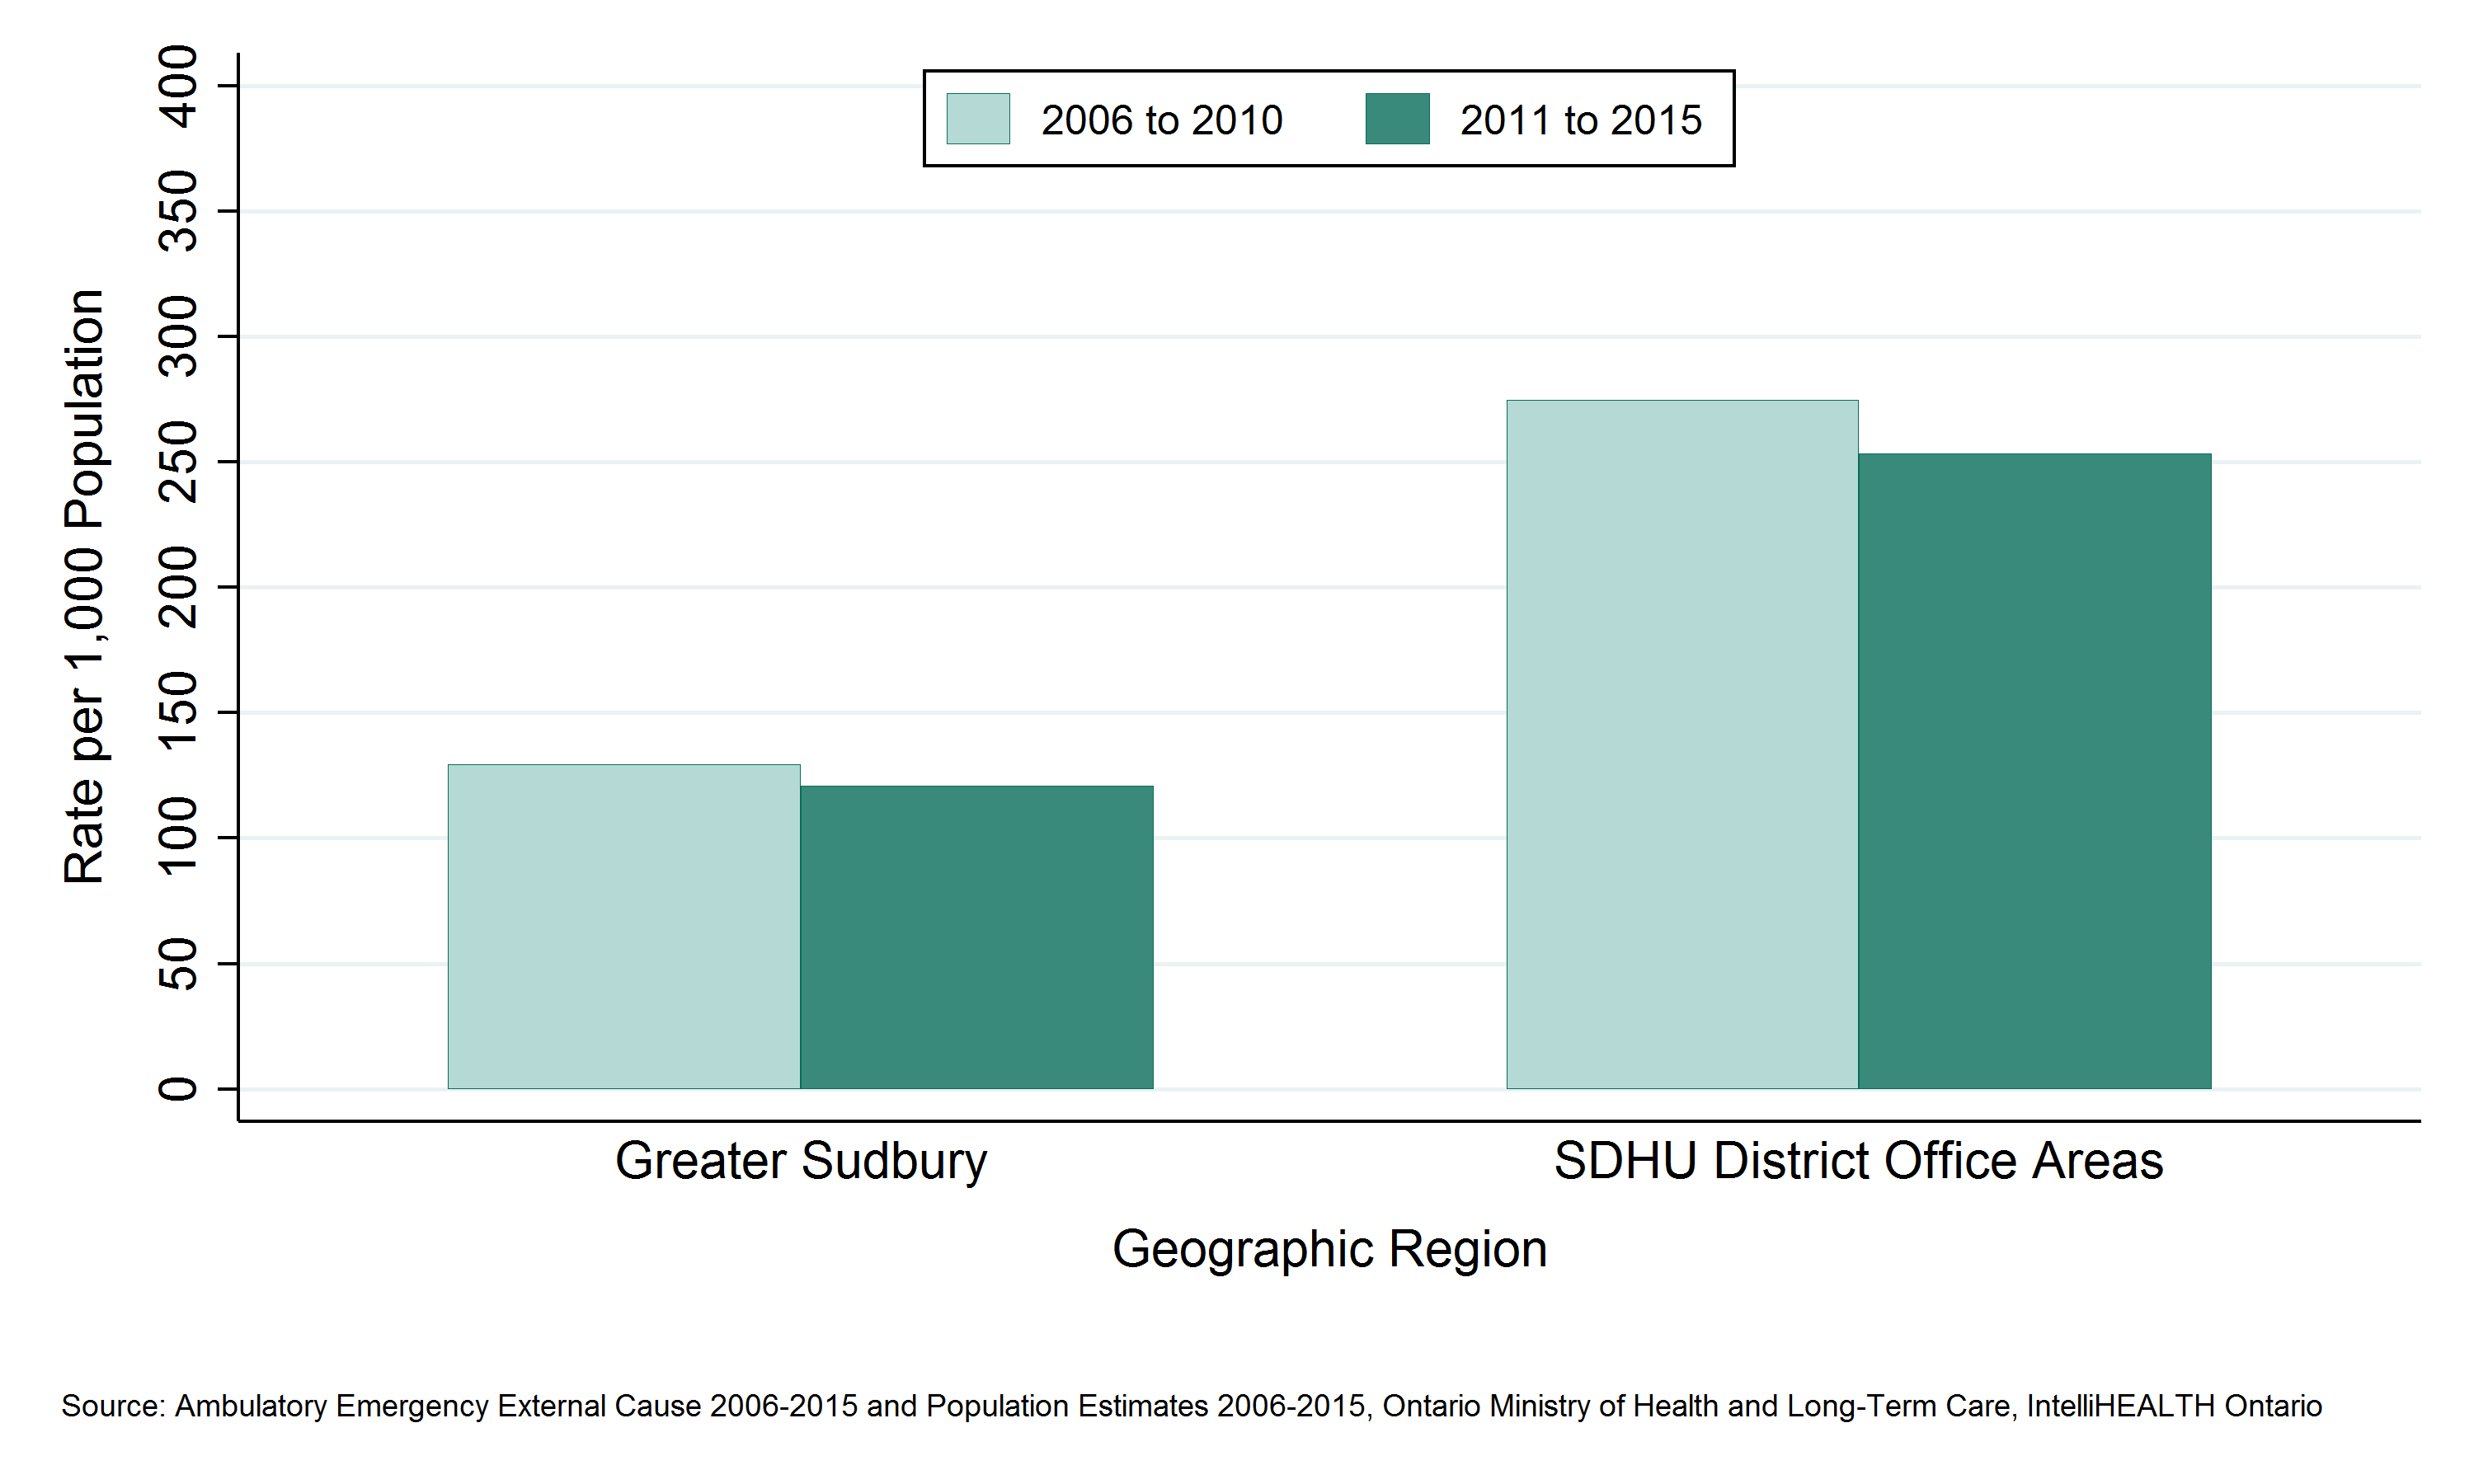
- Between 2011 and 2015, there were 19,610 emergency department (ED) visits among children and youth residing in Greater Sudbury and 8,581 among children and youth residing in the SDHU district office areas, an average of 3,922 and 1,716 per year, respectively.
- The rate of ED visits among children and youth was 121 per 1,000 population per year in Greater Sudbury and 253 per 1,000 population per year in the SDHU district office areas between 2011 and 2015.
- The rate of ED visits among children residing in Greater Sudbury has been consistently lower than among children residing in the SDHU district office areas.
- The rate of ED visits among children residing in both areas decreased slightly between 2006 to 2010 and 2011 to 2015.
Notes:
- Geographic areas and/or time periods in which there is less access to walk-in clinics and other alternatives to the local ED can be expected to have higher rates of injury-related ED visits than they would otherwise.
- Data Source: Ambulatory Emergency External Cause 2006 to 2015 (extracted June 6, 2016) and Population Estimates 2006 to 2015 (extracted October 7, 2016), Ontario Ministry of Health and Long-Term Care, IntelliHEALTH Ontario.
Figure: Annual rate of emergency department visits, all injuries and poisonings, ages 0 to 18, by Greater Sudbury and outlying areas, 2006 to 2010 and 2011 to 2015

Table: Annual rate of emergency department visits, all injuries and poisonings, ages 0 to 18, by Greater Sudbury and outlying areas, 2006 to 2010 and 2011 to 2015
| Geographic Region | Rate per 1000 2006 to 2010 | Rate per 1000 2011 to 2015 |
| Greater Sudbury | 129.4 | 120.8 |
| SDHU District Office Areas | 274.5 | 253.4 |
Table: Annual number of emergency department visits, all injuries and poisonings, ages 0 to 18, by Greater Sudbury and outlying areas, 2006 to 2010 and 2011 to 2015
| Geographic Region | Total Counts, 2006 to 2010 | Total Counts, 2011 to 2015 | Average Annual Counts, 2006 to 2010 | Average Annual Counts, 2011 to 2015 |
| Greater Sudbury | 22,726 | 19,610 | 4,545.2 | 3,922.0 |
| SDHU District Office Areas | 10,384 | 8,581 | 2,076.8 | 1,716.2 |
Emergency department (ED) visits due to all injuries and poisonings in children and youth (ages 0 to 18) by sex
Key Findings:
- Between 2011 and 2015, there were 16,002 emergency department (ED) visits among male children and youth, and 12,189 among female children and youth in the Sudbury & District Health Unit (SDHU) area, an average of 3,200 and 2,438 per year, respectively.
- The rate of ED visits among children and youth was 159 per 1,000 males and 128 per 1,000 females in the SDHU area between 2011 and 2015.
- The ED visits rate among male children and youth has been consistently higher than the rate among female children and youth.
- In the SDHU area, the rate of ED visits decreased among male children and youth over time between 2006 to 2010 and 2011 to 2015, while the rate among female children and youth remained stable over the same time period.
Notes:
- Geographic areas and/or time periods in which there is less access to walk-in clinics and other alternatives to the local ED can be expected to have higher rates of injury-related ED visits than they would otherwise.
- Data Source: Ambulatory Emergency External Cause 2006 to 2015 (extracted June 6, 2016) and Population Estimates 2006 to 2015 (extracted October 7, 2016), Ontario Ministry of Health and Long-Term Care, IntelliHEALTH Ontario.
Figure: Annual rate of emergency department visits, ages 0 to 18, all injuries and poisonings, by sex, SDHU, 2006 to 2010 and 2011 to 2015
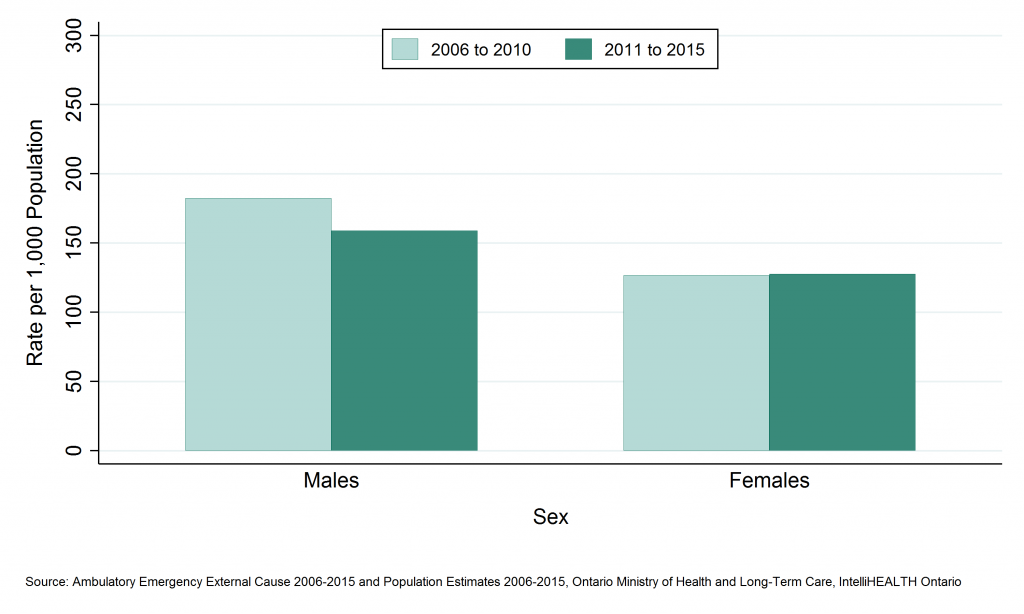
Table: Annual rate of emergency department visits, ages 0 to 18, all injuries and poisonings, by sex, SDHU, 2006 to 2010 and 2011 to 2015
| Sex | Rate per 100,000, 2006 to 2010 | Rate per 100,000, 2011 to 2015 |
| Males | 182.3 | 159.0 |
| Females | 126.7 | 127.6 |
Table: Annual number of emergency department visits, ages 0 to 18, all injuries and poisonings, by sex, SDHU, 2006 to 2010 and 2011 to 2015
| Sex | Total Counts, 2006 to 2010 | Total Counts, 2011 to 2015 | Average Annual Counts, 2006 to 2010 | Average Annual Counts, 2011 to 2015 |
| Males | 19,881 | 16,002 | 3,976.2 | 3,200.4 |
| Females | 13,229 | 12,189 | 2,645.8 | 2,437.8 |
Emergency department (ED) visits due to all injuries and poisonings in children and youth (ages 0 to 18) by age group
Key Findings:
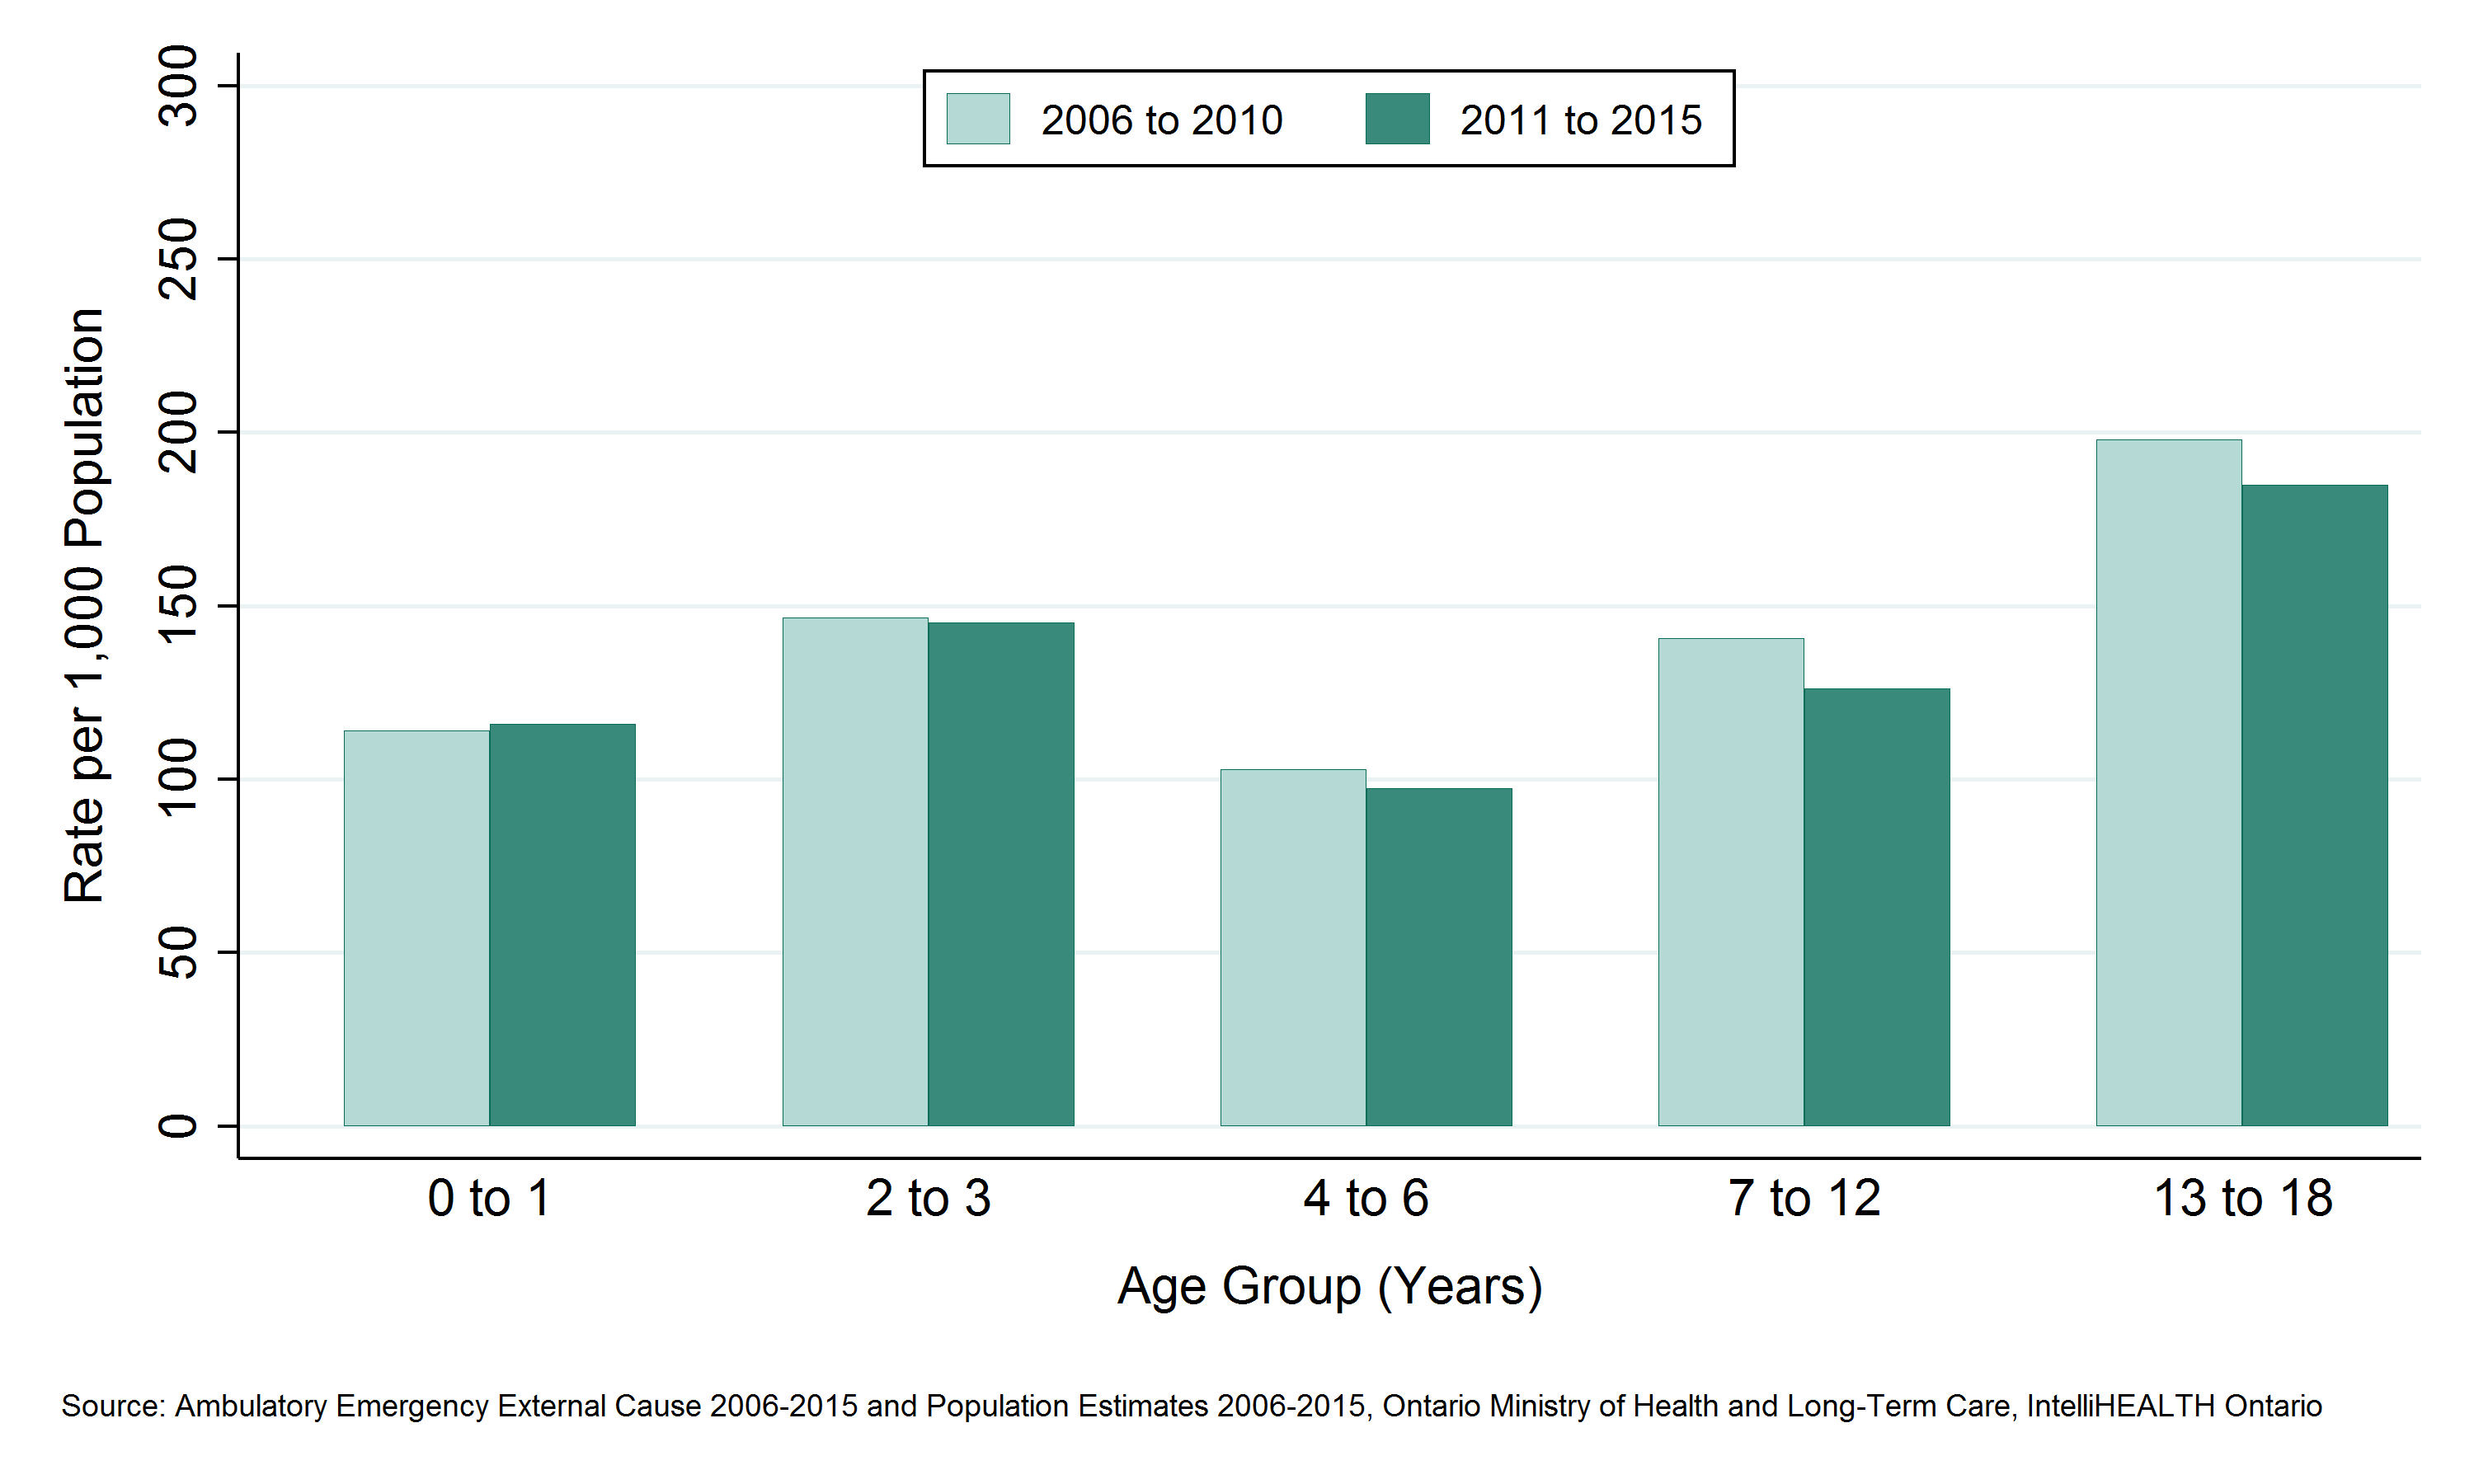
- Among Sudbury & District Health Unit (SDHU) area children and youth, the 13 to 18 age group visited the emergency department (ED) the most due to injuries and poisonings, with 12,976 ED visits between 2011 and 2015, or 2,595 ED visits per year on average.
- Between 2011 and 2015, the 13 to 18 age group had the highest ED visits rate among children and youth with 185 ED visits per 1,000 population per year.
- Rates of ED visits among children were relatively similar across all age groups except for an increase in the 13 to 18 age group.
- In the SDHU area, the ED visits rate among children and youth decreased slightly over time in the 7 to 12 and 13 to 18 age groups between 2006 to 2010 and 2011 to 2015, but have remained relatively stable for all other age groups.
Notes:
- Geographic areas and/or time periods in which there is less access to walk-in clinics and other alternatives to the local ED can be expected to have higher rates of injury-related ED visits than they would otherwise.
- Data Source: Ambulatory Emergency External Cause 2006 to 2015 (extracted June 6, 2016) and Population Estimates 2006 to 2015 (extracted October 7, 2016), Ontario Ministry of Health and Long-Term Care, IntelliHEALTH Ontario.
Figure: Annual rate of emergency department visits, all injuries and poisonings, ages 0 to 18, by age group, SDHU, 2006 to 2010 and 2011 to 2015

Table: Annual rate of emergency department visits, all injuries and poisonings, ages 0 to 18, by age group, SDHU, 2006 to 2010 and 2011 to 2015
| Age Group | Rate per 1000, 2006 to 2010 | Rate per 1000, 2011 to 2015 |
| 0 to 1 | 114.1 | 115.8 |
| 2 to 3 | 146.6 | 145.3 |
| 4 to 6 | 102.7 | 97.4 |
| 7 to 12 | 140.6 | 126.1 |
| 13 to 18 | 198.0 | 184.8 |
Table: Annual number of emergency department visits, all injuries and poisonings, ages 0 to 18, by age group, SDHU, 2006 to 2010 and 2011 to 2015
| Sex | Total Counts, 2006 to 2010 | Total Counts, 2011 to 2015 | Average Annual Counts, 2006 to 2010 | Average Annual Counts, 2011 to 2015 |
| Males | 19,881 | 16,002 | 3,976.2 | 3,200.4 |
| Females | 13,229 | 12,189 | 2,645.8 | 2,437.8 |
Deaths due to all injuries and poisonings in children and youth (ages 0 to 18) by geographic region
Key Findings:
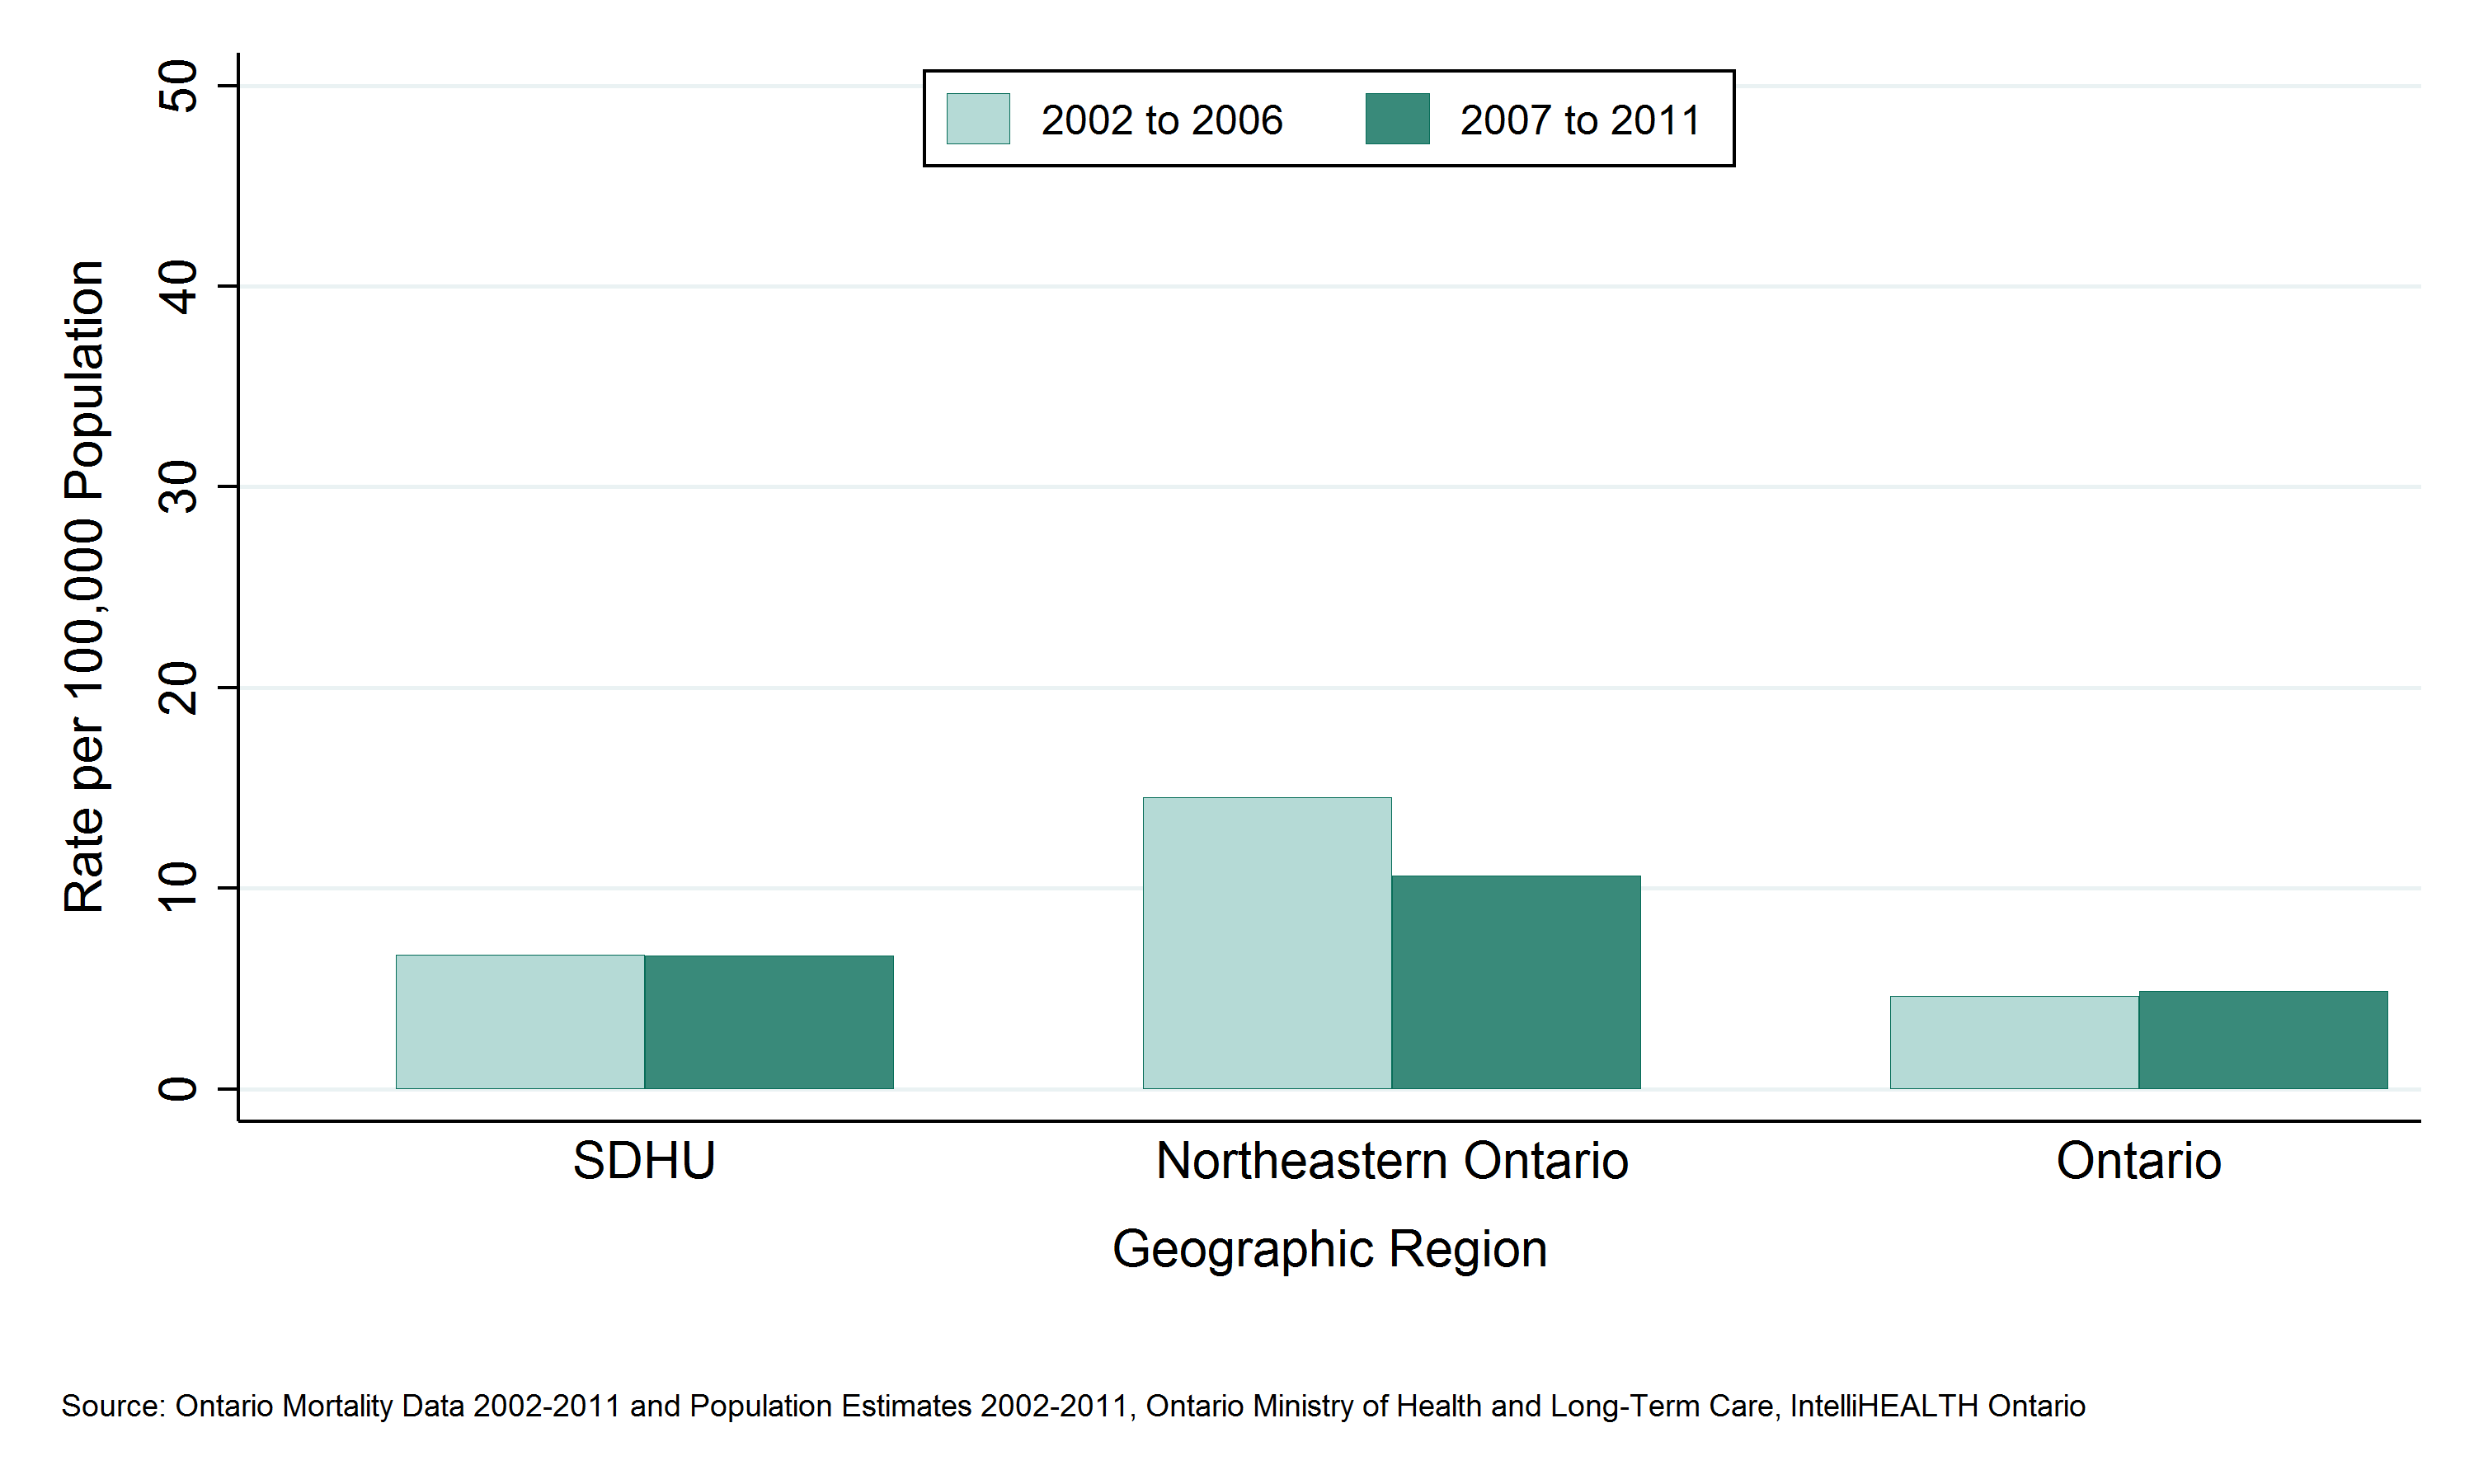
- There were 14 injury-related deaths among Sudbury & District Health Unit (SDHU) area children and youth between 2007 and 2011, and average of 2.8 per year.
- Between 2006 and 2015, the mortality rate among children and youth residing in the SDHU area was 7 deaths per 100,000 children and youth per year.
- The mortality rate for children and youth in the SDHU area has been lower than that of northeastern Ontario, but consistent with that in Ontario overall.
- Between 2002 and 2011, there was no consistent trend in the mortality rate for children and youth in the SDHU area.
Notes:
- Data Source: Ontario Mortality Data 2002 to 2011 (extracted June 6, 2016) and Population Estimates 2002 to 2011 (extracted October 7, 2016), Ontario Ministry of Health and Long-Term Care, IntelliHEALTH Ontario.
Figure: Annual mortality rate, all injuries and poisonings, ages 0 to 18, by geographic region, 2002 to 2006 and 2007 to 2011

Table: Annual mortality rate, all injuries and poisonings, ages 0 to 18, by geographic region, 2002 to 2006 and 2007 to 2011
| Geographic Region | Rate per 100,000 2002 to 2006 | Rate per 100,000 2007 to 2011 |
| SDHU | 6.7 | 6.7 |
| Northeast | 14.5 | 10.6 |
| Ontario | 4.6 | 4.9 |
Table: Annual number of deaths, all injuries and poisonings, ages 0 to 18, by geographic region, 2002 to 2006 and 2007 to 2011
| Geographic Region | Total Counts 2002 to 2006 | Total Counts 2007 to 2011 | Average Annual Counts, 2002 to 2006 | Average Annual Counts, 2007 to 2011 |
| SDHU | 15 | 14 | 3.0 | 2.8 |
| Northeast | 94 | 63 | 18.8 | 12.6 |
| Ontario | 686 | 715 | 137.2 | 143.0 |
Potential years of life lost (PYLL) due to all injuries and poisonings among children and youth (ages 0 to 18) by geographic region
Key Findings:
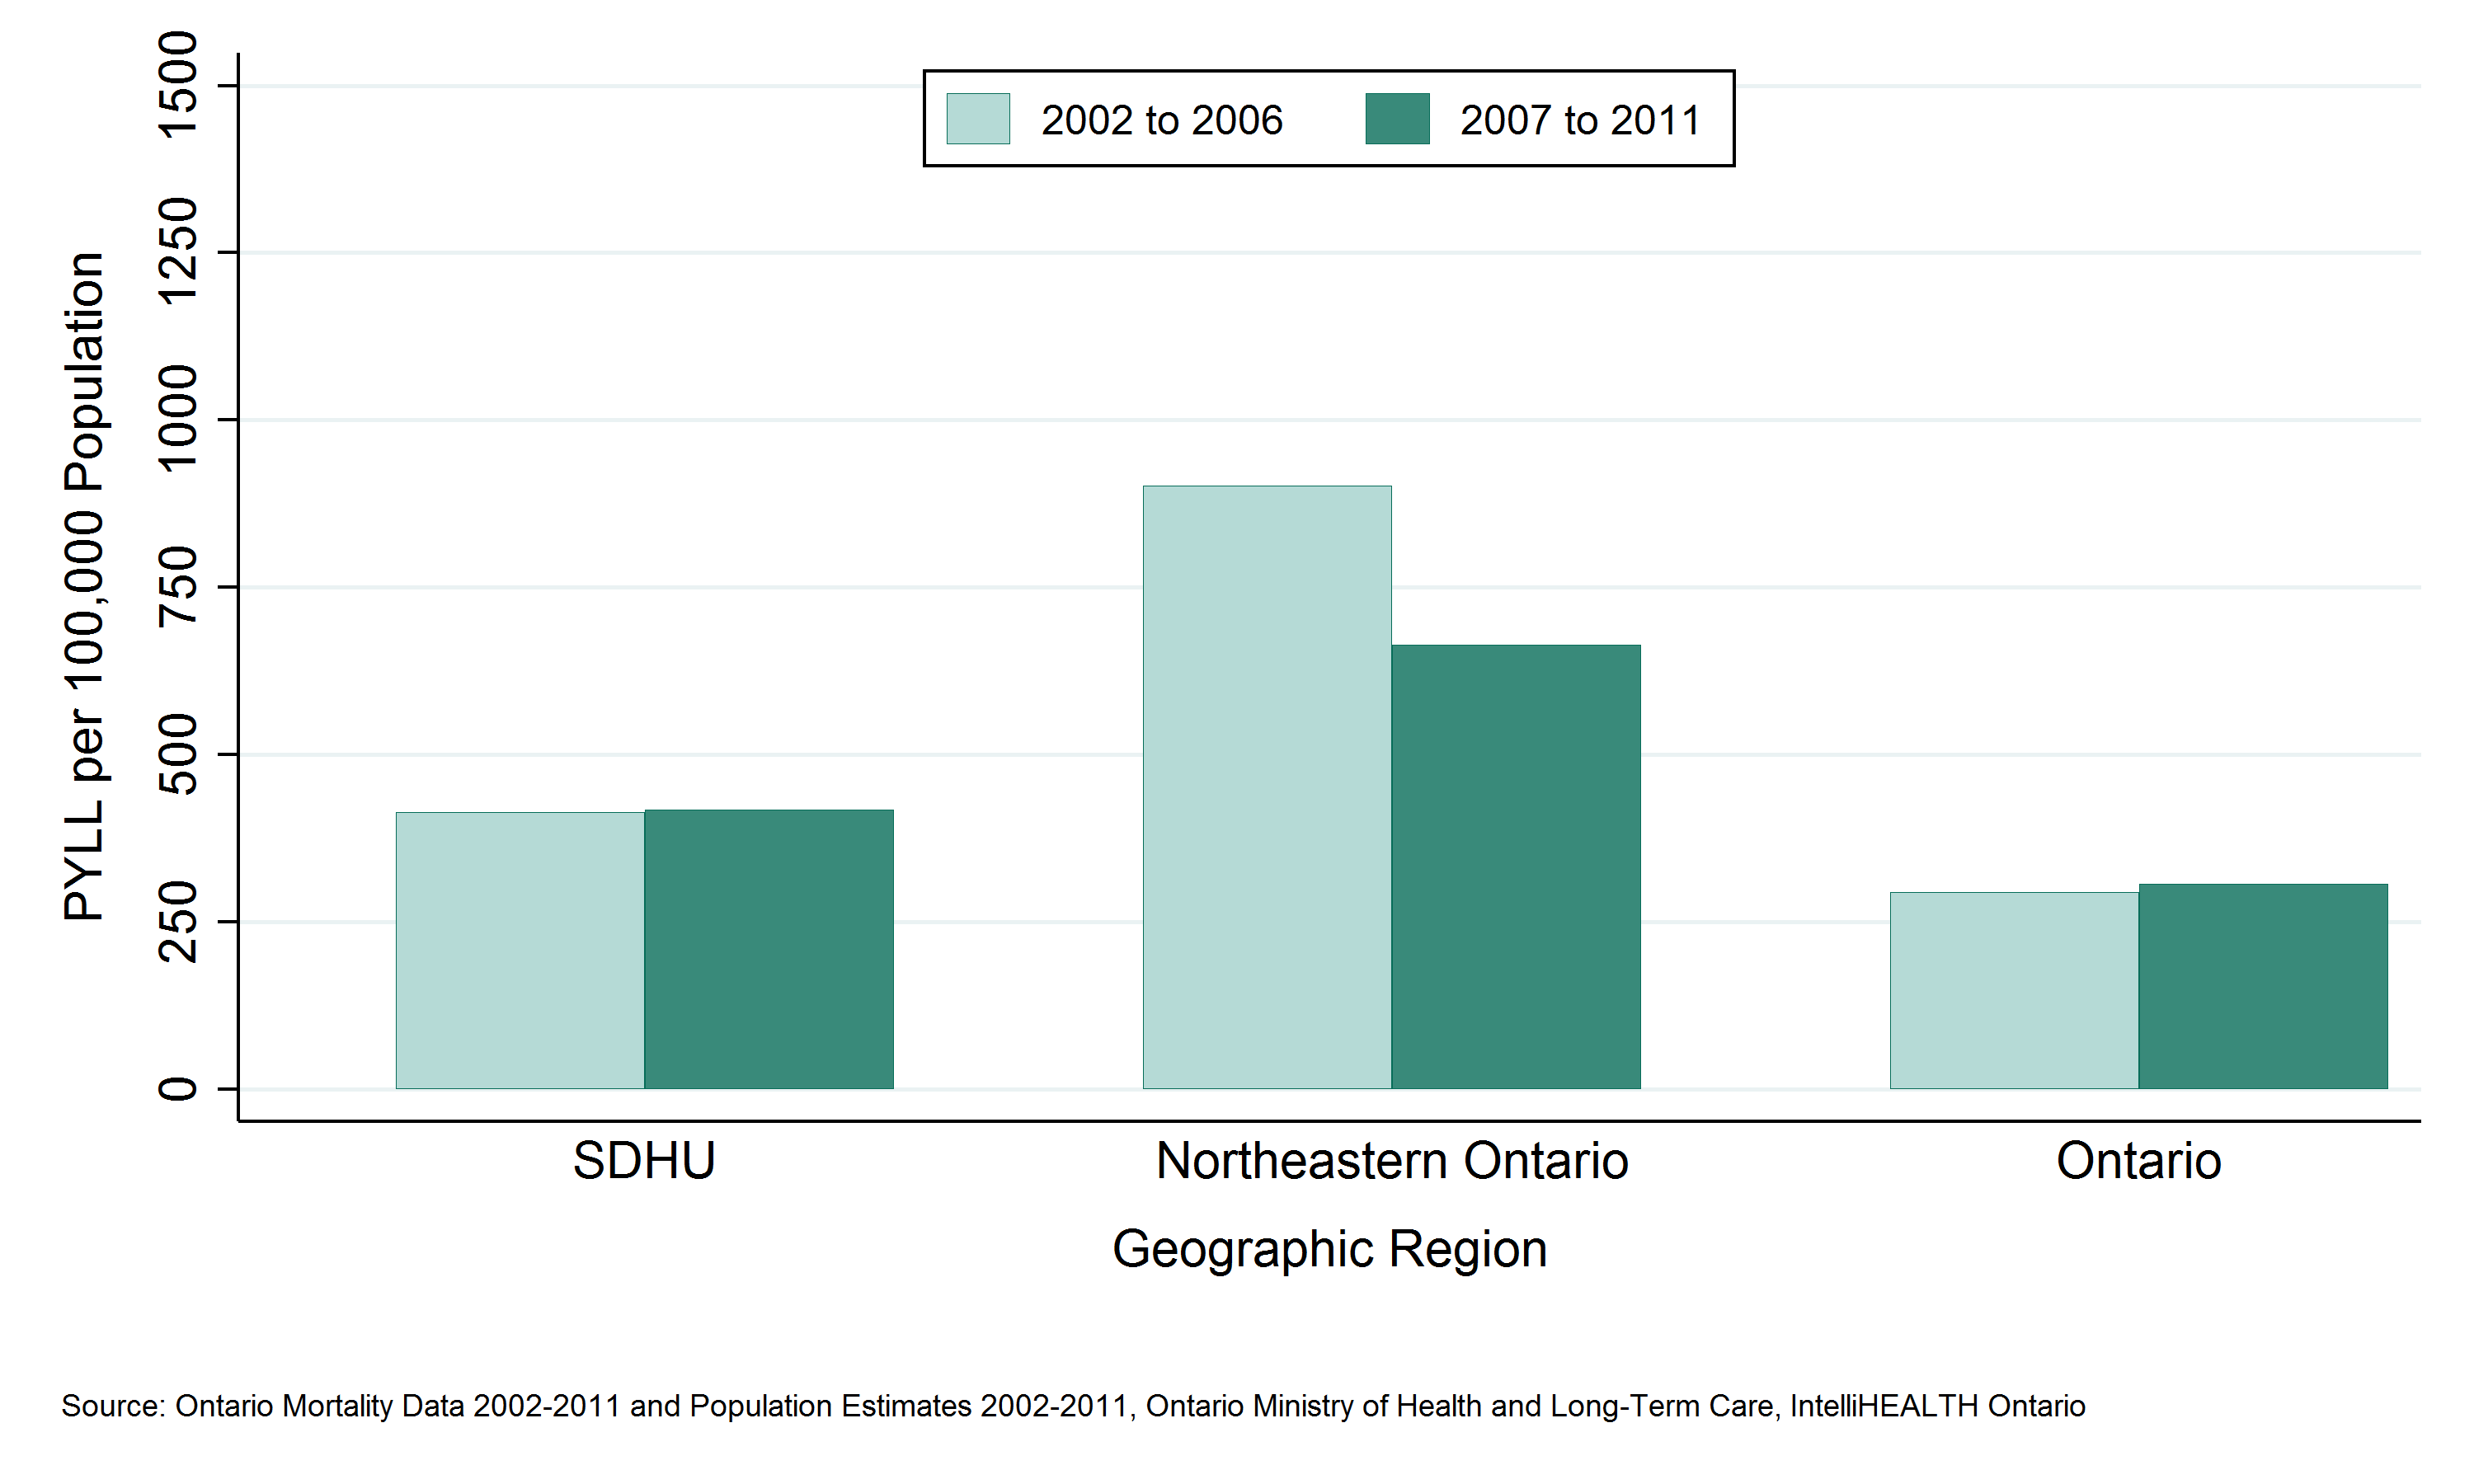
- Between 2006 and 2015, children and youth residing in the Sudbury & District Health Unit (SDHU) area lost 879 years of potential life due to deaths from injuries and poisonings falls before the age of 75, an average of 176 per year.
- The rate of potential years of life lost (PYLL) in the SDHU area due to injuries and poisonings among children and youth was 418 per 100,000 population per year.
- The rate of PYLL due to injuries and poisonings among children and youth in the SDHU area has been higher than the rate in northeastern Ontario, but higher than the rate in Ontario overall.
- Between 2002 to 2006 and 2007 to 2011, the rate of PYLL due to injuries and poisonings among children and youth in the SDHU area remained stable.
Notes:
- Data Source: Ontario Mortality Data 2002 to 2011 (extracted June 6, 2016) and Population Estimates 2002 to 2011 (extracted October 7, 2016), Ontario Ministry of Health and Long-Term Care, IntelliHEALTH Ontario.
Figure: Annual rate of potential years of life lost (PYLL), all injuries and poisonings, ages 0 to 18, by geographic region, 2002 to 2006 and 2007 to 2011
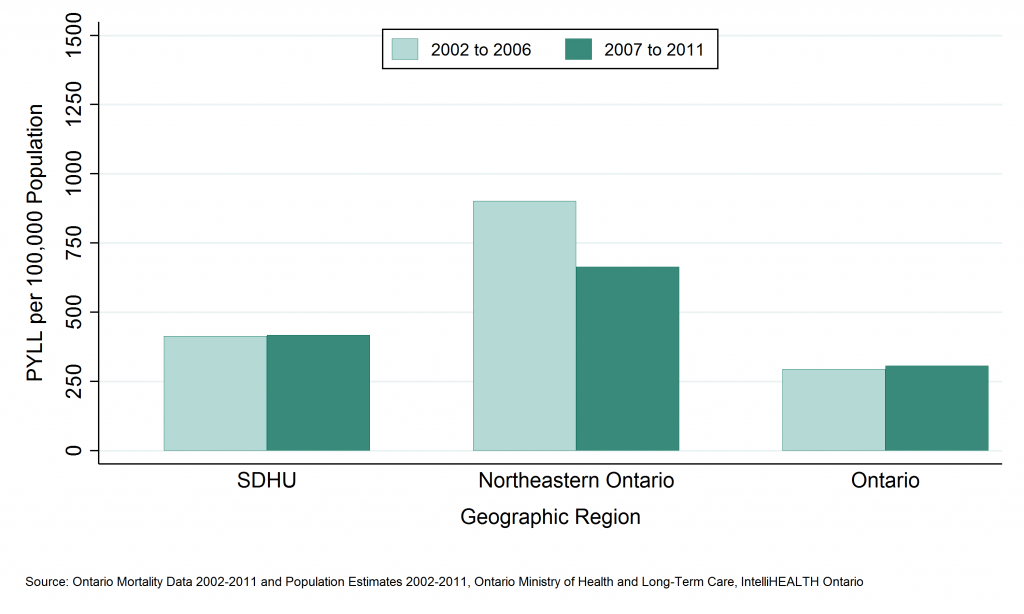
Table: Annual rate of potential years of life lost (PYLL), all injuries and poisonings, ages 0 to 18, by geographic region, 2002 to 2006 and 2007 to 2011
| Geographic Region | Rate per 100,000, 2002 to 2006 | Rate per 100,000, 2007 to 2011 |
| SDHU | 413.7 | 417.7 |
| Northeast | 901.8 | 663.5 |
| Ontario | 293.8 | 306.2 |
Table: Annual number of potential years of life lost (PYLL), all injuries and poisonings, ages 0 to 18, by geographic region, 2002 to 2006 and 2007 to 2011
| Geographic Region | Total PYLL, 2002 to 2006 | Total PYLL, 2007 to 2011 | Average Annual Counts, 2002 to 2006 | Average Annual Counts, 2007 to 2011 |
| SDHU | 926 | 879 | 185.2 | 175.8 |
| Northeast | 5,828 | 3,927 | 1,165.6 | 785.4 |
| Ontario | 43,475 | 44,865 | 8,695.0 | 8,973.0 |
This item was last modified on August 8, 2017