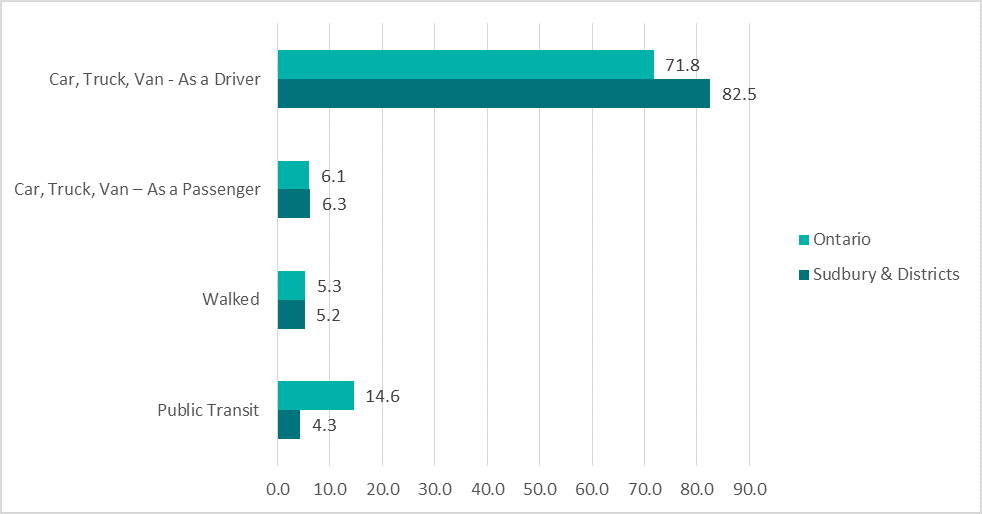
Figure 10.1 Mode of transportation to work, by geographic area, aged 15+, 2016

Bar graph depicting Figure 10.1: Mode of transportation to work, by geographic area, aged 15+, 2016. Data found in tables below.

Dernière modification : 19 novembre 2018