Medkit
Icon in the shape of a medkit
Clipboard
Icon in the shape of a medkit
Chat
Icon in the shape of two speach bubbles
Bar chart
Icon in the shape of a bar chart
Icon in the shape of three stacked lines
Description
Cancel
Icon in the shape of a cancel button
Warning
Icon in the shape of a warning sign
Facebook
Icon in the shape of the facebook logo
Print
Icon in the shape of the Twitter logo
YouTube
Iocn in the shape of the YouTube logo
Print
Icon in the shape of a printer
Skip to main content
Resources
News & Alerts
Research & Statistics
FAQs
Clinics, Classes & Events
Features & Services
Health Topics & Programs
Professionals
About
Join Us
Contact
Resources
News & Alerts
Research & Statistics
FAQs
Français
Search the website
Search
Clinics, Classes & Events
Features & Services
Health Topics & Programs
Professionals
About
Join Us
Contact
Home
» »
Health Topics & Programs
»
Substances & Substance Use Health
»
Community Drug Strategy for the City of Greater Sudbury
»
Research
»
Drug Surveillance
»
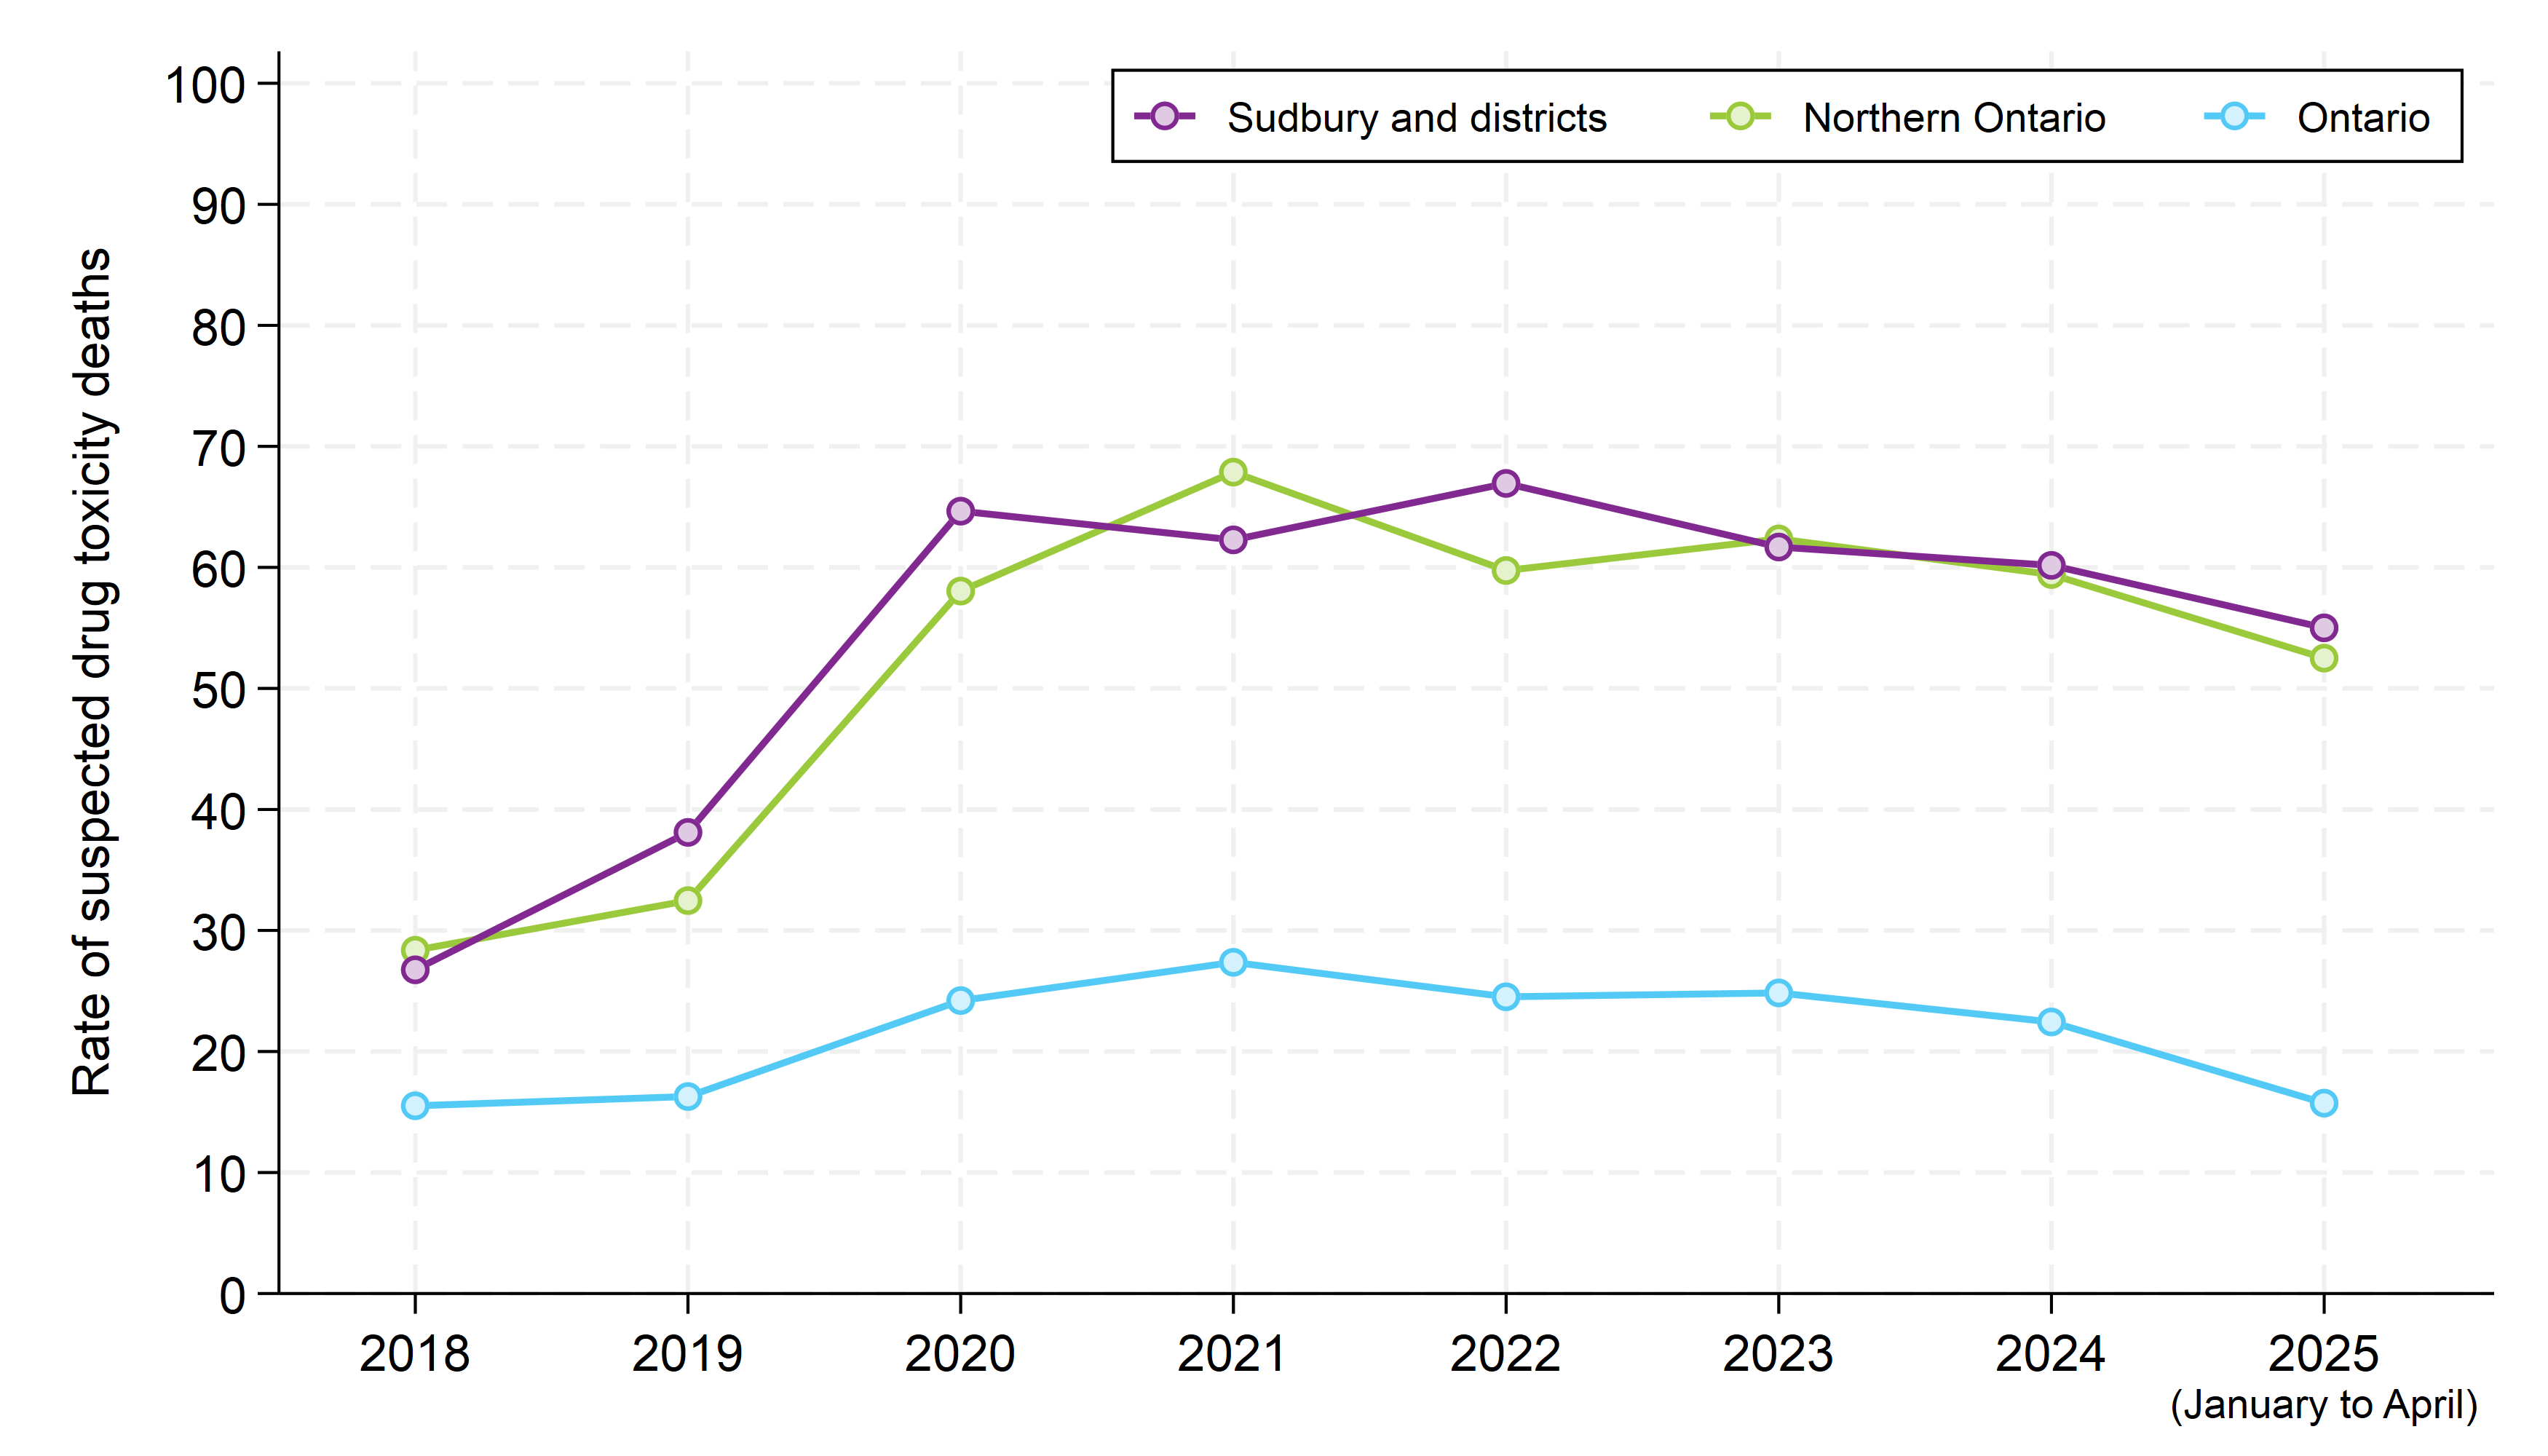
Suspected drug toxicity deaths
» OpioidDashboard_Graph_DeathRates_EN
OpioidDashboard_Graph_DeathRates_EN
This item was last modified on May 20, 2025
Back to top of page
↑