Exceeding the Low-Risk Alcohol Drinking Guidelines
Canada’s Low-Risk Alcohol Drinking Guidelines (LRADG) were developed to help Canadians moderate their alcohol consumption and to prevent both immediate and long-term alcohol-related harms. Here, we present rates of individuals aged 19 years and older who reported drinking in excess of these guidelines. This includes:
- males that drank more than 15 drinks per week, or females that drank more than 10 drinks per week, or
- males that drank more than 3 drinks per day, or females that drank more than 2 drinks per day, or
- males and females with less than 2 non-drinking days a week, or
- males or females that drank 5 or more drinks on any one occasion in the previous year
Note that pregnant women and breastfeeding women are excluded from these calculations.
Drinking in excess of the Low-Risk Alcohol Drinking Guidelines by geographic area
Key findings
- In 2013/14, survey results indicated that 35% of the population aged 19 and older in Sudbury and districts drank in excess of the Low-Risk Alcohol Drinking Guidelines (LRADG).
- The proportion of the population who reported drinking above the LRADG in Sudbury and districts has consistently been similar to that reported in northeastern Ontario, but higher than Ontario overall.
- Between 2007/08 and 2013/14, the rate of drinking in excess of the LRADG in Sudbury and districts has not varied significantly.
Notes:
- Starting in 2013, the data used to measure drinking in excess of the LRADG among females was changed. It now flags when a woman has consumed 4 or more servings on one occasion at least once in the past year, instead of 5 servings. This definition change has resulted in an increase in the reported rate of drinking in excess of the LRADG among females in 2013/14.
- Rates are age-standardized using the 2011 Canadian population.
- Rates are for the population aged 19 years and older.
- Pregnant and breastfeeding women are excluded.
- Data source: Canadian Community Health Survey (CCHS), 2007 to 2014, Statistics Canada, Share File, Ontario Ministry of Health and Long-Term Care.
Figure: Age-standardized prevalence rate, exceeding the Low-Risk Alcohol Drinking Guidelines, by year and geographic area, ages 19+, 2007/08 to 2013/14
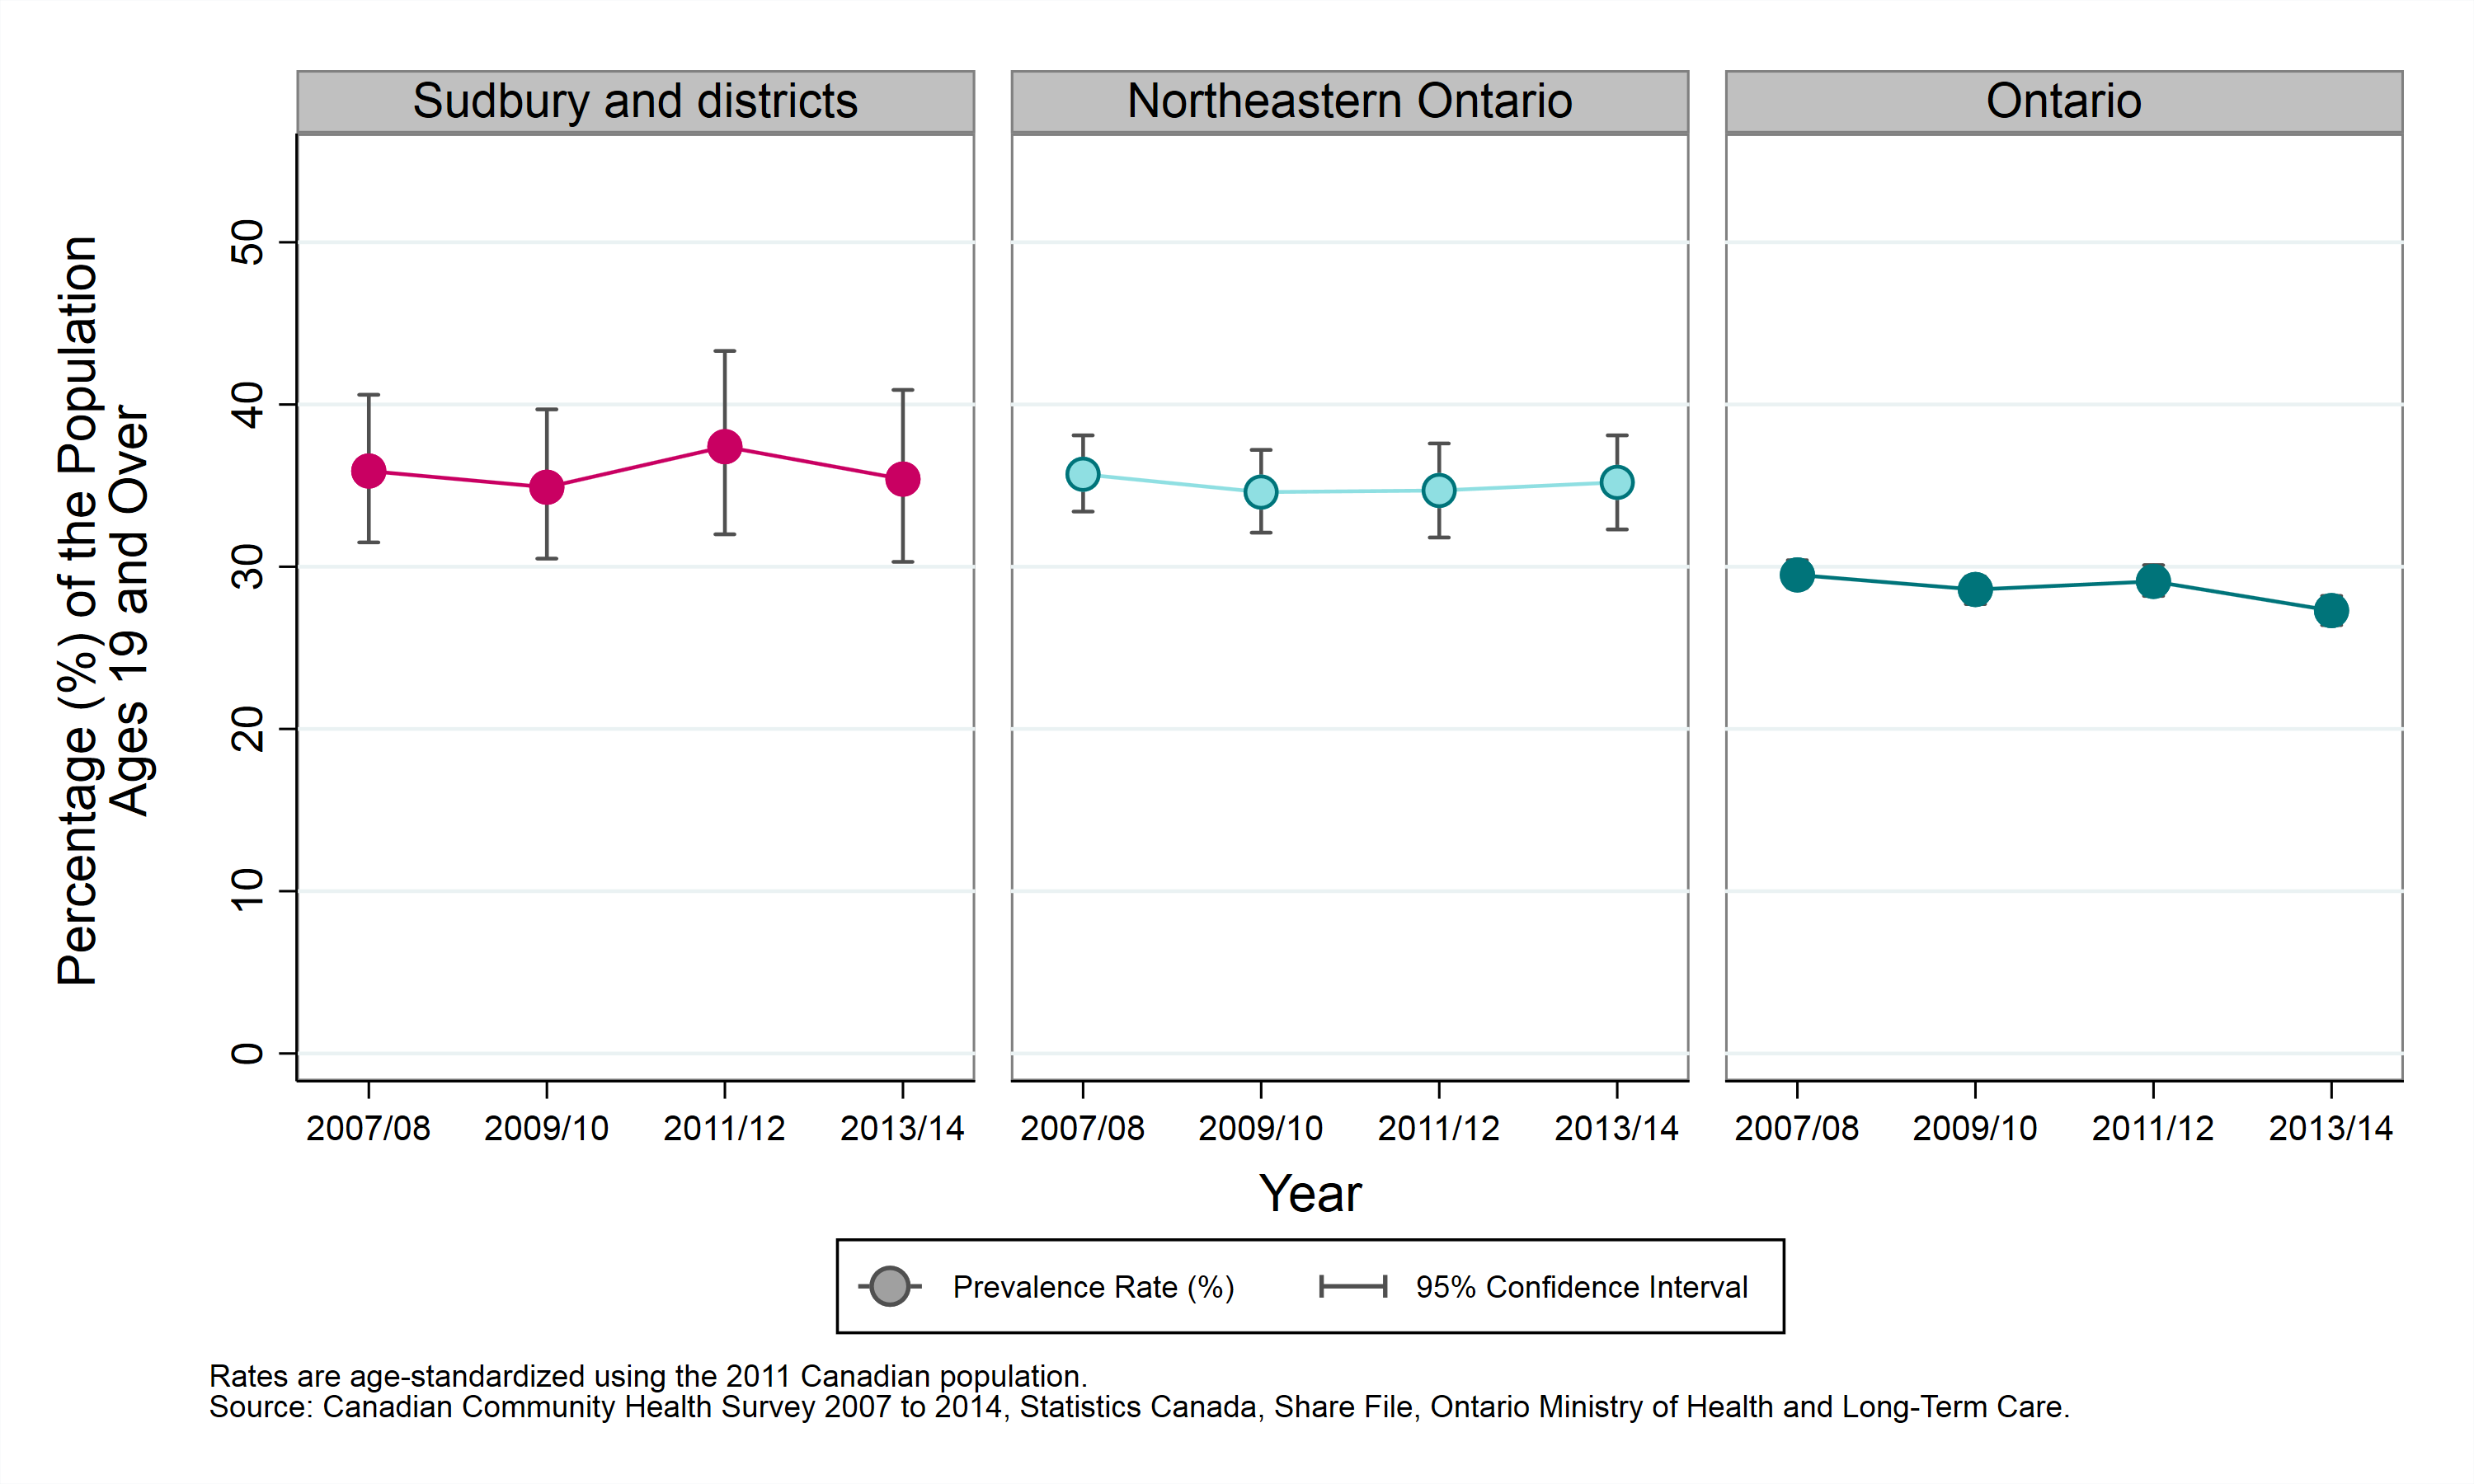
Table: Age-standardized prevalence rate, exceeding the Low-Risk Alcohol Drinking Guidelines, by year and geographic area, ages 19+, 2007/08 to 2013/14
| Geographic Region | Prevalence Rate, 2007 to 2008 | Prevalence Rate, 2009 to 2010 | Prevalence Rate, 2011 to 2012 | Prevalence Rate, 2013 to 2014 |
|---|---|---|---|---|
| Sudbury and districts | 35.9% (CI: 31.5% to 40.6%) | 34.9% (CI: 30.5% to 39.7%) | 37.4% (CI: 32.0% to 43.3%) | 35.4% (CI: 30.3% to 40.9%) |
| Northeastern Ontario | 35.7% (CI: 33.4% to 38.1%) | 34.6% (CI: 32.1% to 37.2%) | 34.7% (CI: 31.8% to 37.6%) | 35.2% (CI: 32.3% to 38.1%) |
| Ontario | 29.5% (CI: 28.7% to 30.4%) | 28.6% (CI: 27.7% to 29.4%) | 29.1% (CI: 28.2% to 30.1%) | 27.3% (CI: 26.4% to 28.2%) |
Drinking in excess of the Low-Risk Alcohol Drinking Guidelines by sex
Key findings
- Between 2011 and 2014, survey results indicated that the prevalence rate of drinking above the Low-Risk Alcohol Drinking Guidelines (LRADG) was 49% in males, and 24% in females, in Sudbury and districts.
- The prevalence rate of drinking above the LRADG in males in Sudbury and districts has consistently been higher than in females.
- Between 2007 to 2010 and 2011 to 2014, the rate of drinking in excess of the LRADG in Sudbury and districts has not varied significantly in either males or females.
Notes:
- Starting in 2013, the data used to measure drinking in excess of the LRADG among females was changed. It now flags when a woman has consumed 4 or more servings on one occasion at least once in the past year, instead of 5 servings. This definition change has resulted in an increase in the reported rate of drinking in excess of the LRADG among females in 2013/14.
- Rates are age-standardized using the 2011 Canadian population.
- Rates are for the population aged 19 years and older.
- Pregnant and breastfeeding women are excluded.
- Data source: Canadian Community Health Survey (CCHS), 2007 to 2014, Statistics Canada, Share File, Ontario Ministry of Health and Long-Term Care.
Figure: Age-standardized prevalence rate, exceeding the Low-Risk Alcohol Drinking Guidelines, by year and sex, ages 19+, 2007 to 2010 and 2011 to 2014
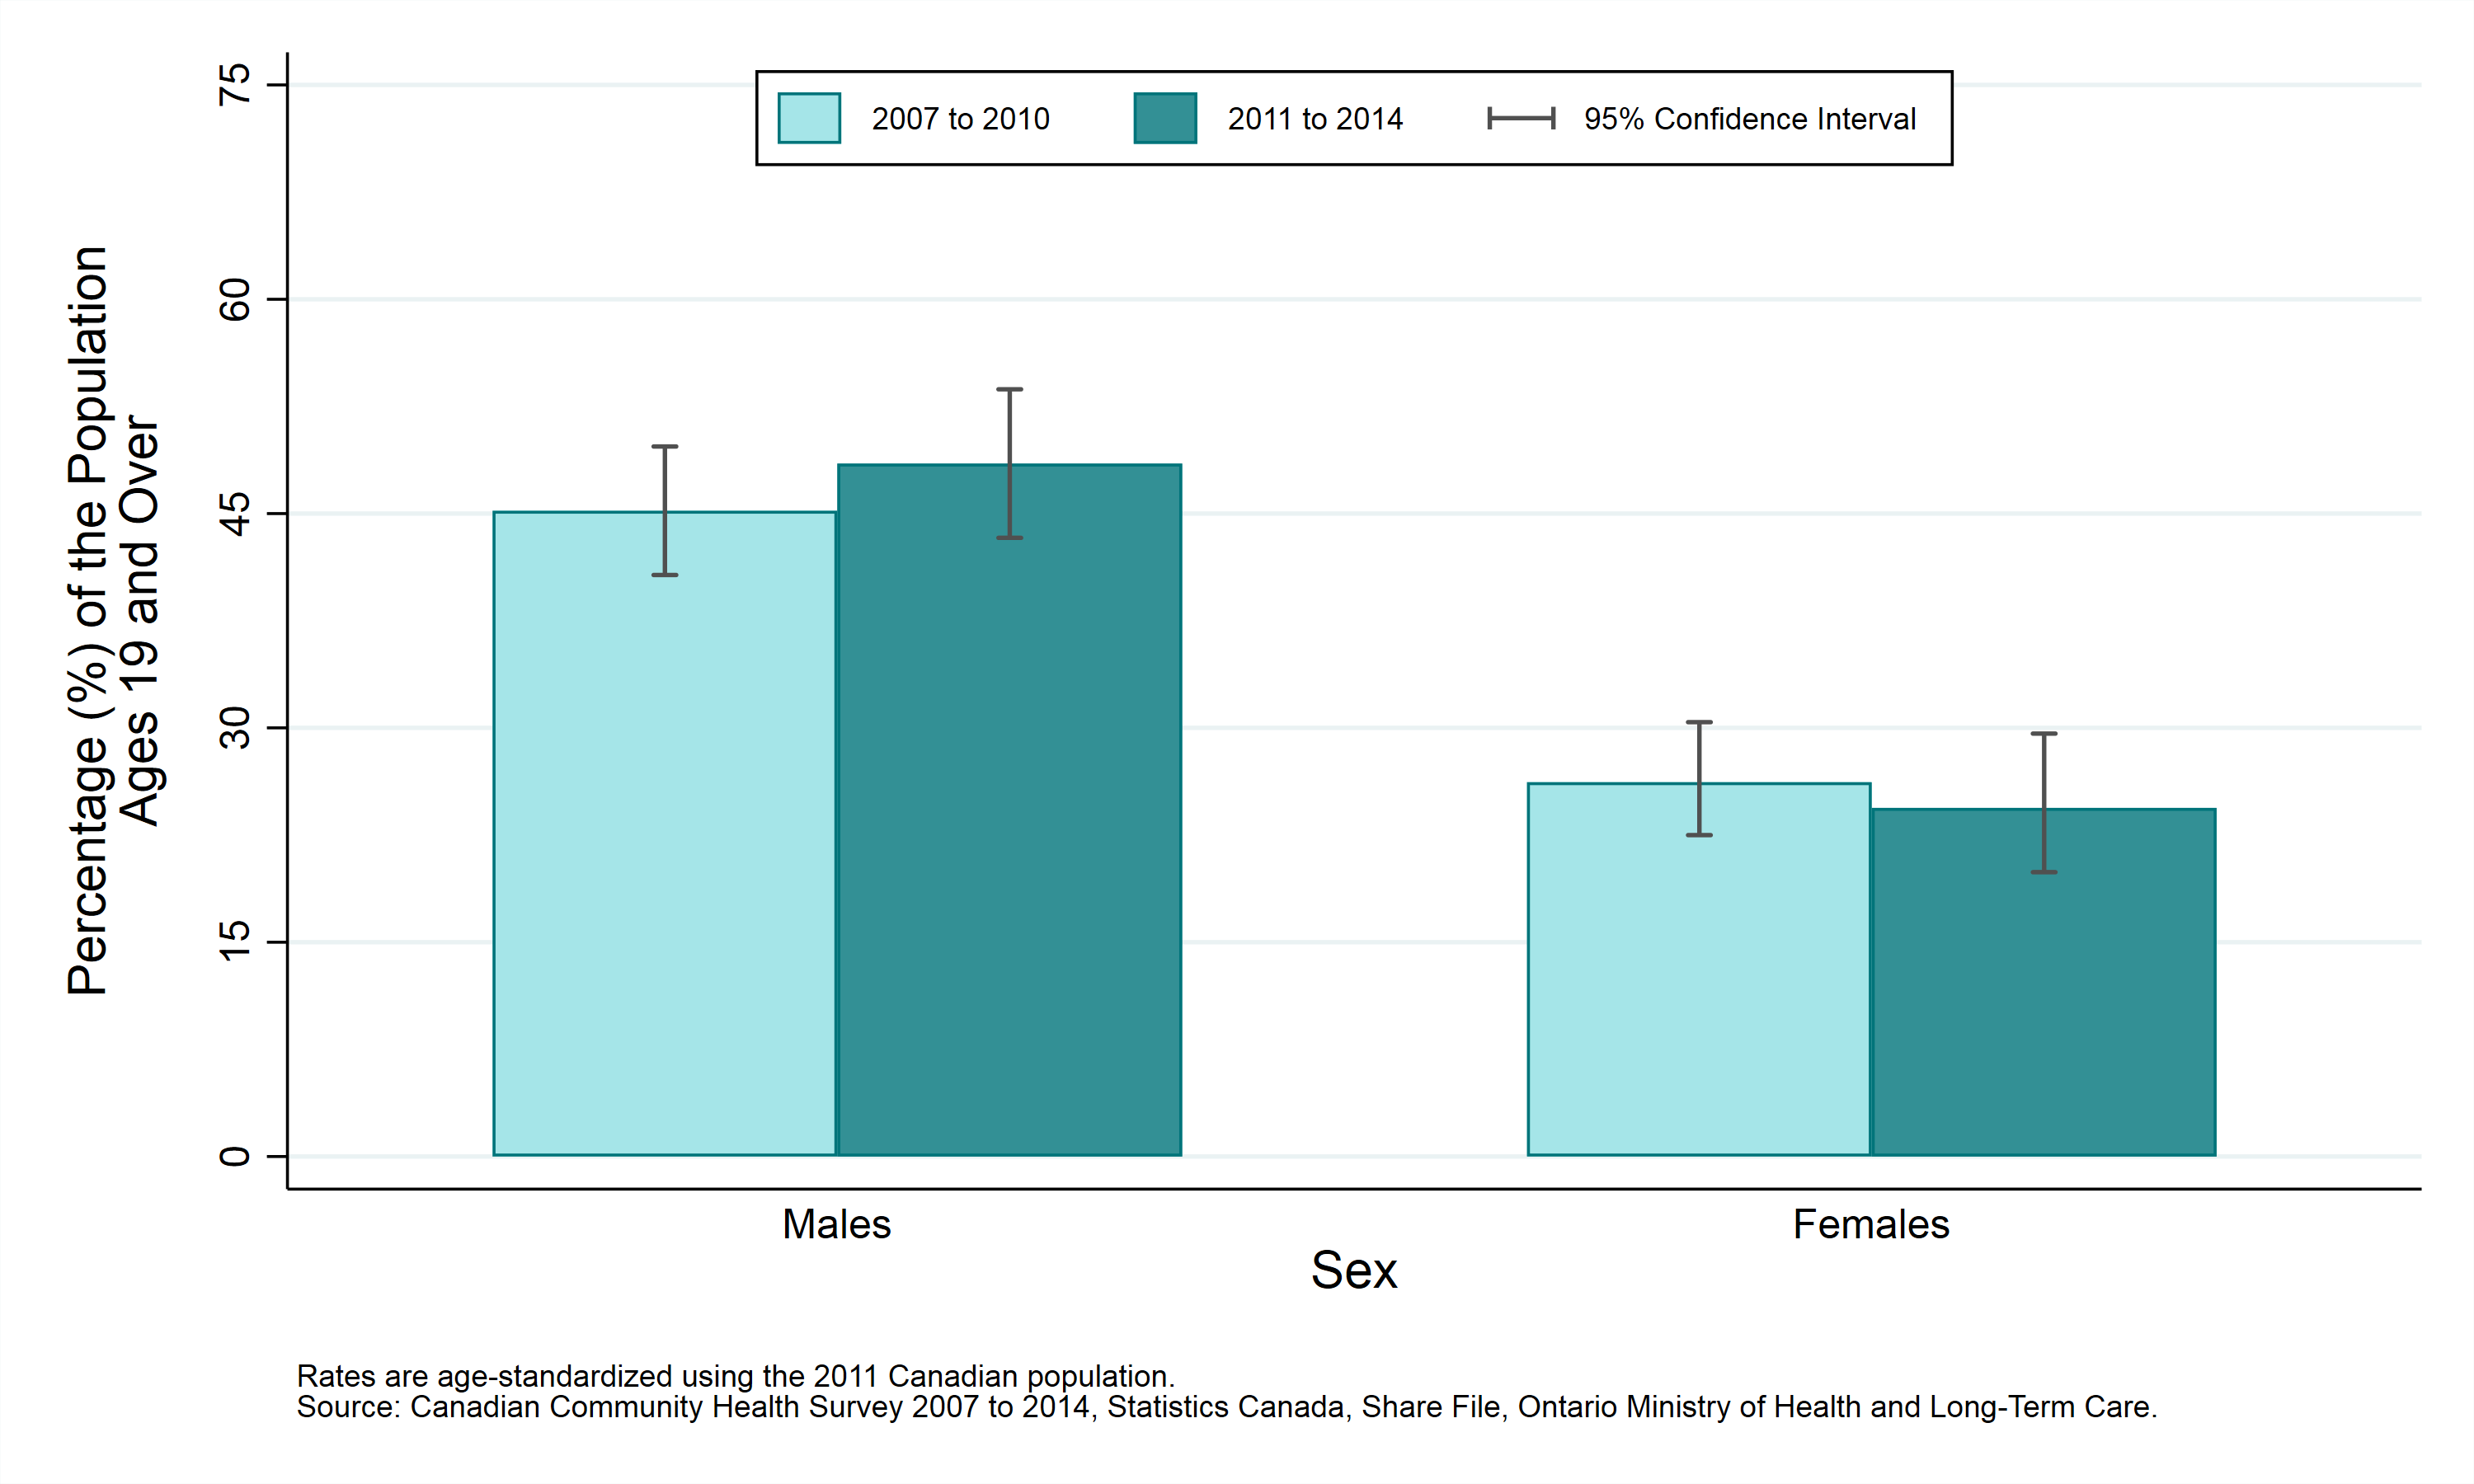
Table: Age-standardized prevalence rate, exceeding the Low-Risk Alcohol Drinking Guidelines, by year and sex, ages 19+, 2007 to 2010 and 2011 to 2014
| Sex | Prevalence Rate, 2007 to 2010 | Prevalence Rate, 2011 to 2014 |
|---|---|---|
| Males | 45.2% (CI: 40.7% to 49.7%) | 48.5% (CI: 43.3% to 53.7%) |
| Females | 26.2% (CI: 22.5% to 30.4%) | 24.4% (CI: 19.9% to 29.6%) |
Drinking in excess of the Low-Risk Alcohol Drinking Guidelines by age group
Key findings
- Between 2011 and 2014, survey results indicated that rate of drinking in excess of the Low-Risk Alcohol Drinking Guidelines (LRADG) was lower in seniors aged 65 and older than the rate reported by younger age groups.
- Reported rates of drinking in excess of the LRADG have not varied significantly within any age group.
Notes:
- Starting in 2013, the data used to measure drinking in excess of the LRADG among females was changed. It now flags when a woman has consumed 4 or more servings on one occasion at least once in the past year, instead of 5 servings. This definition change has resulted in an increase in the reported rate of drinking in excess of the LRADG among females in 2013/14.
- Rates are for the population aged 19 years and older.
- Pregnant and breastfeeding women are excluded.
- Data source: Canadian Community Health Survey (CCHS), 2007 to 2014, Statistics Canada, Share File, Ontario Ministry of Health and Long-Term Care.
Figure: Age-standardized prevalence rate, exceeding the Low-Risk Alcohol Drinking Guidelines, by year and age group, ages 19+, 2007 to 2010 and 2011 to 2014
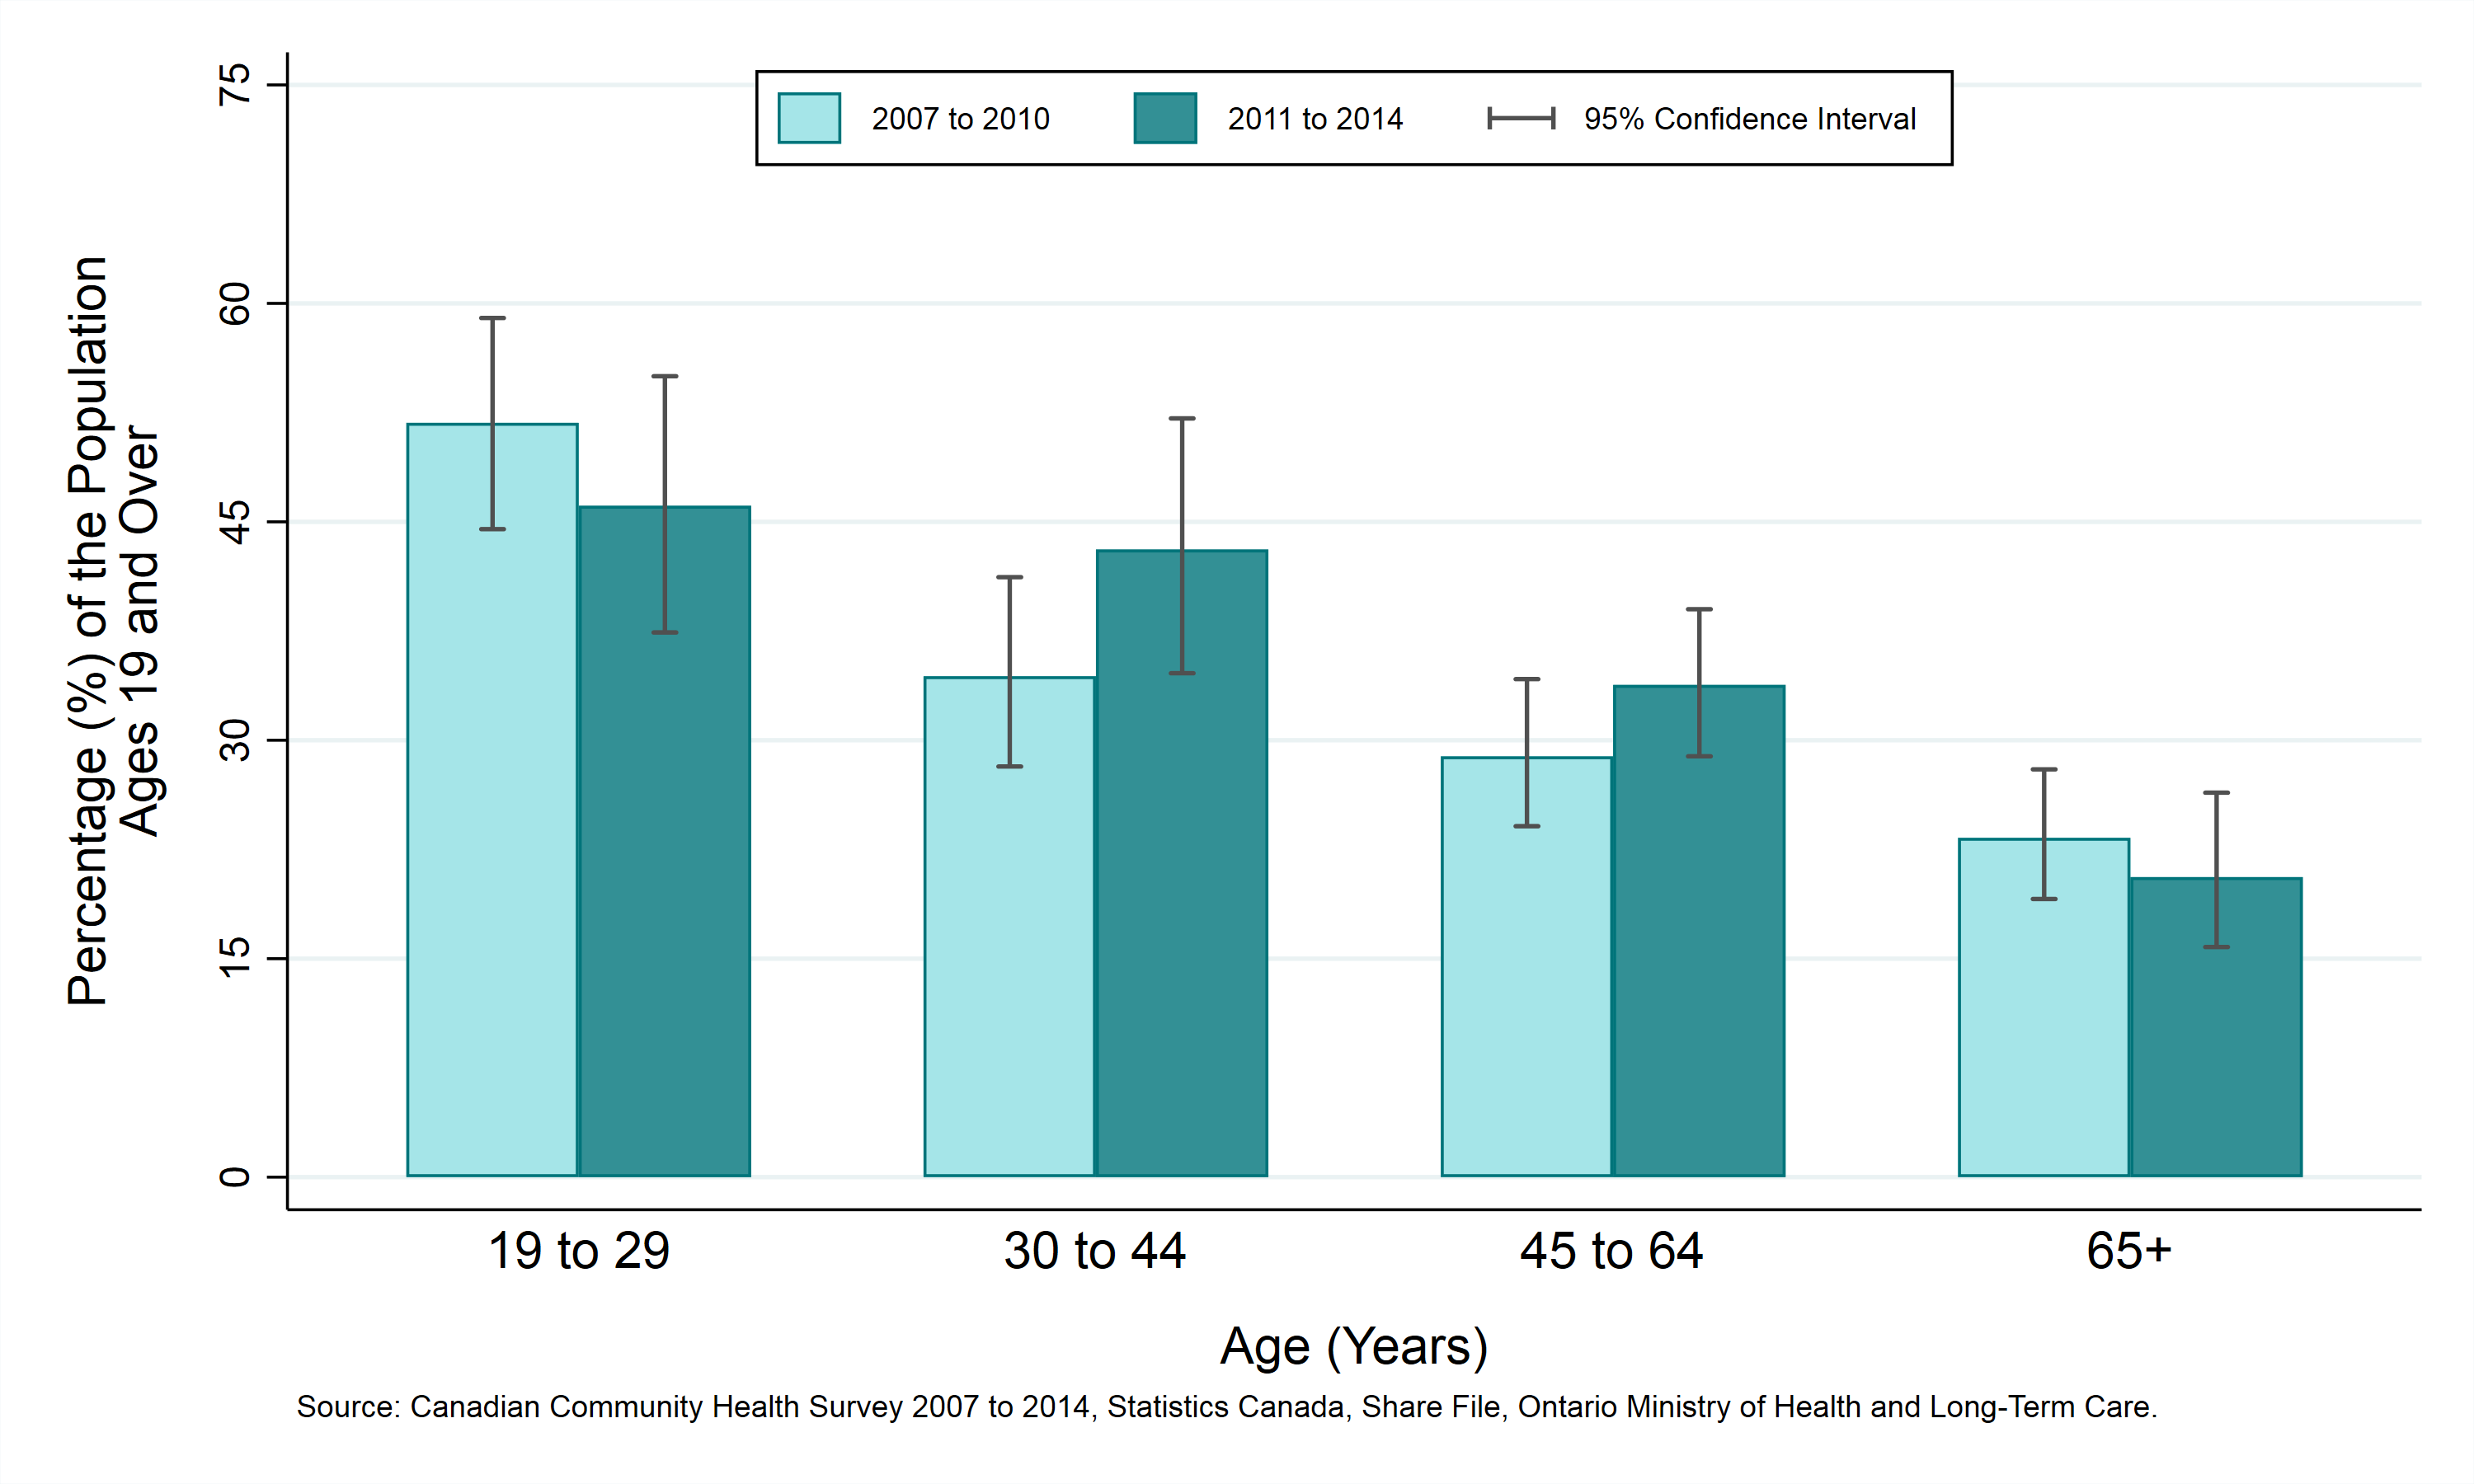
Table: Age-standardized prevalence rate, exceeding the Low-Risk Alcohol Drinking Guidelines, by year and age group, ages 19+, 2007 to 2010 and 2011 to 2014
| Age (Years) | Prevalence Rate, 2007 to 2010 | Prevalence Rate, 2011 to 2014 |
|---|---|---|
| 19 to 29 | 51.8% (CI: 44.5% to 59.0%) | 46.1% (CI: 37.4% to 55.0%) |
| 30 to 44 | 34.4% (CI: 28.2% to 41.2%) | 43.1% (CI: 34.6% to 52.1%) |
| 45 to 64 | 28.9% (CI: 24.1% to 34.2%) | 33.8% (CI: 28.9% to 39.0%) |
| 65+ | 23.3% (CI: 19.1% to 28.0%) | 20.6% (CI: 15.8% to 26.4%) |
Drinking in excess of the Low-Risk Alcohol Drinking Guidelines by household income
Key findings:
- Between 2011 and 2014, survey results indicated that that rate of drinking in excess of the Low-Risk Alcohol Drinking Guidelines (LRADG) did not vary significantly by household income quintile.
- Reported rates of drinking in excess of the LRADG have not varied significantly between 2007 to 2010 and 2011 to 2014 within any household income quintile.
Notes:
- Starting in 2013, the data used to measure drinking in excess of the LRADG among females was changed. It now flags when a woman has consumed 4 or more servings on one occasion at least once in the past year, instead of 5 servings. This definition change has resulted in an increase in the reported rate of drinking in excess of the LRADG among females in 2013/14.
- Rates are age-standardized using the 2011 Canadian population.
- Rates are for the population aged 19 years and older.
- Pregnant and breastfeeding women are excluded.
- Data source: Canadian Community Health Survey (CCHS), 2007 to 2014, Statistics Canada, Share File, Ontario Ministry of Health and Long-Term Care.
Figure: Age-standardized prevalence rate, exceeding the Low-Risk Alcohol Drinking Guidelines, by year and household income, ages 19+, 2007 to 2010 and 2011 to 2014
Table: Age-standardized prevalence rate, exceeding the Low-Risk Alcohol Drinking Guidelines, by year and household income, ages 19+, 2007 to 2010 and 2011 to 2014
Note: Numbers followed by the letter “E” are to be interpreted with caution due to high sampling variability.
| Household Income Distribution | Prevalence Rate, 2007 to 2010 | Prevalence Rate, 2011 to 2014 |
|---|---|---|
| Quintile 1 (Lowest) | 25.9% (CI: 20.4% to 32.4%) | 34.5% (CI: 26.3% to 43.7%) |
| Quintile 2 | 35.2% (CI: 28.5% to 42.6%) | 27.5% E (CI: 19.4% to 37.3%) |
| Quintile 3 | 33.3% (CI: 26.2% to 41.2%) | 28.7% (CI: 21.8% to 36.6%) |
| Quintile 4 | 47.8% (CI: 39.6% to 56.0%) | 42.3% (CI: 32.5% to 52.7%) |
| Quintile 5 (Highest) | 43.3% (CI: 35.1% to 52.0%) | 46.4% (CI: 37.0% to 56.1%) |
Drinking in excess of the Low-Risk Alcohol Drinking Guidelines by education
Key findings:
- Between 2011 and 2014, survey results indicated that the reported rates of drinking in excess of the Low-Risk Alcohol Drinking Guidelines (LRADG) were similar among education groups.
- Reported rates of drinking in excess of the LRADG have not varied significantly between 2007 to 2010 and 2011 to 2014 in any of the education groups.
Notes:
- Starting in 2013, the data used to measure drinking in excess of the LRADG among females was changed. It now flags when a woman has consumed 4 or more servings on one occasion at least once in the past year, instead of 5 servings. This definition change has resulted in an increase in the reported rate of drinking in excess of the LRADG among females in 2013/14.
- Rates are age-standardized using the 2011 Canadian population.
- Rates are for the population aged 19 years and older.
- Pregnant and breastfeeding women are excluded.
- Data source: Canadian Community Health Survey (CCHS), 2007 to 2014, Statistics Canada, Share File, Ontario Ministry of Health and Long-Term Care.
Figure: Age-standardized prevalence rate, exceeding the Low-Risk Alcohol Drinking Guidelines, by year and education, ages 19+, 2007 to 2010 and 2011 to 2014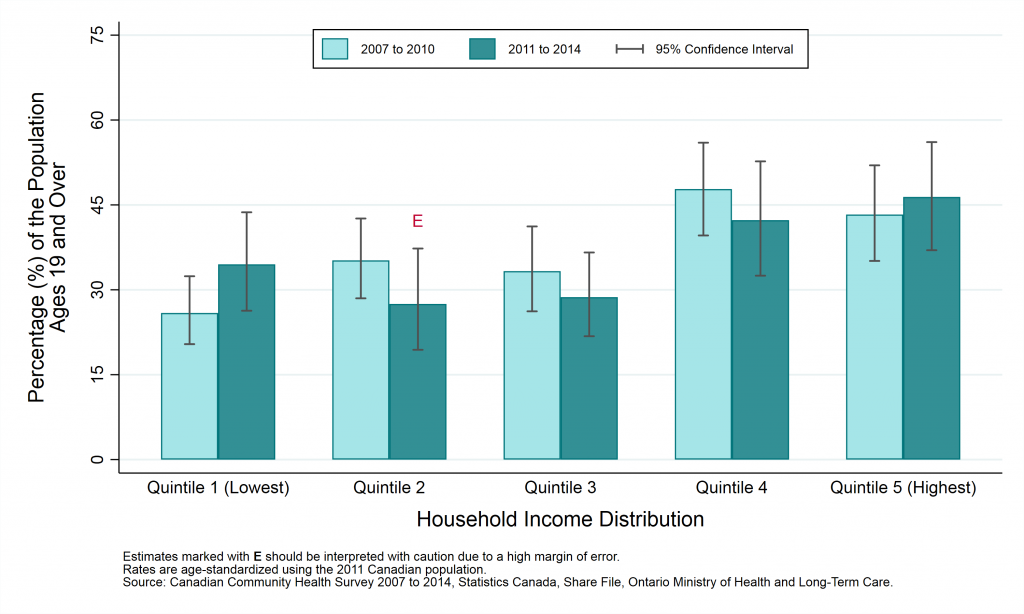

Table: Age-standardized prevalence rate, exceeding the Low-Risk Alcohol Drinking Guidelines, by year and education, ages 19+, 2007 to 2010 and 2011 to 2014
| Education | Prevalence Rate, 2007 to 2010 | Prevalence Rate, 2011 to 2014 |
|---|---|---|
| < Highschool Diploma | 30.3% (CI: 21.7% to 40.5%) | 38.1% (CI: 26.7% to 51.0%) |
| Highschool Diploma | 34.2% (CI: 27.5% to 41.6%) | 29.9% (CI: 22.7% to 38.3%) |
| Trade, College or University Diploma or Certificate | 29.7% (CI: 25.6% to 34.0%) | 39.1% (CI: 33.3% to 45.2%) |
| University Degree | 32.3% (CI: 24.7% to 41.0%) | 30.2% (CI: 23.6% to 37.7%) |
Drinking in excess of the Low-Risk Alcohol Drinking Guidelines by first official language spoken
Key findings:
- Between 2011 and 2014, survey results indicated that the reported rates of drinking in excess of the Low-Risk Alcohol Drinking Guidelines (LRADG) were similar among both official language groups.
- Reported rates of drinking in excess of the LRADG have not varied significantly between 2007 to 2010 and 2011 to 2014 within either official language group.
Notes:
- Starting in 2013, the data used to measure drinking in excess of the LRADG among females was changed. It now flags when a woman has consumed 4 or more servings on one occasion at least once in the past year, instead of 5 servings. This definition change has resulted in an increase in the reported rate of drinking in excess of the LRADG among females in 2013/14.
- Canada’s official languages are French and English. An individual’s “first official language spoken” is determined using their answers to a number of questions about the languages they speak. A small percentage of people are classified as having both French and English as their “first” official language spoken. Such individuals are included here as French. People speaking neither French nor English are excluded from this analysis.
- Rates are age-standardized using the 2011 Canadian population.
- Rates are for the population aged 19 years and older.
- Pregnant and breastfeeding women are excluded.
- Data source: Canadian Community Health Survey (CCHS), 2007 to 2014, Statistics Canada, Share File, Ontario Ministry of Health and Long-Term Care.
Figure: Age-standardized prevalence rate, exceeding the Low-Risk Alcohol Drinking Guidelines, by year and first official language spoken, ages 19+, 2007 to 2010 and 2011 to 2014
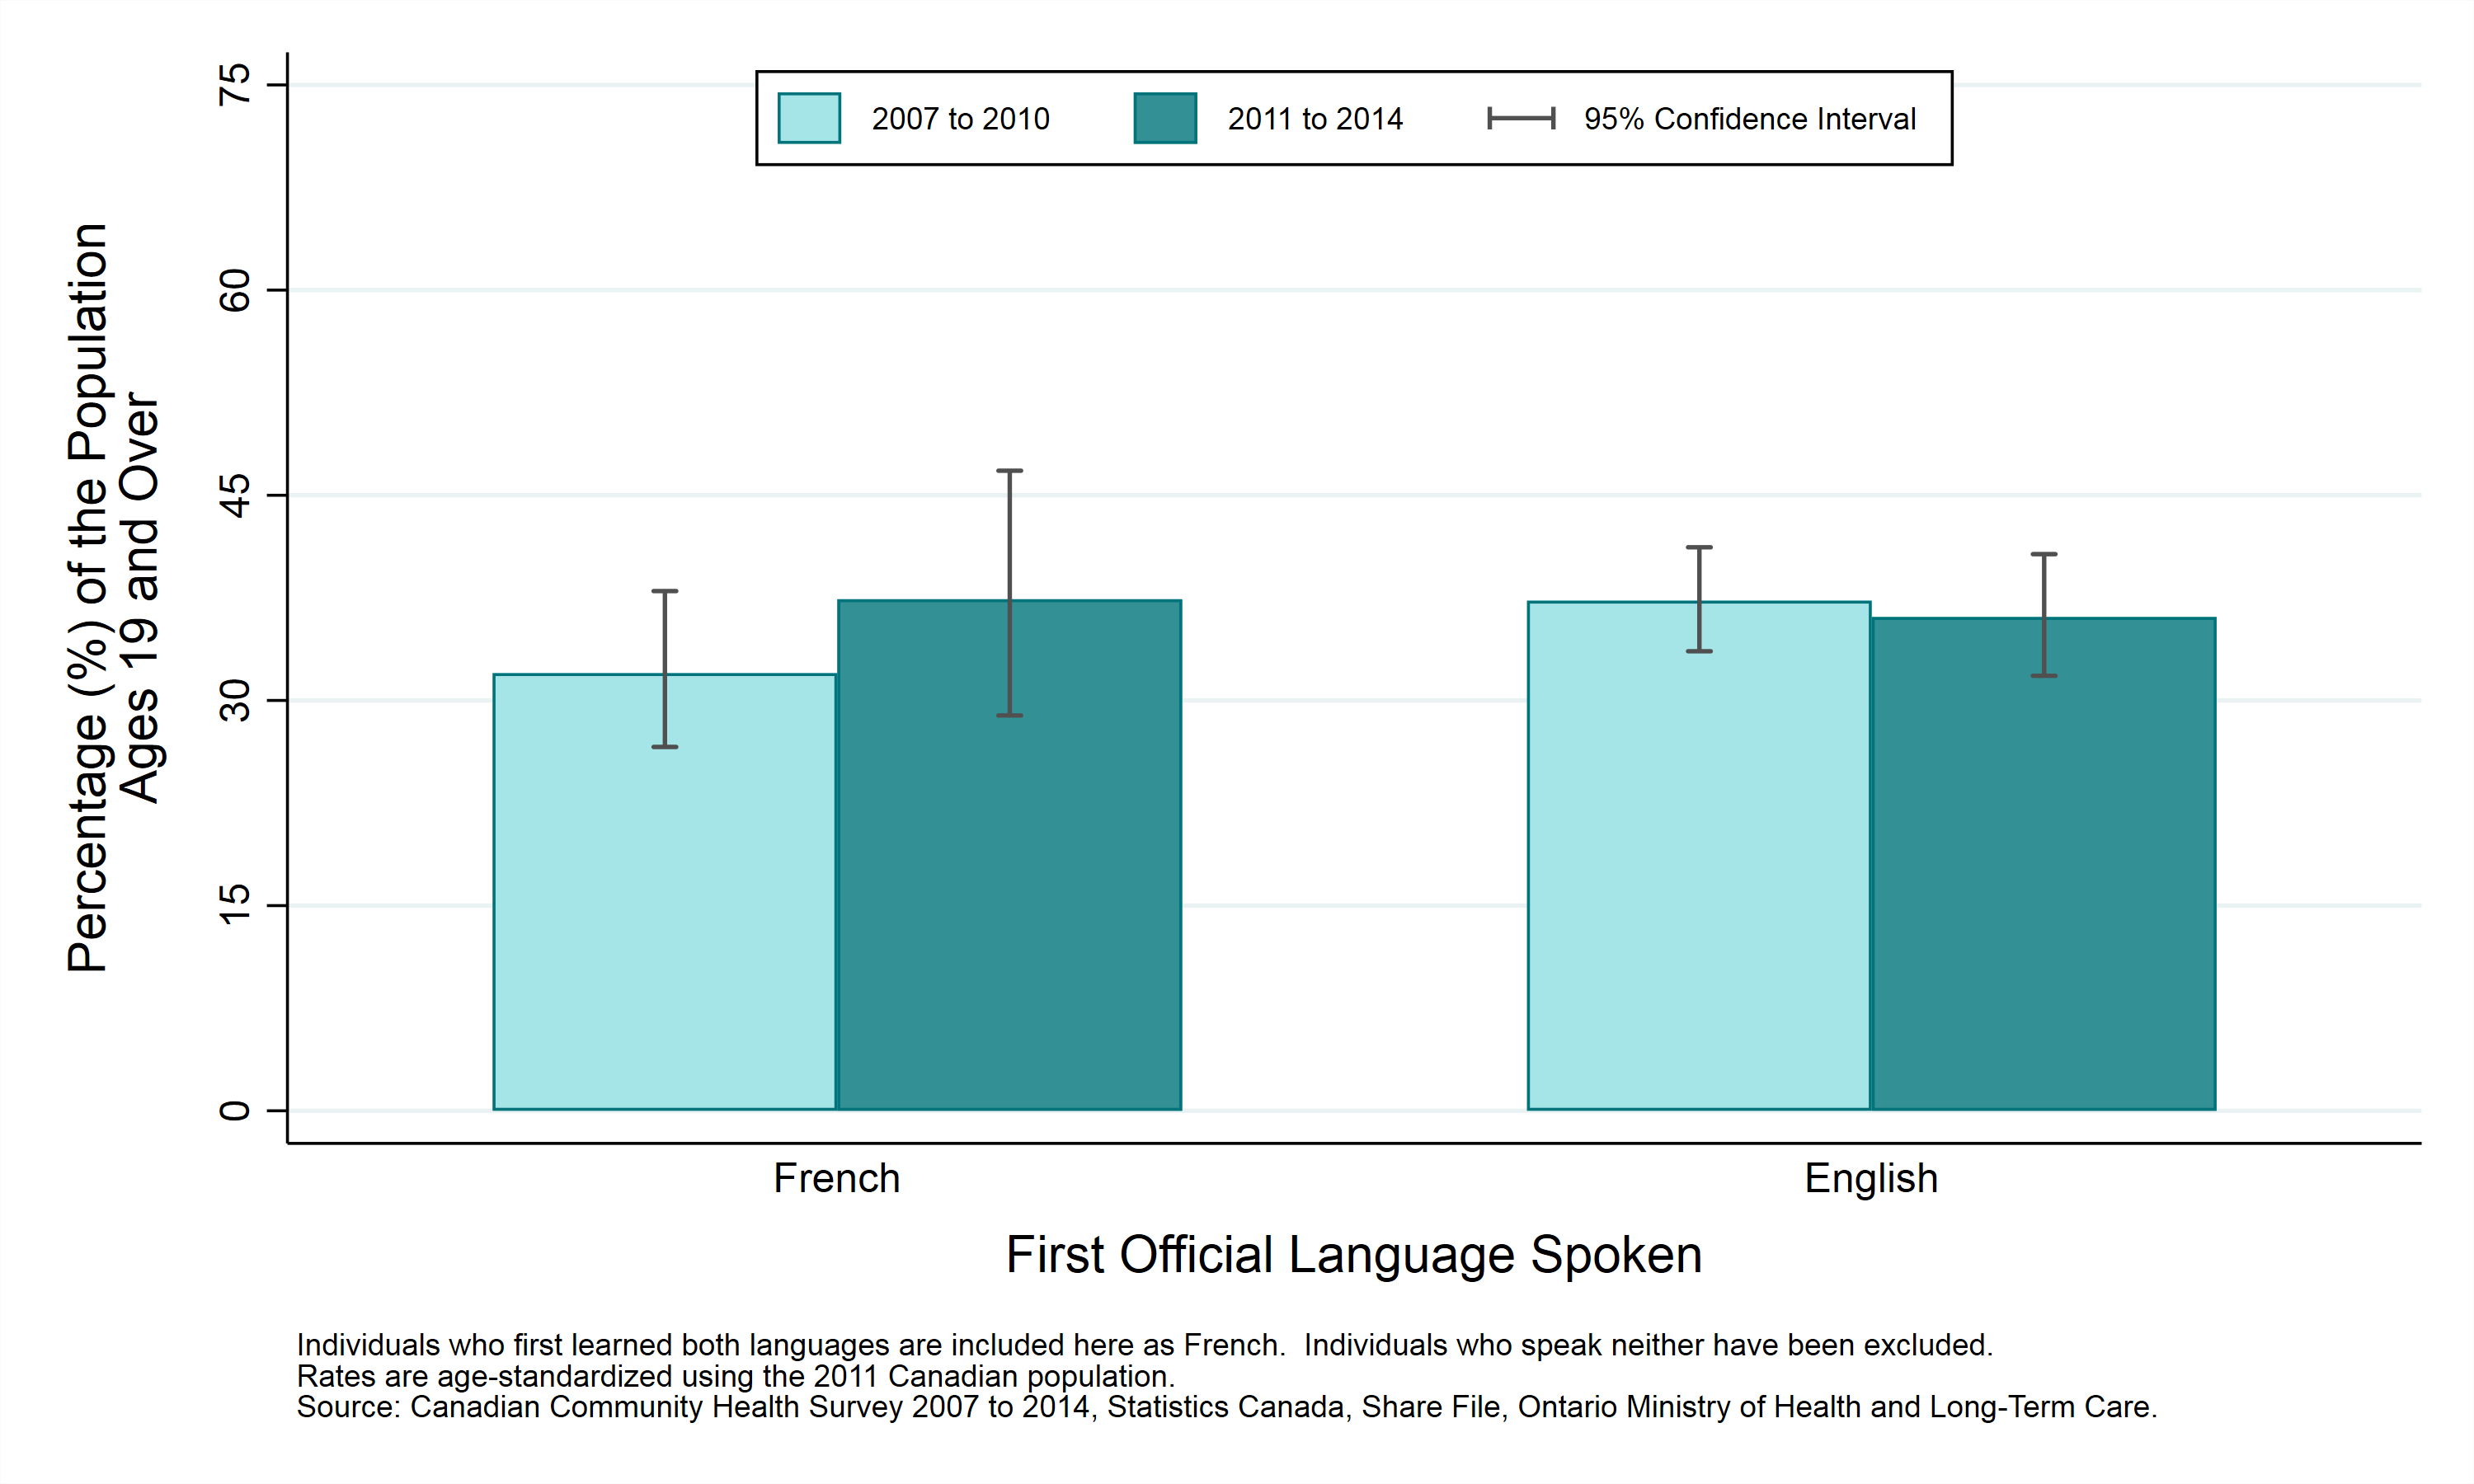
Table: Age-standardized prevalence rate, exceeding the Low-Risk Alcohol Drinking Guidelines, by year and first official language spoken, ages 19+, 2007 to 2010 and 2011 to 2014
| First Official Language Spoken | Prevalence Rate, 2007 to 2010 | Prevalence Rate, 2011 to 2014 |
|---|---|---|
| French | 32.0% (CI: 26.6% to 38.0%) | 37.4% (CI: 28.9% to 46.8%) |
| English | 37.3% (CI: 33.6% to 41.2%) | 36.1% (CI: 31.8% to 40.7%) |
This item was last modified on December 10, 2025