Heavy drinking
For males, heavy drinking is defined as consuming at least 5 servings of alcohol on at least one occasion per month in the previous 12 months. For females, the threshold is 4 servings. This level of alcohol consumption can have serious health and social consequences.
This definition has changed over the years. Prior to 2013, the threshold was 5 or more servings for both males and females.
Rates of heavy drinking presented in this section are calculated for the population aged 12 and over.
Heavy drinking by geographic area
Key findings
- In 2013/14, survey results indicated that the prevalence rate of heavy drinking was 24% in Sudbury and districts.
- The prevalence rate of heavy drinking in Sudbury and districts has consistently been similar to that reported in northeastern Ontario, but higher than Ontario overall.
- Between 2007/08 and 2013/14, the rate of heavy drinking in Sudbury and districts has not varied significantly.
Notes:
- Starting in 2013, the definition of heavy drinking among females was lowered from 5 or more servings to 4 or more servings on one occasion at least once per month for the past year. This change has likely resulted in a slight increase in the rate of reported heavy drinking among females, and thus also overall, in 2013/14.
- Rates are age-standardized using the 2011 Canadian population.
- Rates are for the population aged 12 years and older.
- Data source: Canadian Community Health Survey (CCHS), 2007 to 2014, Statistics Canada, Share File, Ontario Ministry of Health and Long-Term Care.
Figure: Age-standardized prevalence rate, heavy drinking, by year and geographic area, ages 12+, 2007/08 to 2013/14
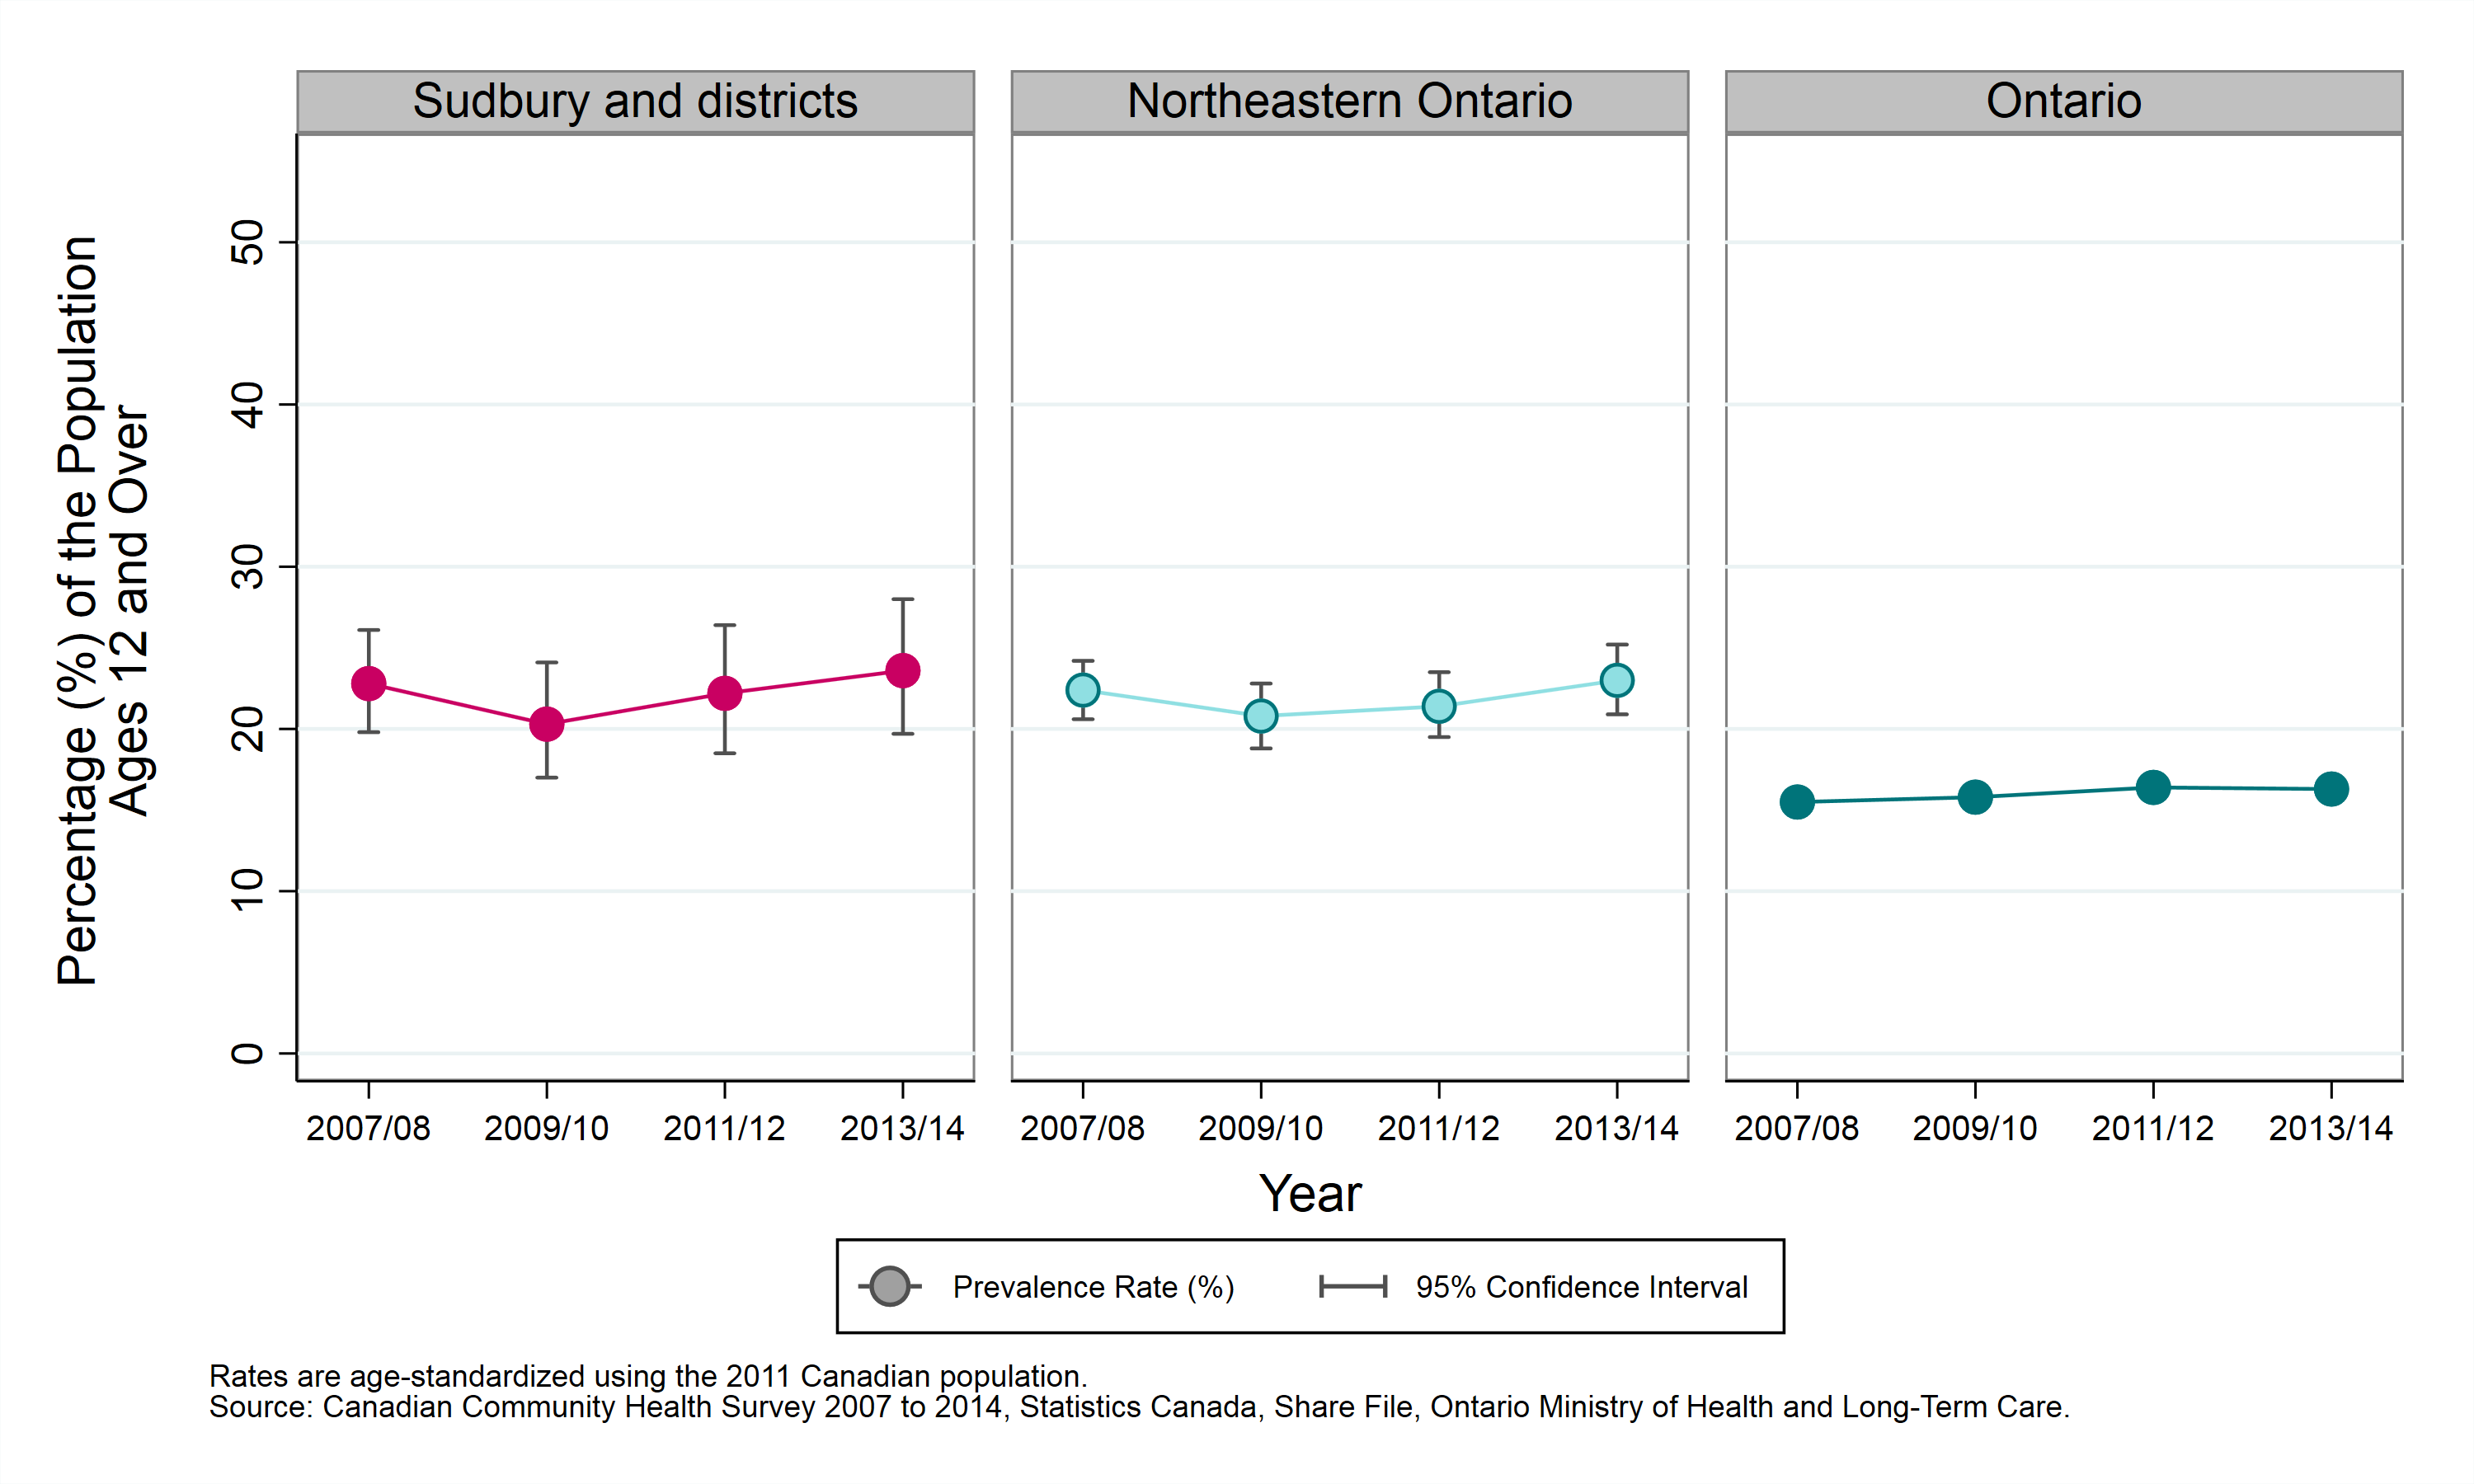
Table: Age-standardized prevalence rate, heavy drinking, by year and geographic area, ages 12+, 2007/08 to 2013/14
| Geographic Region | Prevalence Rate, 2007 to 2008 | Prevalence Rate, 2009 to 2010 | Prevalence Rate, 2011 to 2012 | Prevalence Rate, 2013 to 2014 |
|---|---|---|---|---|
| Sudbury and districts | 22.8% (CI: 19.8% to 26.1%) | 20.3% (CI: 17.0% to 24.1%) | 22.2% (CI: 18.5% to 26.4%) | 23.6% (CI: 19.7% to 28.0%) |
| Northeastern Ontario | 22.4% (CI: 20.6% to 24.2%) | 20.8% (CI: 18.8% to 22.8%) | 21.4% (CI: 19.5% to 23.5%) | 23.0% (CI: 20.9% to 25.2%) |
| Ontario | 15.5% (CI: 14.9% to 16.1%) | 15.8% (CI: 15.2% to 16.3%) | 16.4% (CI: 15.7% to 17.0%) | 16.3% (CI: 15.7% to 17.0%) |
Heavy drinking by sex
Key findings
- Between 2011 and 2014, survey results indicated that the prevalence rate of heavy drinking was 32% in males, and 14% in females, in Sudbury and districts.
- The prevalence rate of heavy drinking in males in Sudbury and districts has consistently been higher than in females.
- Between 2007 to 2010 and 2011 to 2014, the rate of heavy drinking in Sudbury and districts has not varied significantly in either males or females.
Notes:
- Starting in 2013, the definition of heavy drinking among females was lowered from 5 or more servings to 4 or more servings on one occasion at least once per month for the past year. This definition has resulted in an increase in the rate of reported heavy drinking among females, and thus also overall, in 2013/14.
- Rates are age-standardized using the 2011 Canadian population.
- Rates are for the population aged 12 years and older.
- Data source: Canadian Community Health Survey (CCHS), 2007 to 2014, Statistics Canada, Share File, Ontario Ministry of Health and Long-Term Care.
Figure: Age-standardized prevalence rate, heavy drinking, ages 12+, by year and sex, 2007 to 2010 and 2011 to 2014
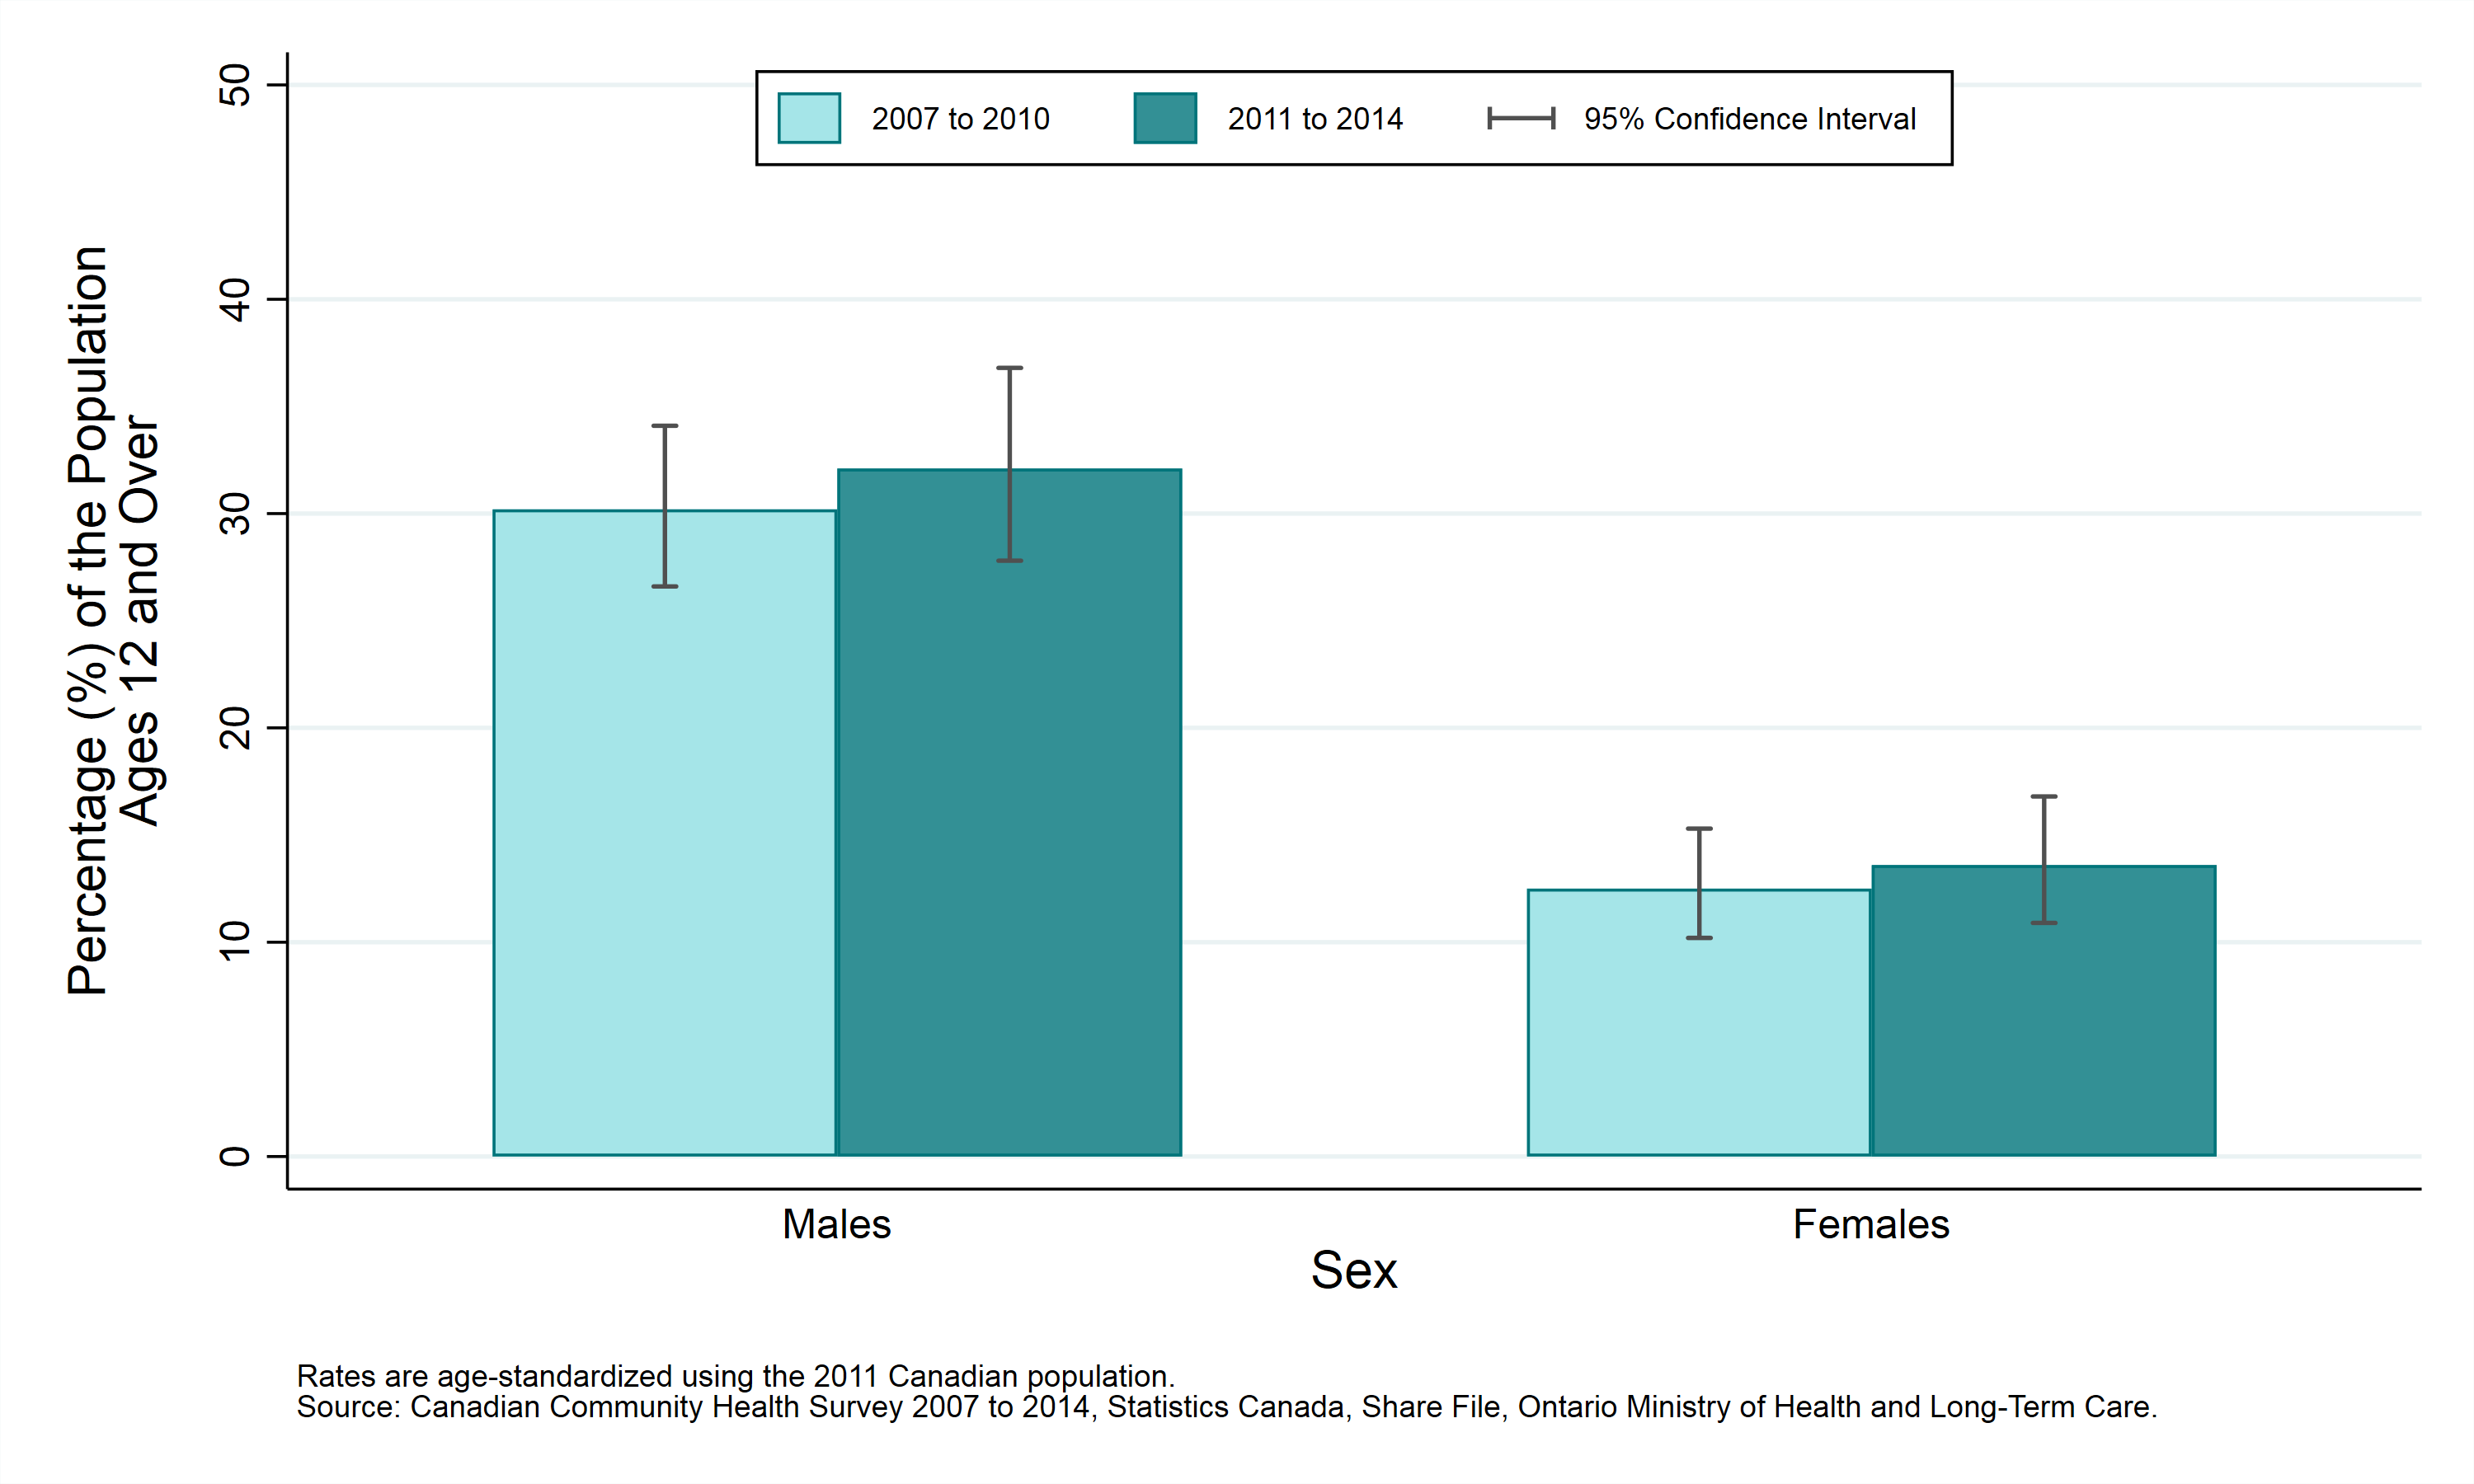
Table: Age-standardized prevalence rate, heavy drinking, ages 12+, by year and sex, 2007 to 2010 and 2011 to 2014
| Sex | Prevalence Rate, 2007 to 2010 | Prevalence Rate, 2011 to 2014 |
|---|---|---|
| Males | 30.2% (CI: 26.6% to 34.1%) | 32.1% (CI: 27.8% to 36.8%) |
| Females | 12.5% (CI: 10.2% to 15.3%) | 13.6% (CI: 10.9% to 16.8%) |
Heavy drinking by age group
Key findings
- Between 2011 and 2014, survey results indicated that the prevalence rate of heavy drinking was higher in the 19 to 29 year age group in Sudbury and districts than in other age groups.
- Reported rates of heavy drinking did not vary significantly in any age group between 2007 to 2010 and 2011 to 2014.
Notes:
- Starting in 2013, the definition of heavy drinking among females was lowered from 5 or more servings to 4 or more servings on one occasion at least once per month for the past year. This definition has resulted in an increase in the rate of reported heavy drinking among females, and thus also overall, in 2013/14.
- Rates are age-standardized using the 2011 Canadian population.
- Rates are for the population aged 12 years and older.
- Data source: Canadian Community Health Survey (CCHS), 2007 to 2014, Statistics Canada, Share File, Ontario Ministry of Health and Long-Term Care.
Figure: Prevalence rate, heavy drinking, by year and age group, ages 12+, 2007 to 2010 and 2011 to 2014
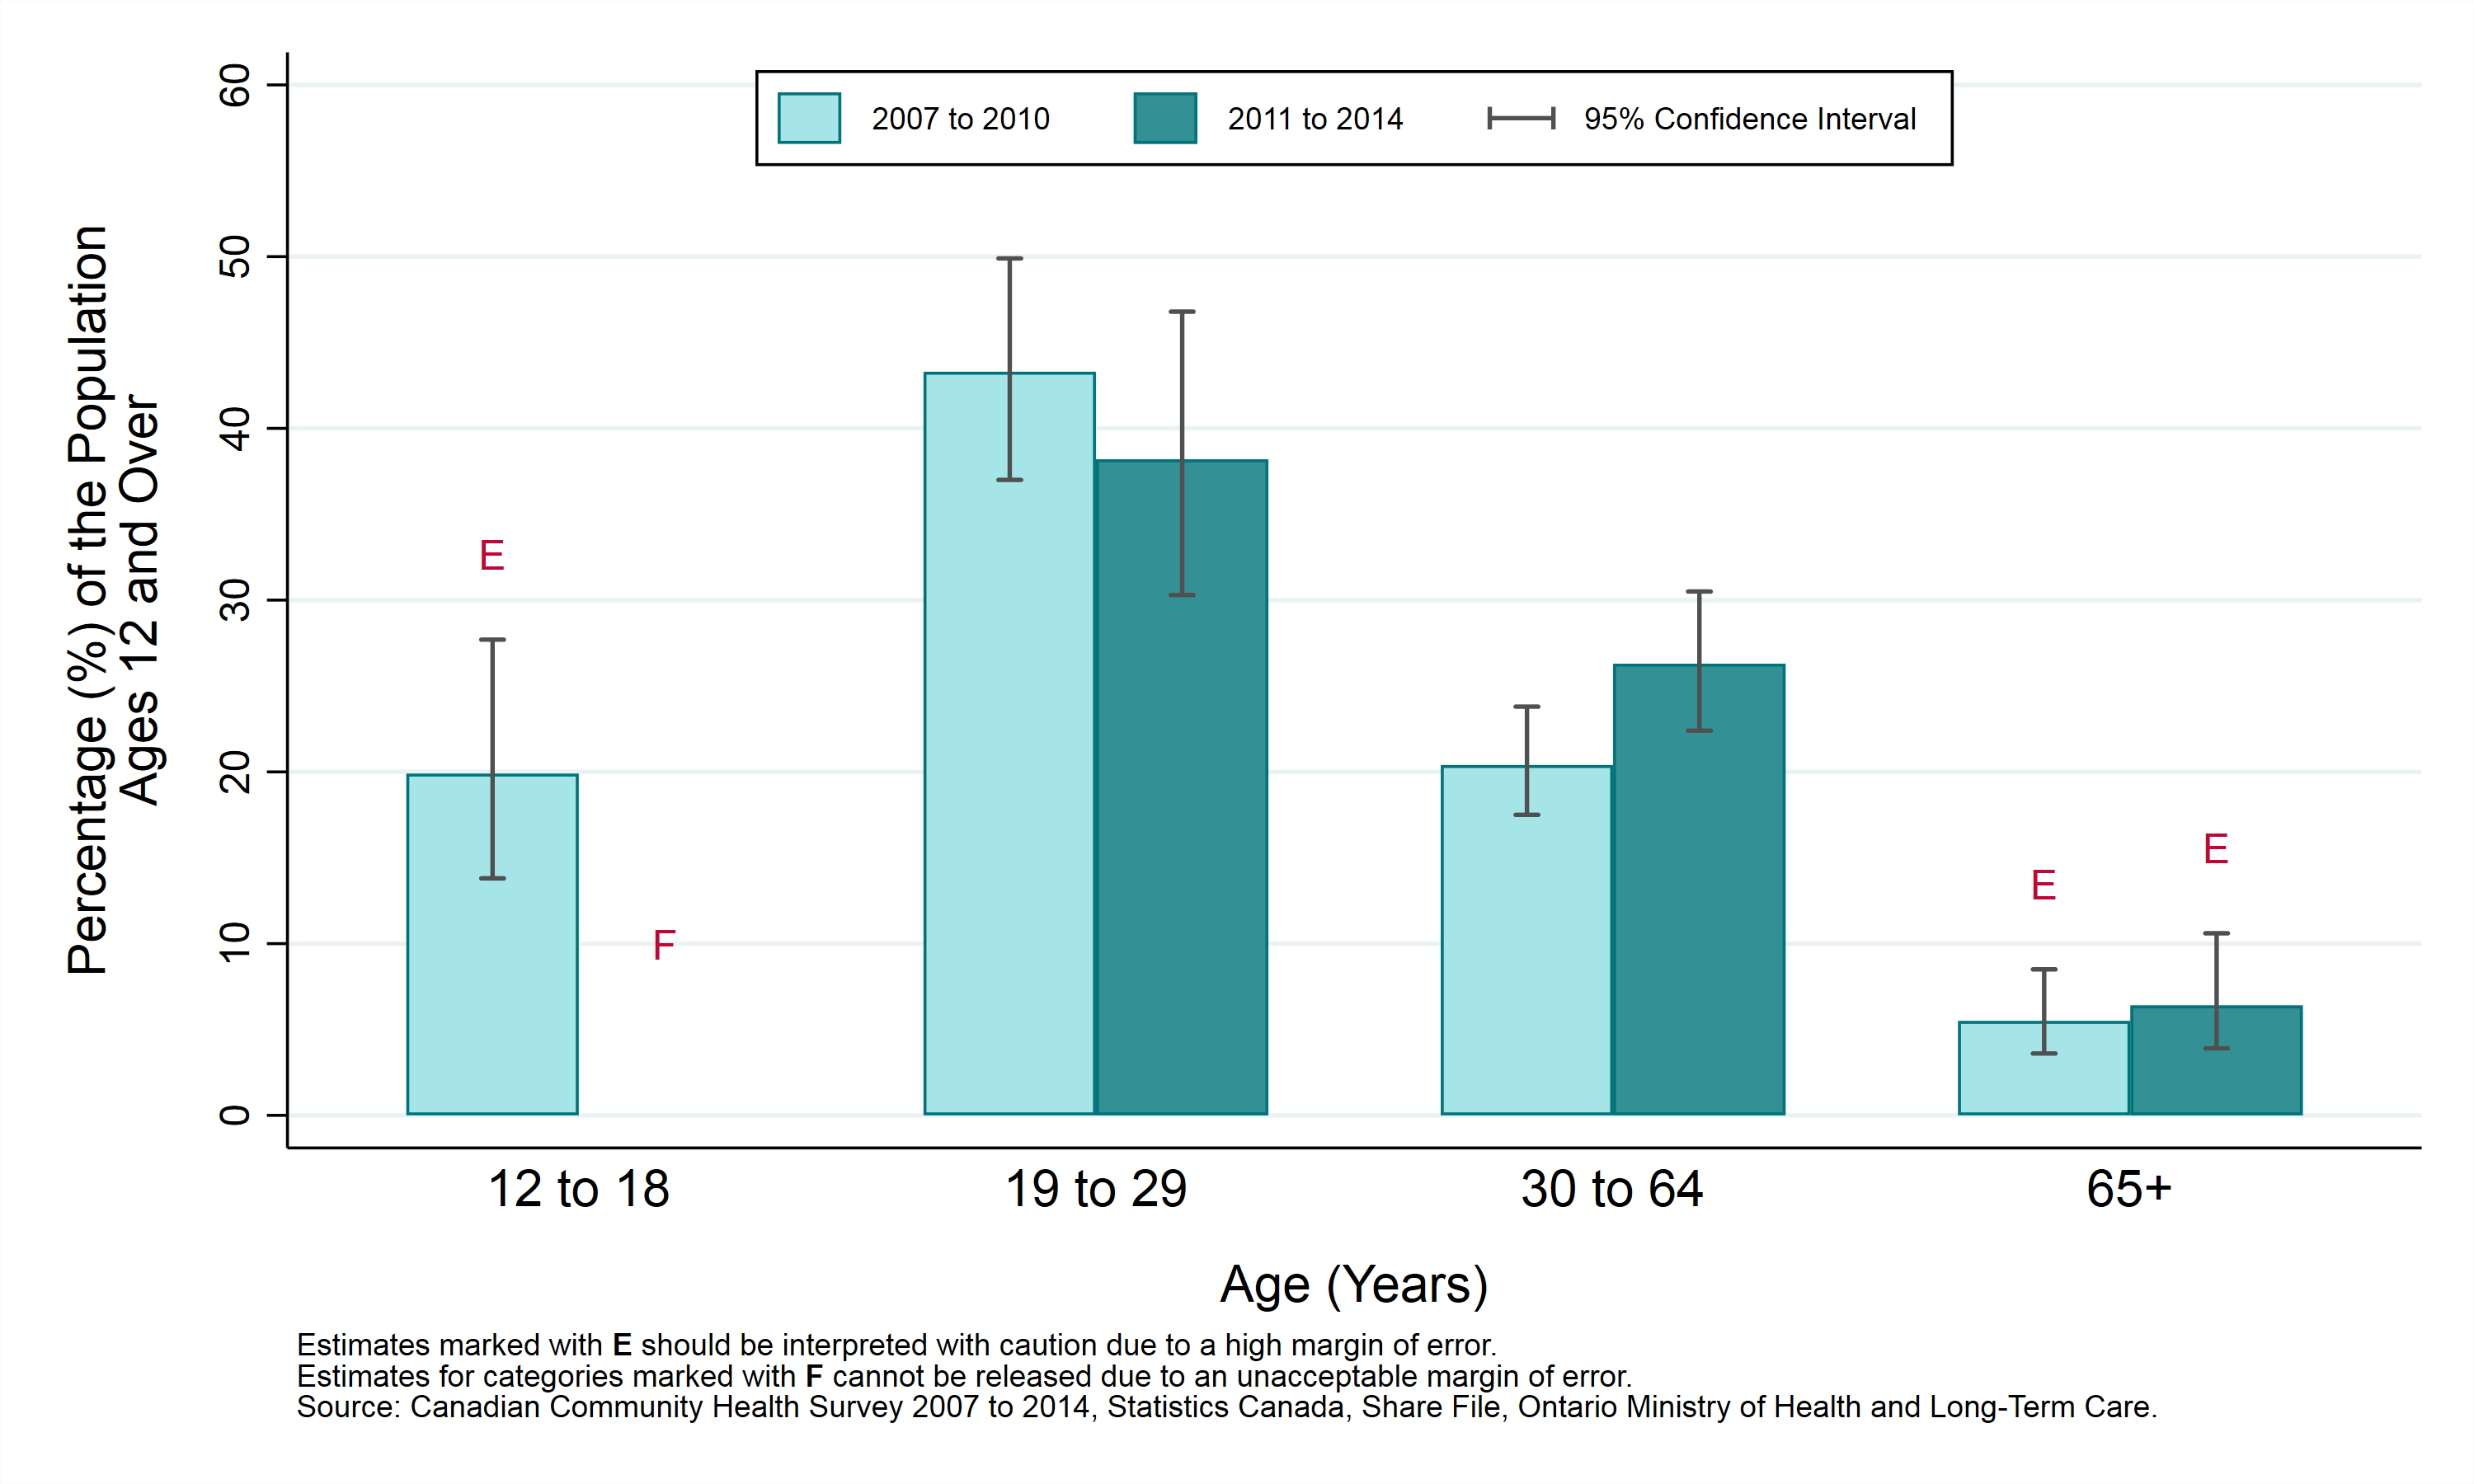
Table: Prevalence rate, heavy drinking, by year and age group, ages 12+, 2007 to 2010 and 2011 to 2014
Note: Numbers followed by the letter “E” are to be interpreted with caution due to high sampling variability.
The letter “F” is to be interpreted as an estimate which has been suppressed due to high sampling variability.
| Age (Years) | Prevalence Rate, 2007 to 2010 | Prevalence Rate, 2011 to 2014 |
|---|---|---|
| 12 to 18 | 19.9% E (CI: 13.8% to 27.7%) | F |
| 19 to 29 | 43.3% (CI: 37.0% to 49.9%) | 38.2% (CI: 30.3% to 46.8%) |
| 30 to 64 | 20.4% (CI: 17.5% to 23.8%) | 26.3% (CI: 22.4% to 30.5%) |
| 65+ | 5.5% E (CI: 3.6% to 8.5%) | 6.4% E (CI: 3.9% to 10.6%) |
Heavy drinking by household income
Key findings:
- Between 2011 and 2014, survey results indicated that the prevalence rate of heavy drinking did not vary significantly between household income quintiles in Sudbury and districts.
- Between 2007 to 2010 and 2011 to 2014, the rate of heavy drinking in Sudbury and districts has not varied significantly in any of the household income quintiles.
Notes:
- Starting in 2013, the definition of heavy drinking among females was lowered from 5 or more servings to 4 or more servings on one occasion at least once per month for the past year. This definition has resulted in an increase in the rate of reported heavy drinking among females, and thus also overall, in 2013/14.
- In this analysis, individuals are divided into “income quintiles”, or 5 groups of roughly equal size based on their reported household income. The groups are ranked, so that Quintile 1 represents the 20% of the population with the lowest incomes, and Quintile 5 represents the 20% with the highest incomes.
- Rates are age-standardized using the 2011 Canadian population.
- Rates are for the population aged 12 years and older.
- Data source: Canadian Community Health Survey (CCHS), 2007 to 2014, Statistics Canada, Share File, Ontario Ministry of Health and Long-Term Care.
Figure: Age-standardized prevalence rate, heavy drinking, by year and household income, ages 12+, 2007 to 2010 and 2011 to 2014
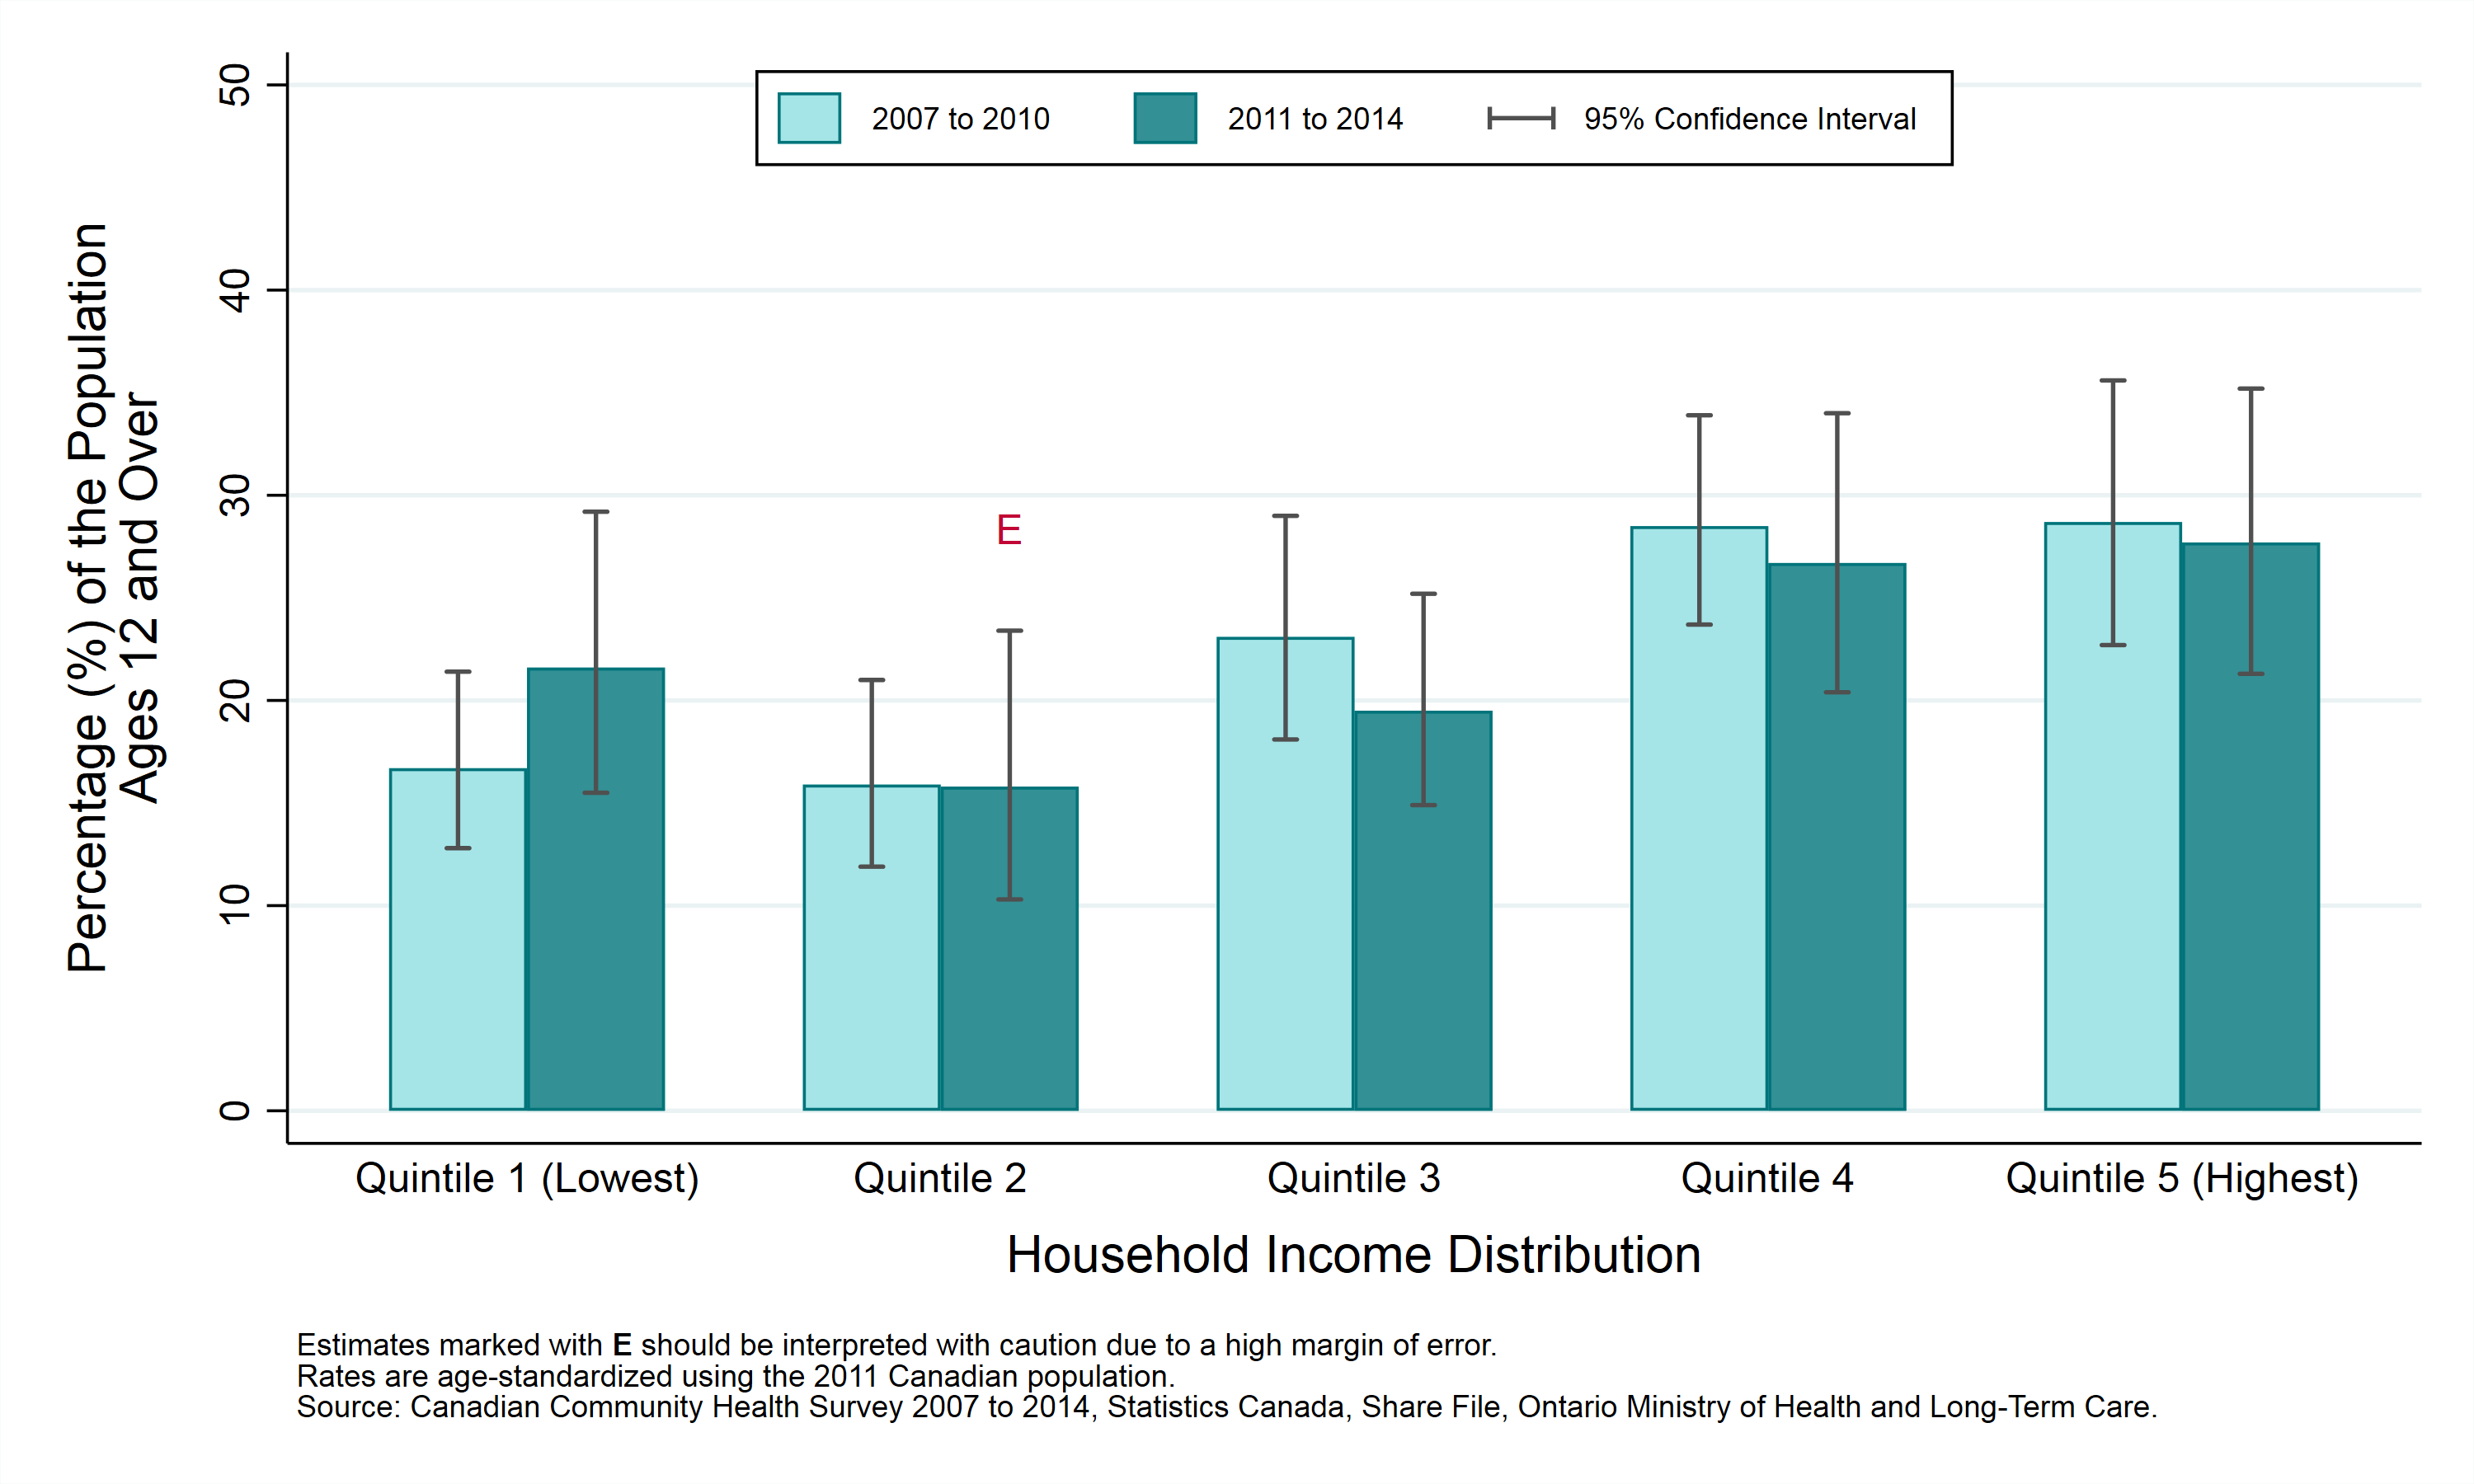
Table: Age-standardized prevalence rate, heavy drinking, by year and household income, ages 12+, 2007 to 2010 and 2011 to 2014
Note: Numbers followed by the letter “E” are to be interpreted with caution due to high sampling variability.
| Household Income Distribution | Prevalence Rate, 2007 to 2010 | Prevalence Rate, 2011 to 2014 |
|---|---|---|
| Quintile 1 (Lowest) | 16.7% (CI: 12.8% to 21.4%) | 21.6% (CI: 15.5% to 29.2%) |
| Quintile 2 | 15.9% (CI: 11.9% to 21.0%) | 15.8% E (CI: 10.3% to 23.4%) |
| Quintile 3 | 23.1% (CI: 18.1% to 29.0%) | 19.5% (CI: 14.9% to 25.2%) |
| Quintile 4 | 28.5% (CI: 23.7% to 33.9%) | 26.7% (CI: 20.4% to 34.0%) |
| Quintile 5 (Highest) | 28.7% (CI: 22.7% to 35.6%) | 27.7% (CI: 21.3% to 35.2%) |
Heavy drinking by education
Key findings:
- Between 2011 and 2014, survey results indicated that the prevalence rate of heavy drinking was similar among different education levels in Sudbury and districts.
- Between 2007 to 2010 and 2011 to 2014, the rate of heavy drinking in Sudbury and districts has not varied significantly in any of the education level groups.
Notes:
- Starting in 2013, the definition of heavy drinking among females was lowered from 5 or more servings to 4 or more servings on one occasion at least once per month for the past year. This definition has resulted in an increase in the rate of reported heavy drinking among females, and thus also overall, in 2013/14.
- Rare age-standardized using the 2011 Canadian population.
- Rates are for the population aged 12 years and older.
- Data source: Canadian Community Health Survey (CCHS), 2007 to 2014, Statistics Canada, Share File, Ontario Ministry of Health and Long-Term Care.
Figure: Age-standardized prevalence rate, heavy drinking, by year and education levels, ages 12+, 2007 to 2010 and 2011 to 2014
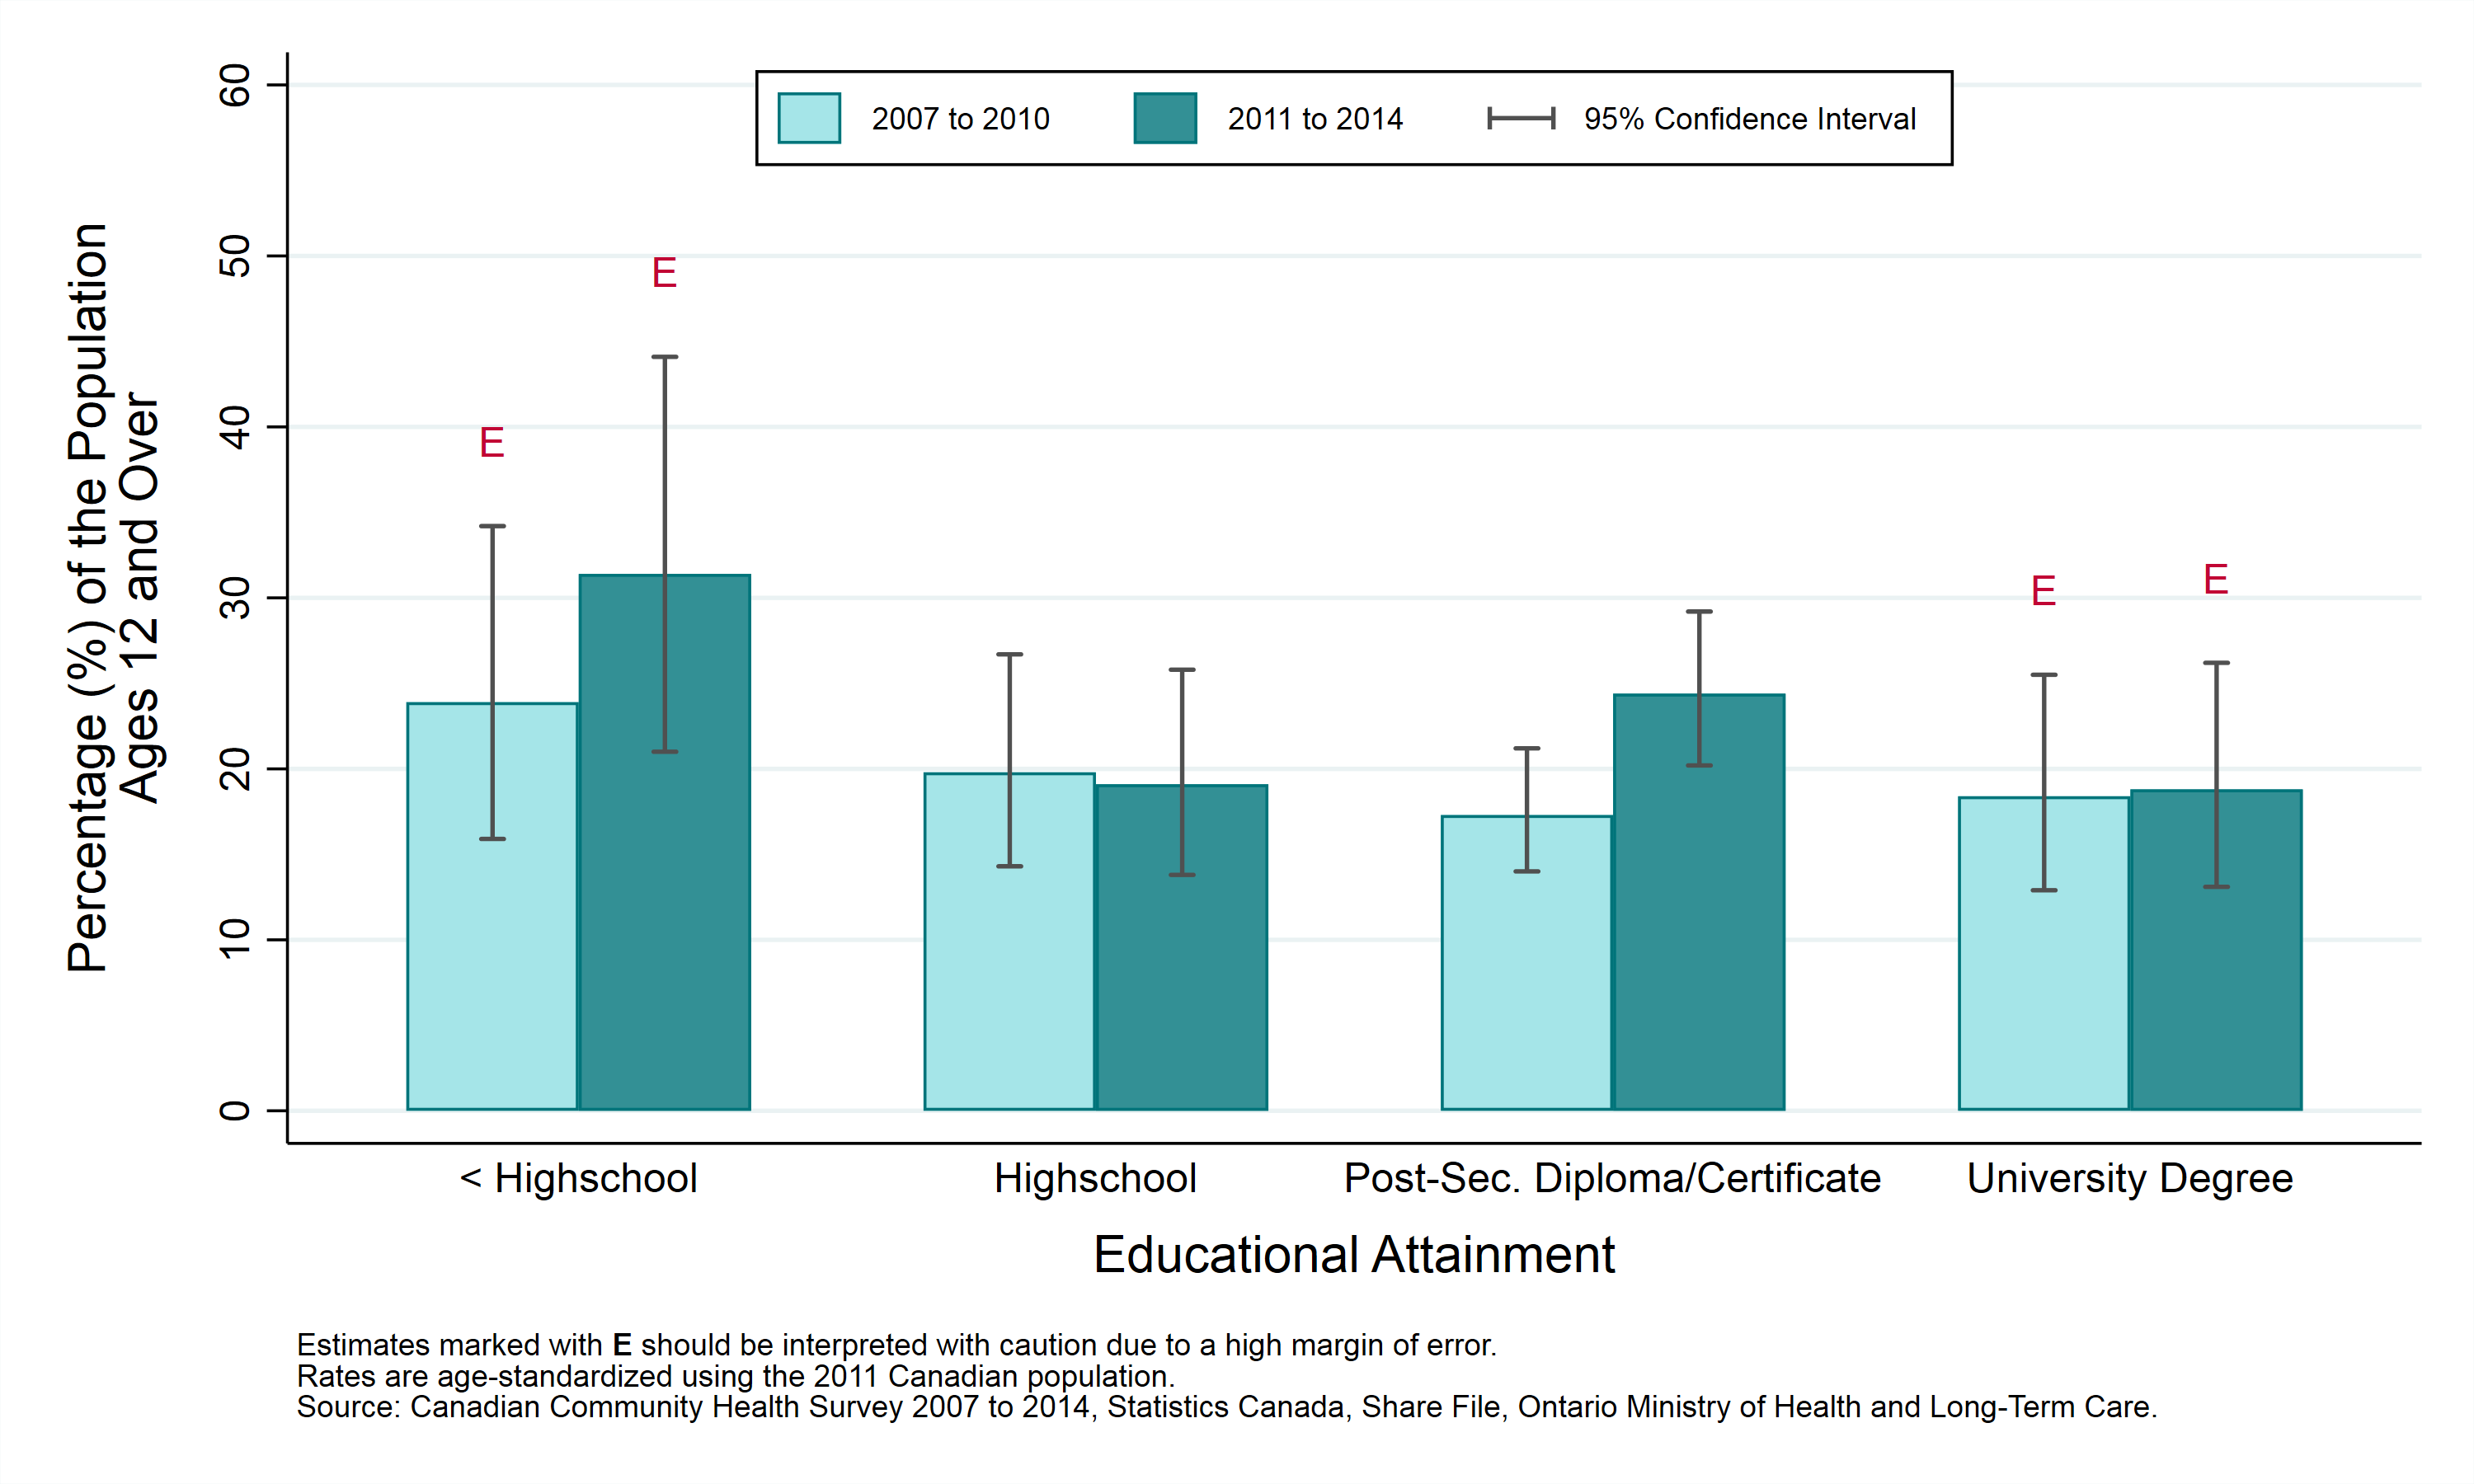
Table: Age-standardized prevalence rate, heavy drinking, by year and education, ages 12+, 2007 to 2010 and 2011 to 2014
Note: Numbers followed by the letter “E” are to be interpreted with caution due to high sampling variability.
| Education | Prevalence Rate, 2007 to 2010 | Prevalence Rate, 2011 to 2014 |
|---|---|---|
| < Highschool Diploma | 23.9% E (CI: 15.9% to 34.2%) | 31.4% E (CI: 21.0% to 44.1%) |
| Highschool Diploma | 19.8% (CI: 14.3% to 26.7%) | 19.1% (CI: 13.8% to 25.8%) |
| Trade, College or University Diploma or Certificate | 17.3% (CI: 14.0% to 21.2%) | 24.4% (CI: 20.2% to 29.2%) |
| University Degree | 18.4% E (CI: 12.9% to 25.5%) | 18.8% E (CI: 13.1% to 26.2%) |
Heavy drinking by first official language spoken
Key findings:
- Between 2011 and 2014, survey results indicated that the prevalence rate of heavy drinking was similar among both official language groups in Sudbury and districts.
- Between 2007 to 2010 and 2011 to 2014, the rate of heavy drinking in Sudbury and districts has not varied significantly in either official language group.
Notes:
- Starting in 2013, the definition of heavy drinking among females was lowered from 5 or more servings to 4 or more servings on one occasion at least once per month for the past year. This definition has resulted in an increase in the rate of reported heavy drinking among females, and thus also overall, in 2013/14.
- Canada’s official languages are French and English. An individual’s “first official language spoken” is determined using their answers to a number of questions about the languages they speak. A small percentage of people are classified as having both French and English as their “first” official language spoken. Such individuals are included here as French. People speaking neither French nor English are excluded from this analysis.
- Rates are age-standardized using the 2011 Canadian population.
- Rates are for the population aged 12 years and older.
- Data source: Canadian Community Health Survey (CCHS), 2007 to 2014, Statistics Canada, Share File, Ontario Ministry of Health and Long-Term Care.
Figure: Age-standardized prevalence rate, heavy drinking, by year and first official language spoken, ages 12+, 2007 to 2010 and 2011 to 2014
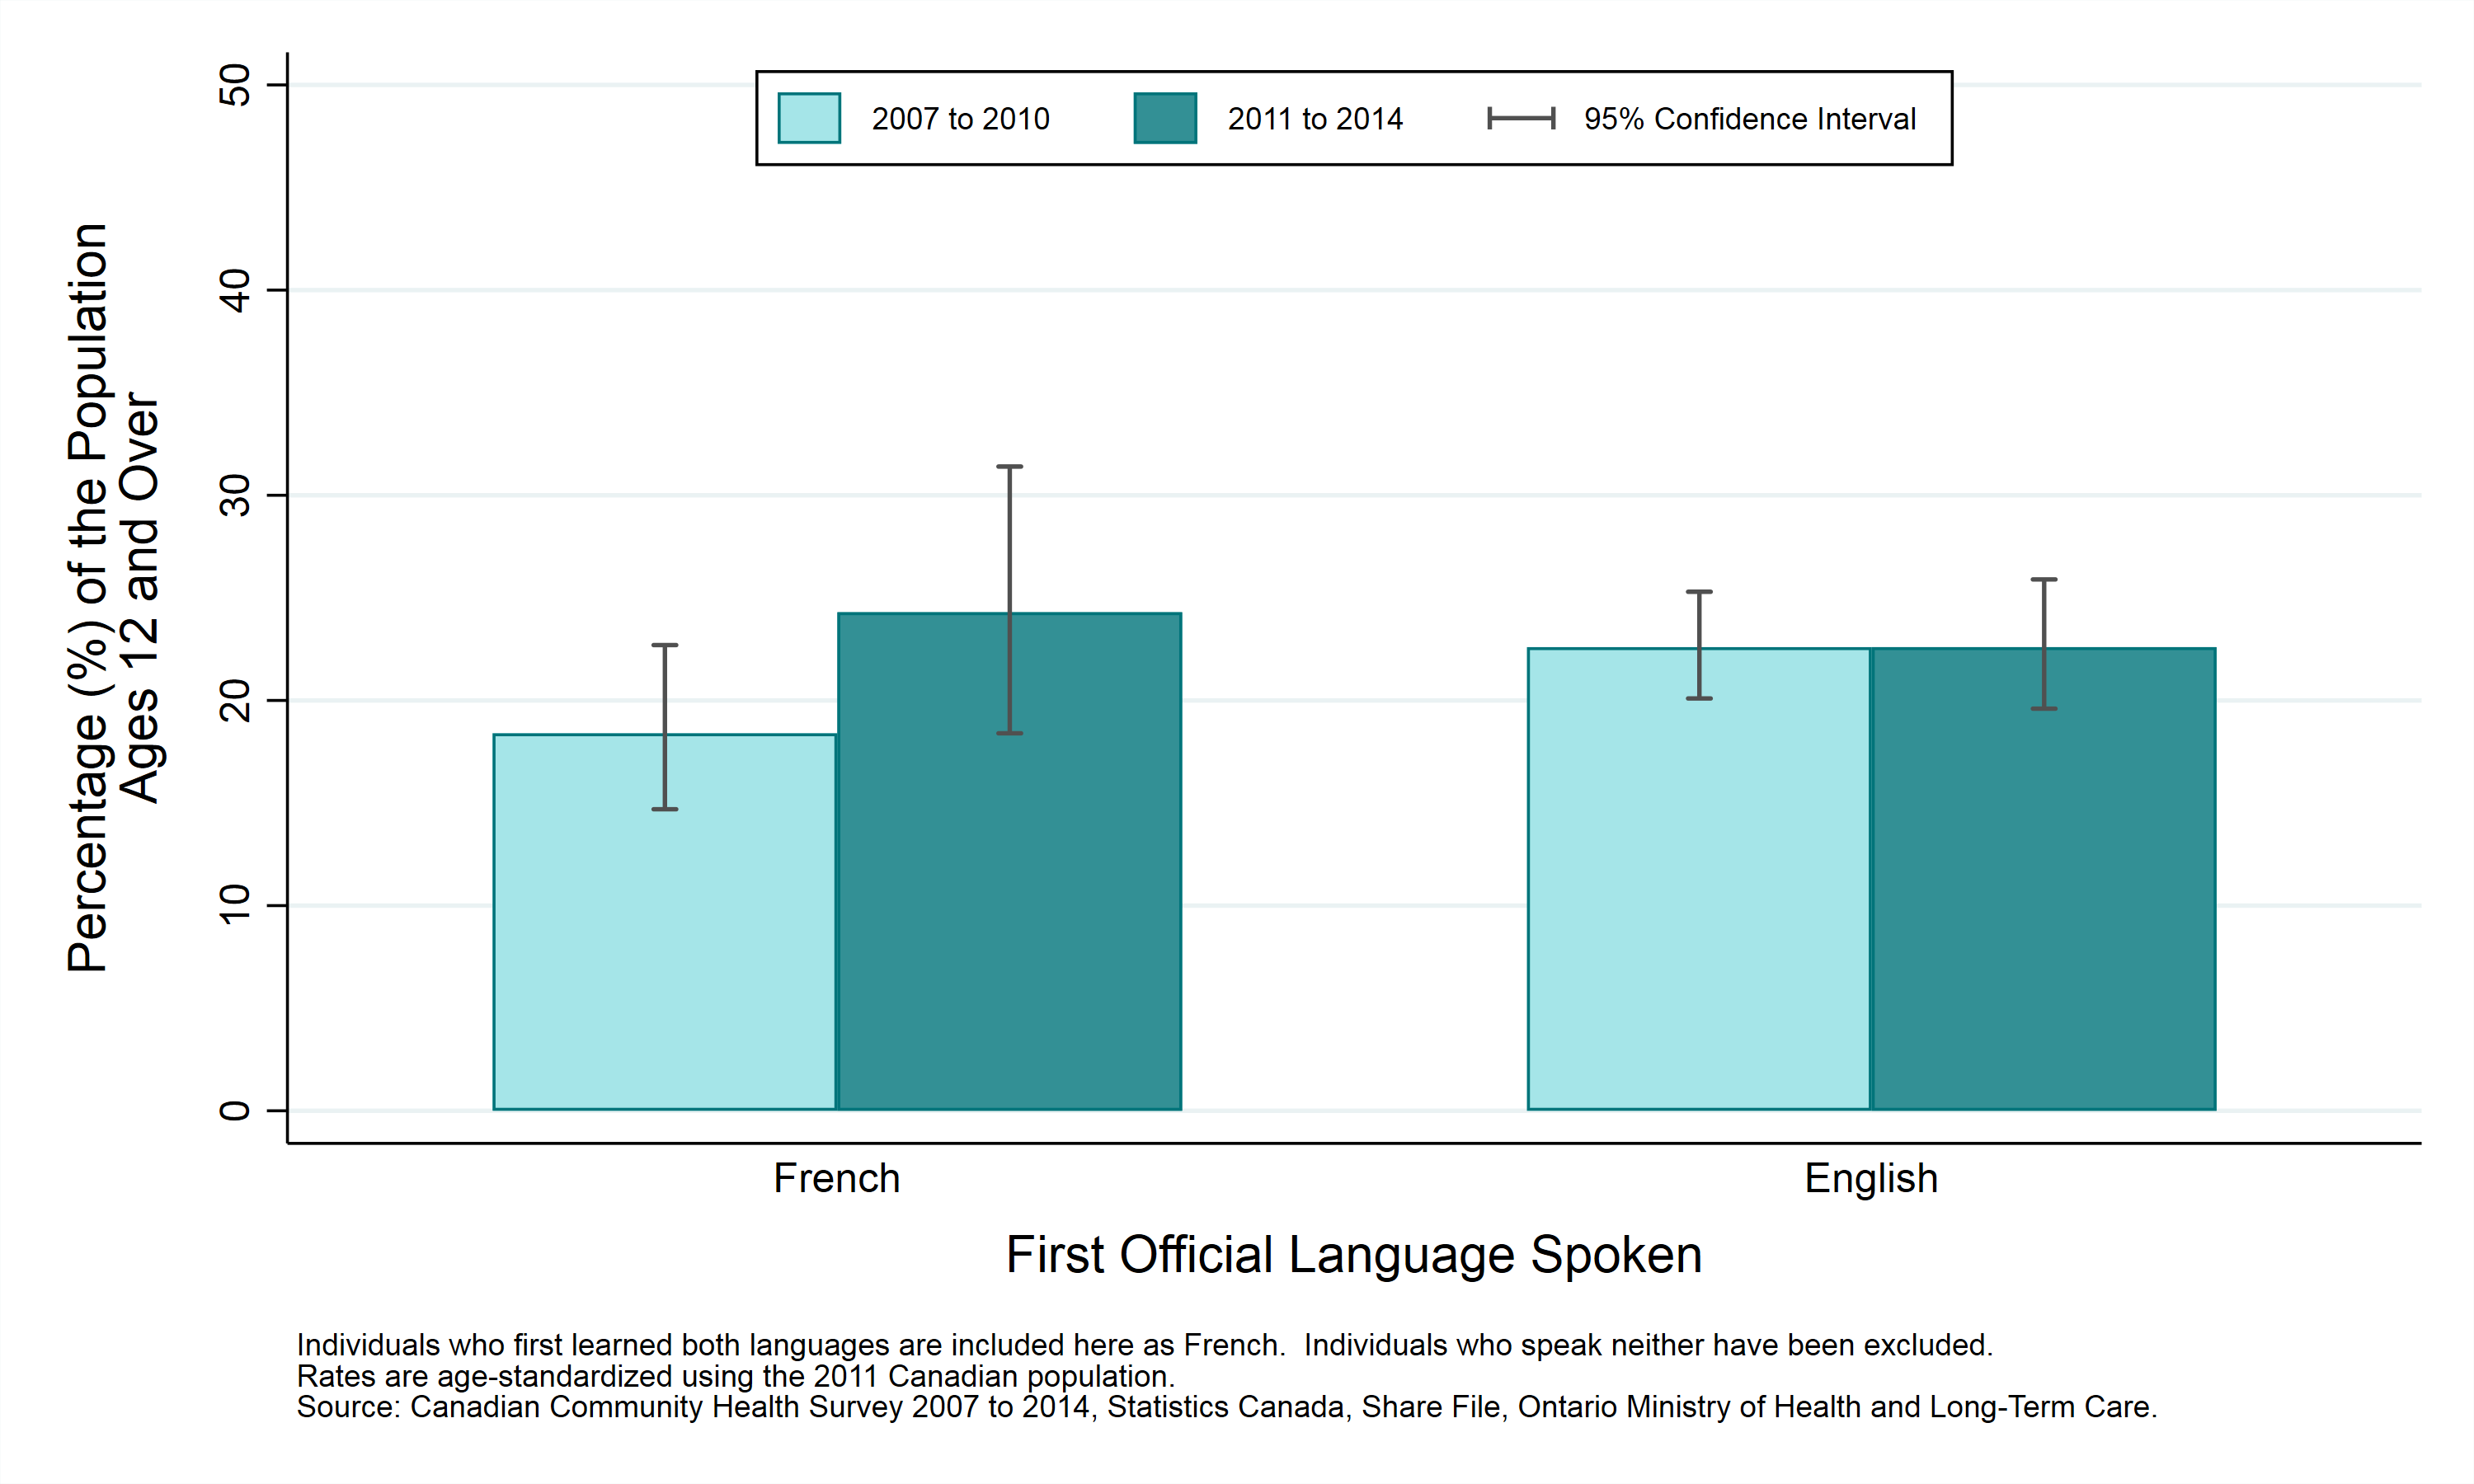
Table: Age-standardized prevalence rate, heavy drinking, by year and first official language spoken, ages 12+, 2007 to 2010 and 2011 to 2014
| First Official Language Spoken | Prevalence Rate, 2007 to 2010 | Prevalence Rate, 2011 to 2014 |
|---|---|---|
| French | 18.4% (CI: 14.7% to 22.7%) | 24.3% (CI: 18.4% to 31.4%) |
| English | 22.6% (CI: 20.1% to 25.3%) | 22.6% (CI: 19.6% to 25.9%) |
This item was last modified on April 12, 2024