Youth alcohol consumption
In this section, we present rates of reported alcohol use in the previous 12 months among youth aged 12 to 18 years.
Youth alcohol consumption by geographic area
Key findings:
- In 2013/14, survey results indicated that 54% of youth aged 12 to 18 years in Sudbury and districts reported consuming alcohol in the previous year.
- The prevalence rate of alcohol use in youth in Sudbury and districts has consistently been similar to that reported in northeastern Ontario, but higher than Ontario overall.
- Between 2007/08 and 2013/14, the rate of alcohol use in youth in Sudbury and districts has not varied significantly.
Notes:
- Rates are for the population aged 12-18 years.
- Data source: Canadian Community Health Survey (CCHS), 2007 to 2014, Statistics Canada, Share File, Ontario Ministry of Health and Long-Term Care.
Figure: Prevalence rate, alcohol use, by year and geographic area, ages 12-18, 2007/08 to 2013/14
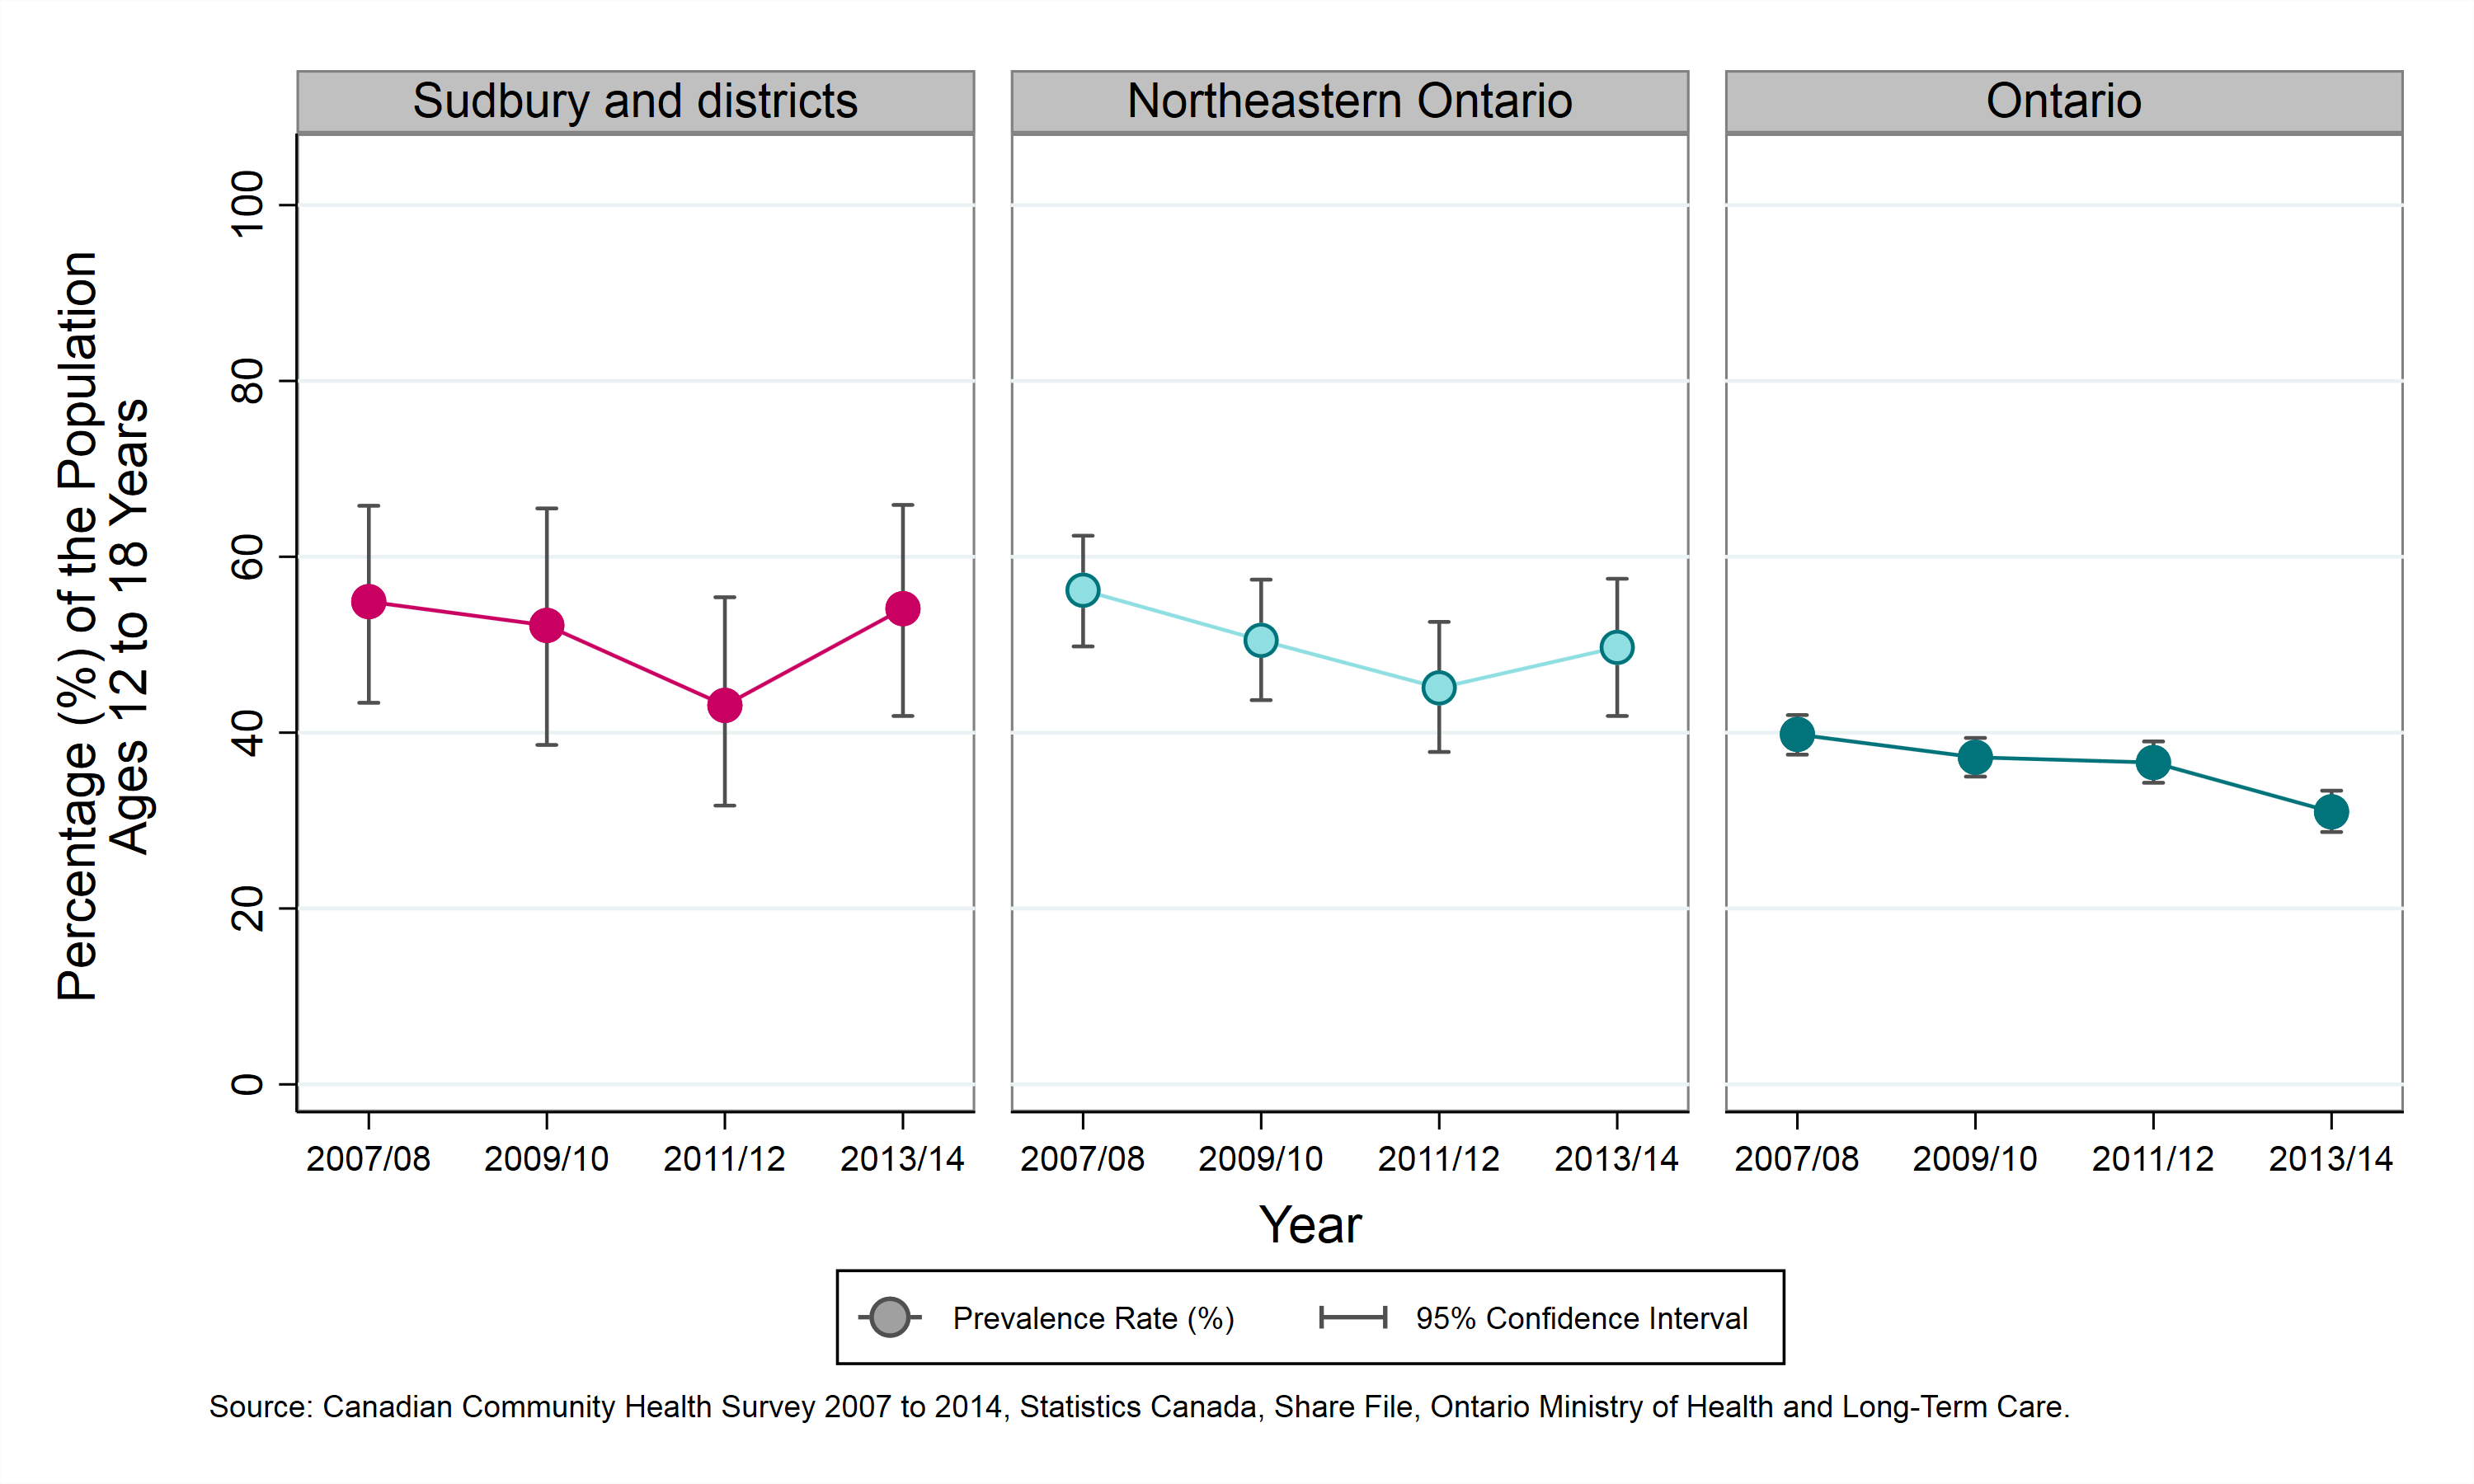
Table: Prevalence rate, alcohol use, by year and geographic area, ages 12-18, 2007/08 to 2013/14
| Geographic Region | Prevalence Rate, 2007 to 2008 | Prevalence Rate, 2009 to 2010 | Prevalence Rate, 2011 to 2012 | Prevalence Rate, 2013 to 2014 |
|---|---|---|---|---|
| Sudbury and districts | 54.9% (CI: 43.4% to 65.8%) | 52.2% (CI: 38.6% to 65.5%) | 43.1% (CI: 31.7% to 55.4%) | 54.1% (CI: 41.9% to 65.9%) |
| Northeastern Ontario | 56.2% (CI: 49.8% to 62.4%) | 50.5% (CI: 43.7% to 57.4%) | 45.1% (CI: 37.8% to 52.6%) | 49.7% (CI: 41.9% to 57.5%) |
| Ontario | 39.8% (CI: 37.5% to 42.0%) | 37.2% (CI: 35.0% to 39.4%) | 36.6% (CI: 34.3% to 39.0%) | 31.0% (CI: 28.7% to 33.4%) |
Youth alcohol consumption by sex
Key findings:
- Between 2011 and 2014, survey results indicated that there was no statistical difference among males and females in the rate of youth aged 12 to 18 consuming alcohol in the previous year in Sudbury and districts.
- Between 2007 to 2010 and 2011 to 2014, the rate of youth alcohol consumption in Sudbury and districts has not varied significantly in either males or females.
Notes:
- Rates are for the population aged 12-18 years.
- Data source: Canadian Community Health Survey (CCHS), 2007 to 2014, Statistics Canada, Share File, Ontario Ministry of Health and Long-Term Care.
Figure: Prevalence rate, alcohol use, by year and sex, ages 12-18, 2007 to 2010 and 2011 to 2014
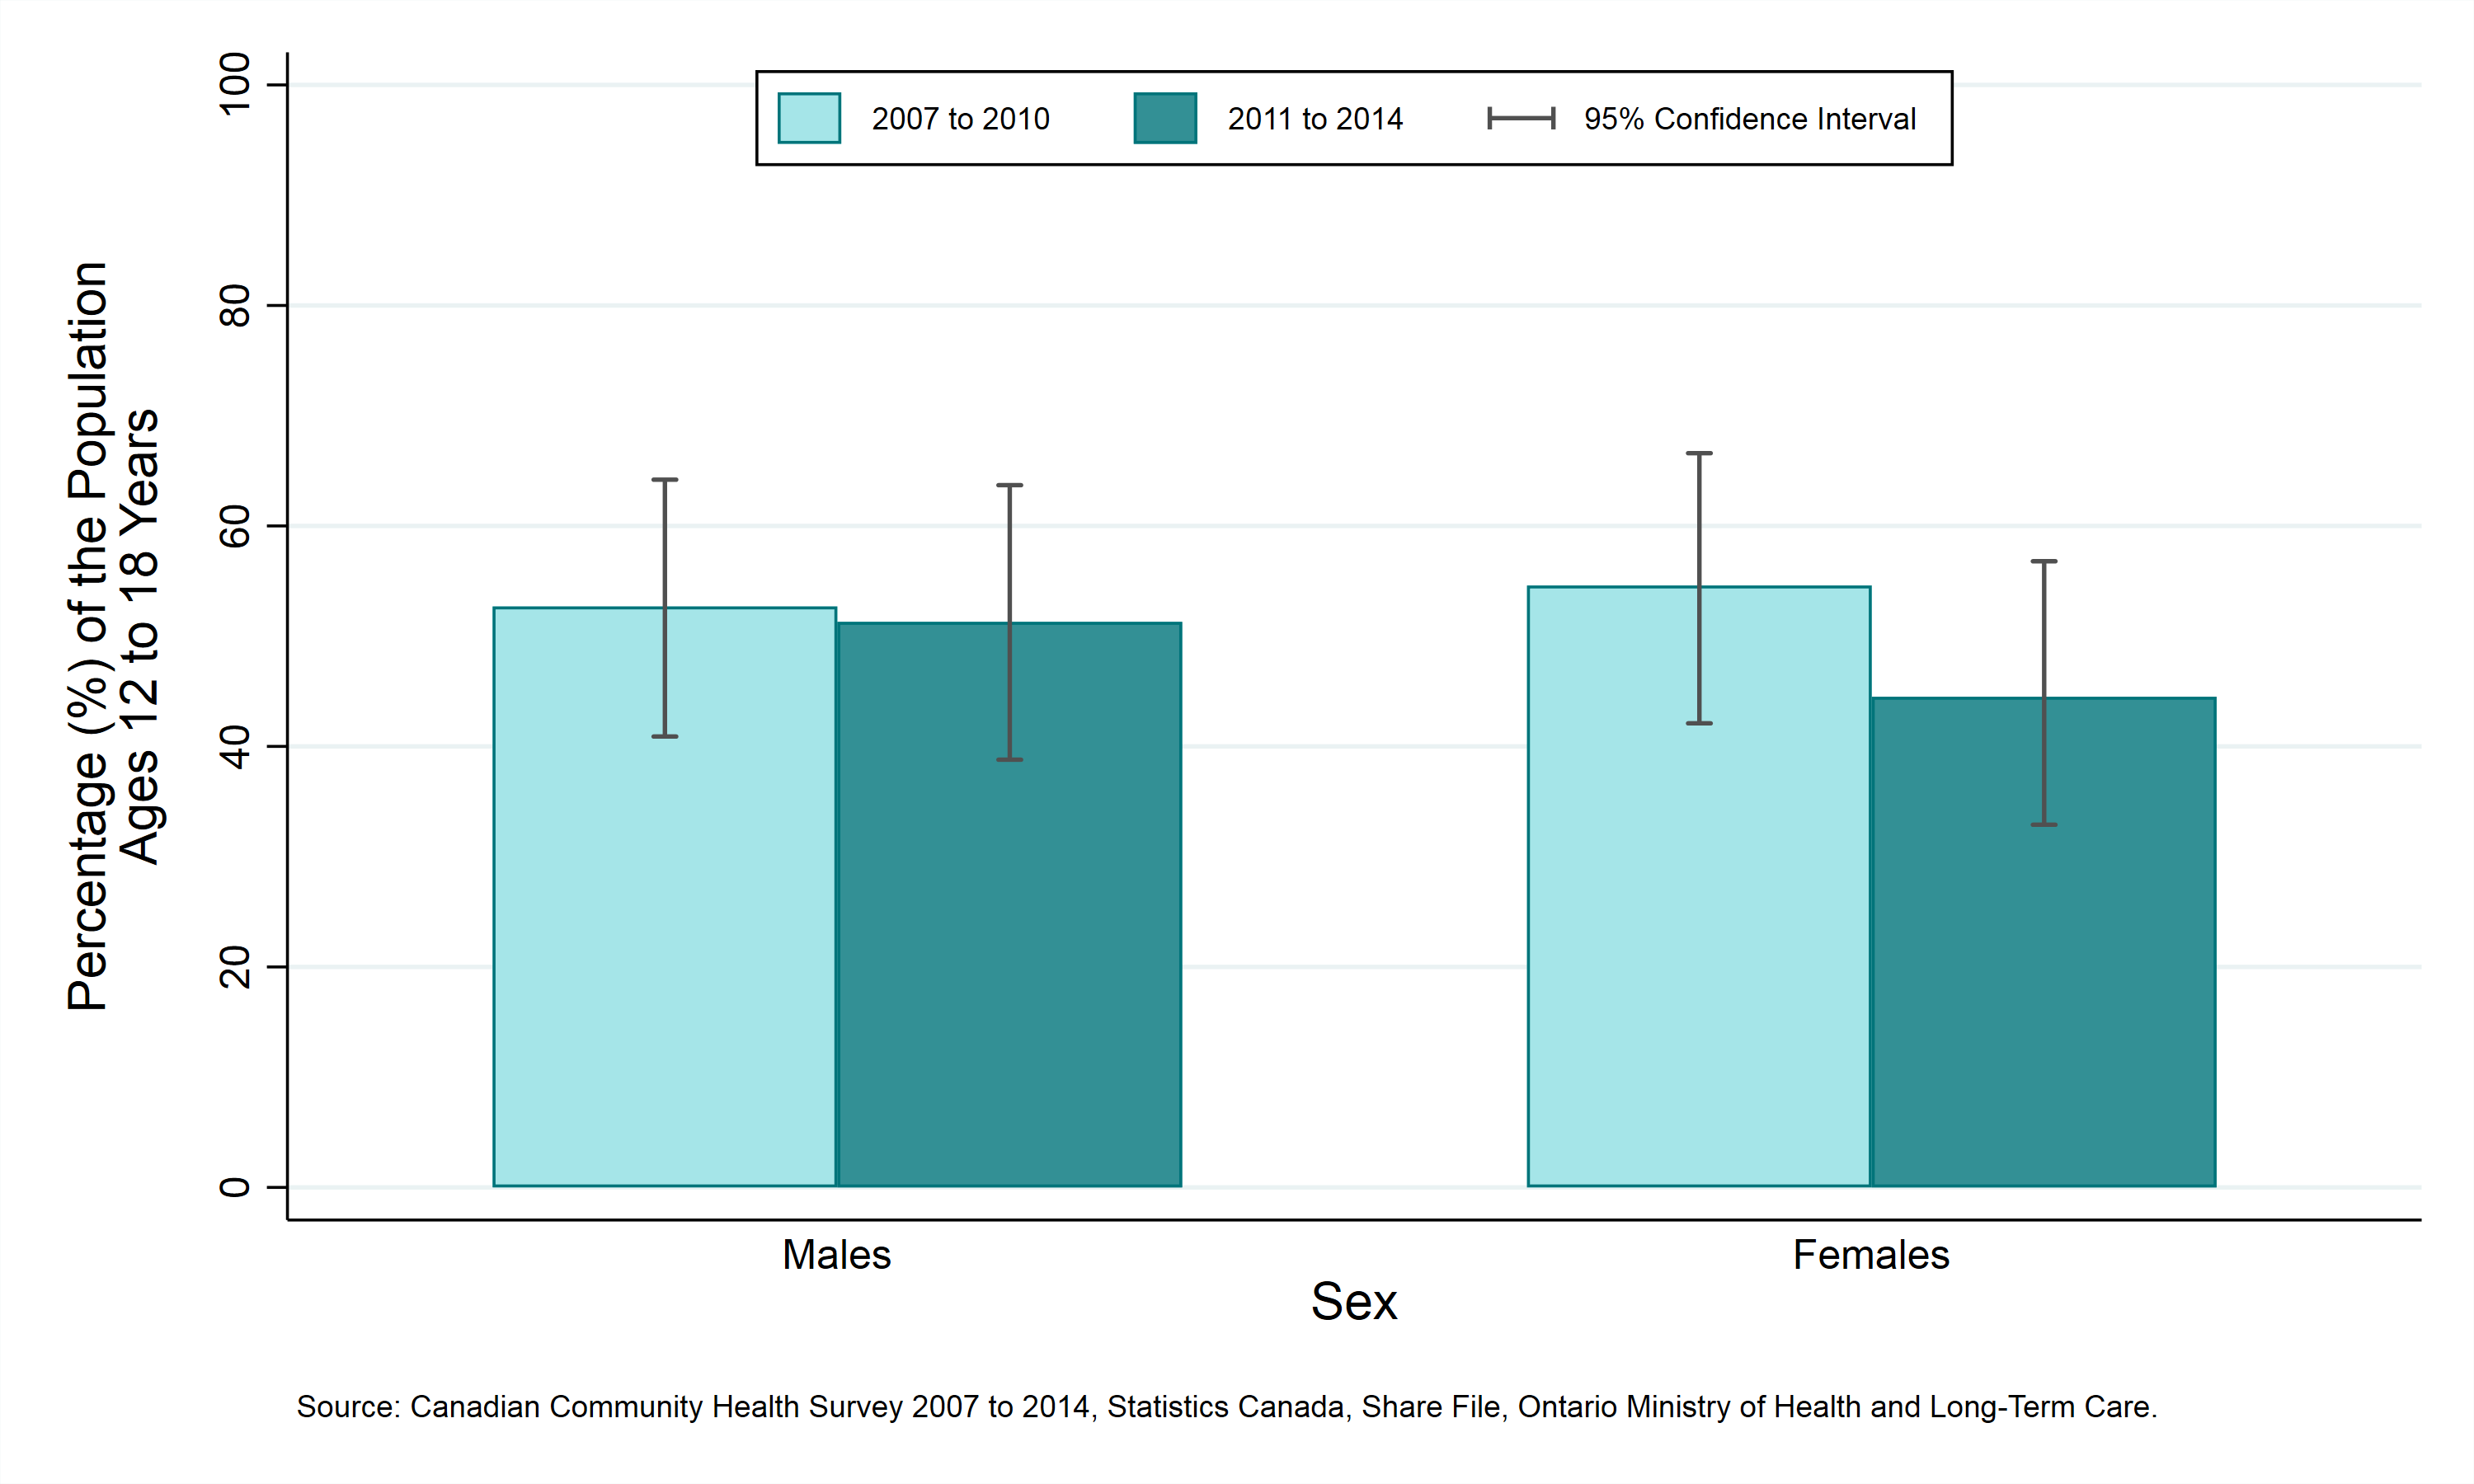
Table: Prevalence rate, alcohol use, by year and sex, ages 12-18, 2007 to 2010 and 2011 to 2014
| Sex | Prevalence Rate, 2007 to 2010 | Prevalence Rate, 2011 to 2014 |
|---|---|---|
| Males | 52.7% (CI: 40.9% to 64.2%) | 51.3% (CI: 38.8% to 63.7%) |
| Females | 54.6% (CI: 42.1% to 66.6%) | 44.5% (CI: 32.9% to 56.8%) |
Youth alcohol consumption by household income
Key findings:
- Between 2011 and 2014, survey results indicated that there were no statistical differences among household income quintiles in the rate of youth aged 12 to 18 consuming alcohol in the previous year.
- Between 2007 to 2010 and 2011 to 2014, the rate of youth alcohol consumption in Sudbury and districts has not varied significantly in any of the household income quintiles.
Notes:
- In this analysis, individuals are divided into “income quintiles”, or 5 groups of roughly equal size based on their reported household income. The groups are ranked, so that Quintile 1 represents the 20% of the population with the lowest incomes, and Quintile 5 represents the 20% with the highest incomes.
- Rates are for the population aged 12-18 years.
- Data source: Canadian Community Health Survey (CCHS), 2007 to 2014, Statistics Canada, Share File, Ontario Ministry of Health and Long-Term Care.
Figure: Prevalence rate, alcohol use, by year and household income, ages 12-18, 2007 to 2010 and 2011 to 2014
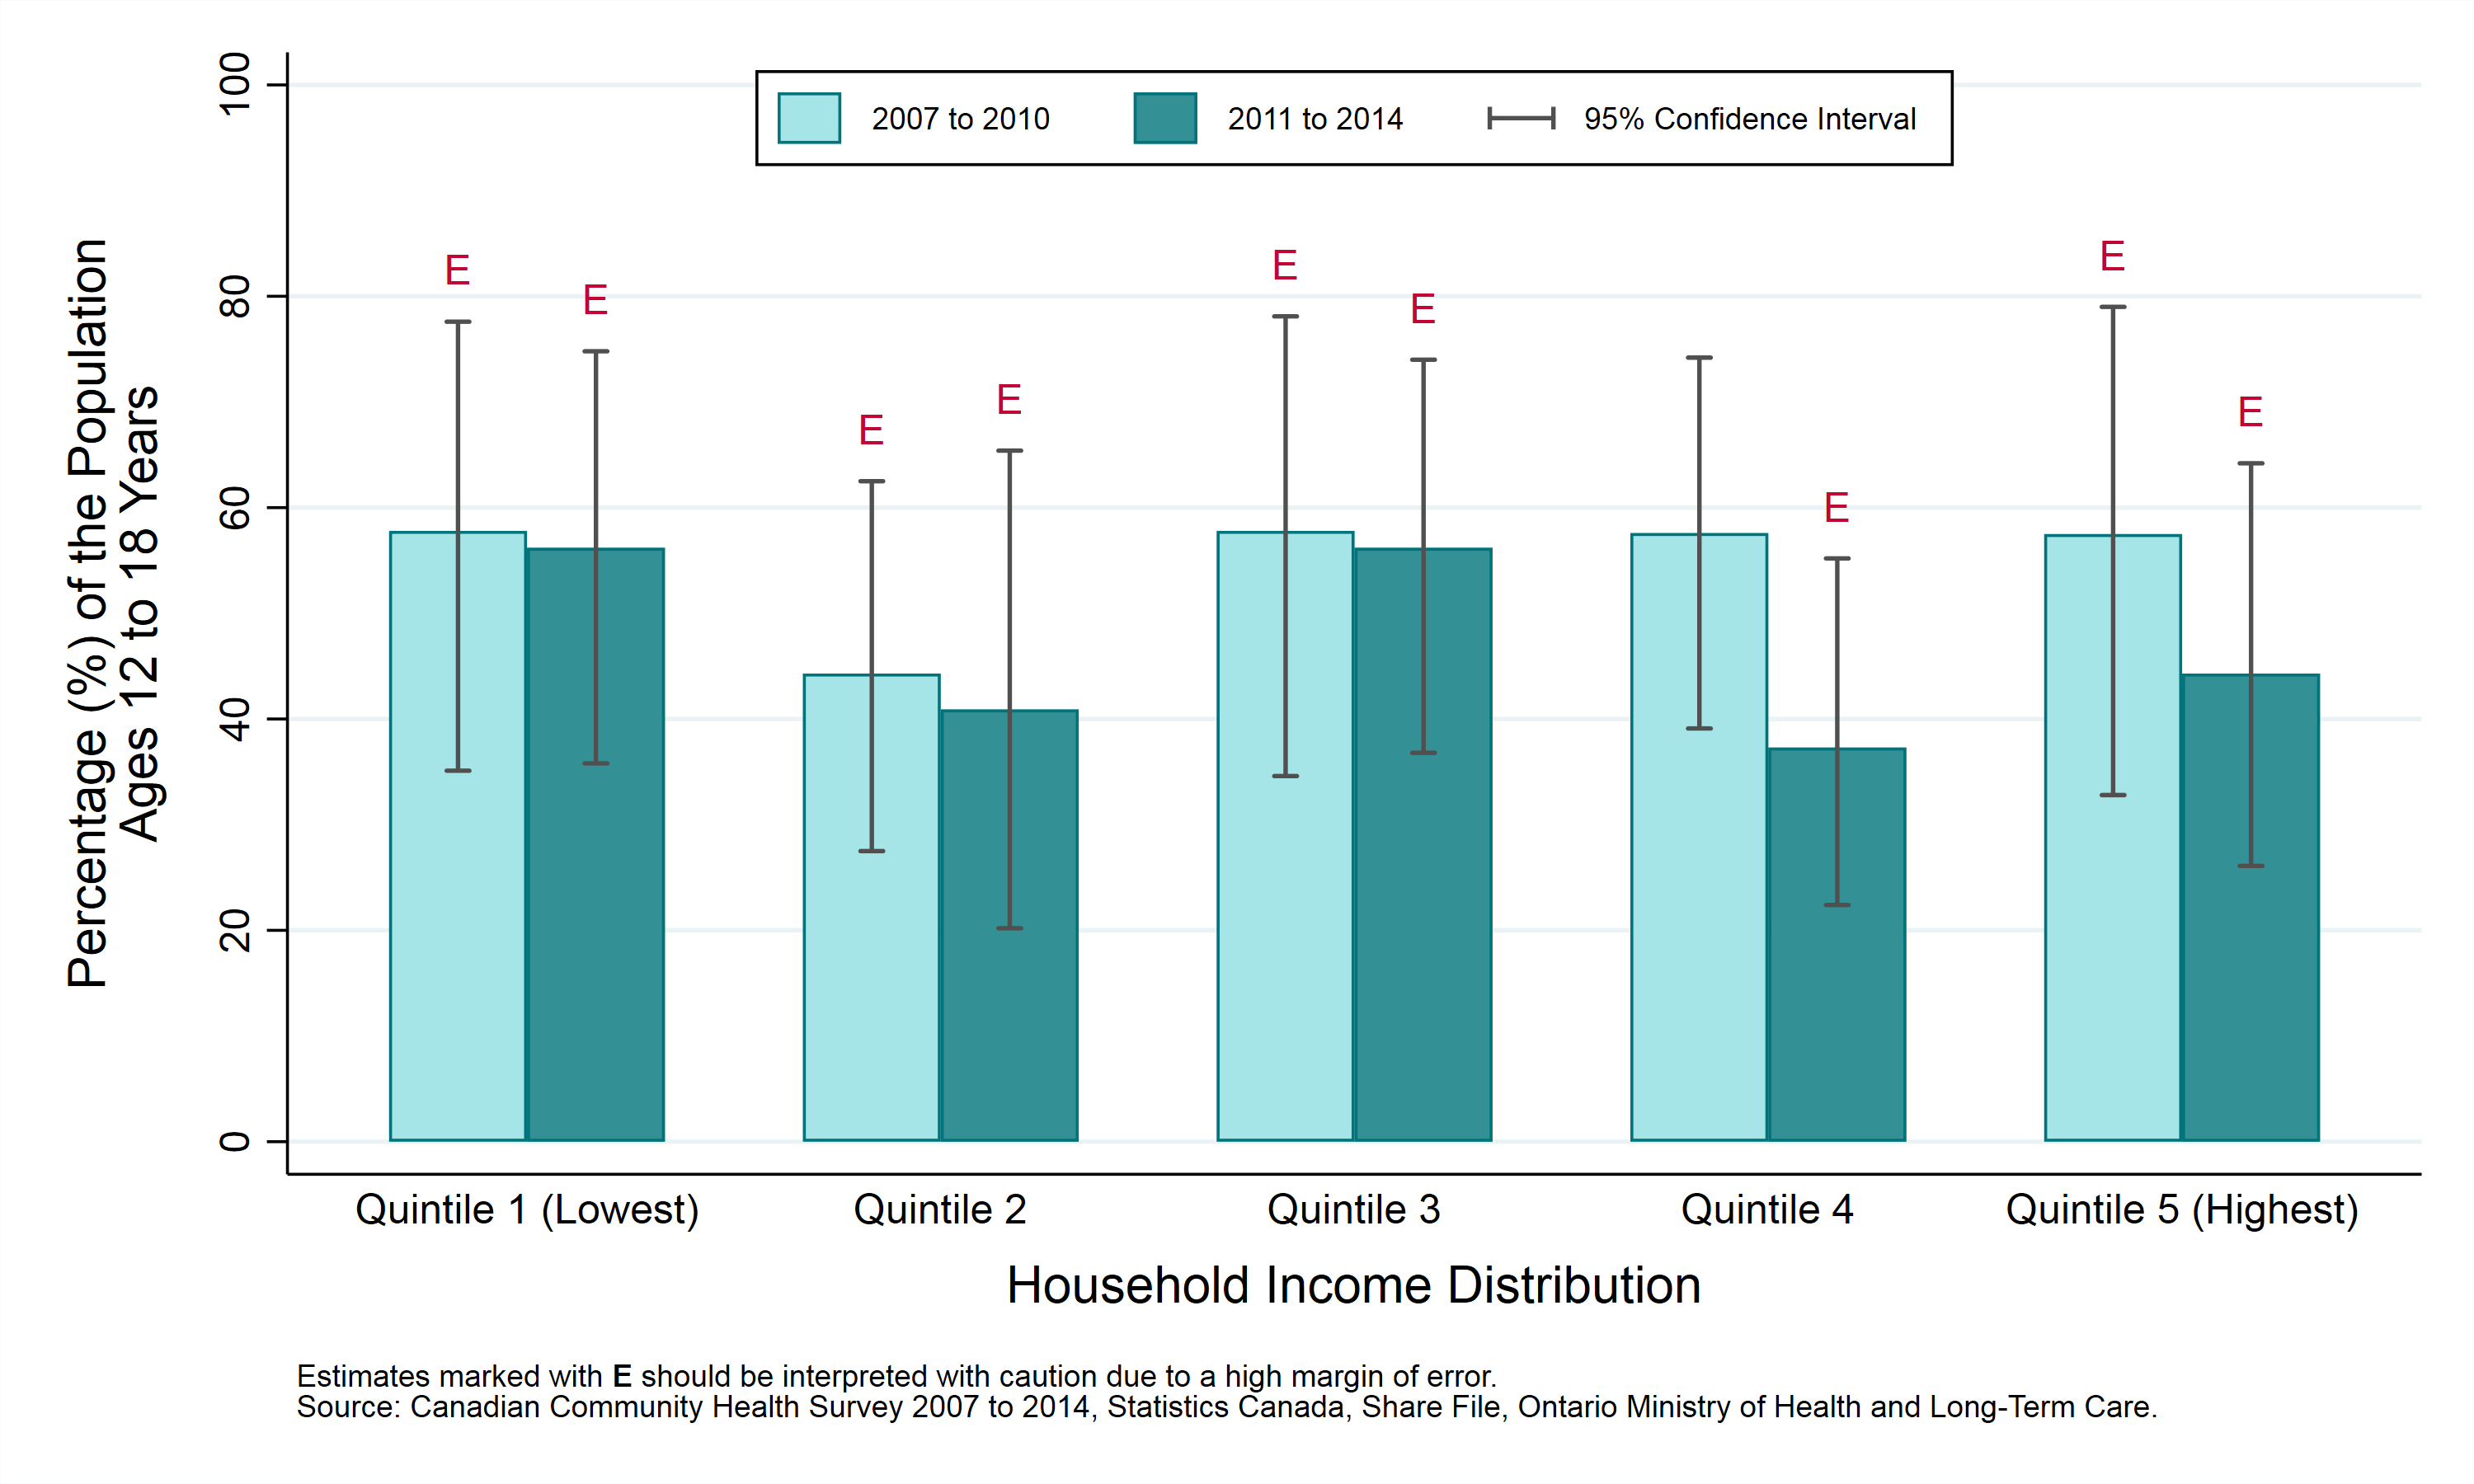
Table: Prevalence rate, alcohol use, by year and household income, ages 12-18, 2007 to 2010 and 2011 to 2014
Note: Numbers followed by the letter “E” are to be interpreted with caution due to high sampling variability.
| Household Income Distribution | Prevalence Rate, 2007 to 2010 | Prevalence Rate, 2011 to 2014 |
|---|---|---|
| Quintile 1 (Lowest) | 57.8% E (CI: 35.1% to 77.6%) | 56.2% E (CI: 35.8% to 74.8%) |
| Quintile 2 | 44.3% E (CI: 27.5% to 62.5%) | 40.9% E (CI: 20.2% to 65.4%) |
| Quintile 3 | 57.8% E (CI: 34.6% to 78.1%) | 56.2% E (CI: 36.8% to 74.0%) |
| Quintile 4 | 57.6% (CI: 39.1% to 74.2%) | 37.3% E (CI: 22.4% to 55.2%) |
| Quintile 5 (Highest) | 57.5% E (CI: 32.8% to 79.0%) | 44.3% E (CI: 26.1% to 64.2%) |
Youth alcohol consumption by first official language spoken
Key findings:
- Between 2011 and 2014, survey results indicated that youth alcohol consumption in the previous year was similar among both official language groups.
- Between 2007 to 2010 and 2011 to 2014, the rate of youth alcohol consumption in Sudbury and districts decreased significantly among youth aged 12 to 18 whose first official language included French. The rate among English youth aged 12 to 18 did not vary.
Notes:
- Canada’s official languages are French and English. An individual’s “first official language spoken” is determined using their answers to a number of questions about the languages they speak. A small percentage of people are classified as having both French and English as their “first” official language spoken. Such individuals are included here as French. People speaking neither French nor English are excluded from this analysis.
- Rates are for the population aged 12-18 years.
- Data source: Canadian Community Health Survey (CCHS), 2007 to 2014, Statistics Canada, Share File, Ontario Ministry of Health and Long-Term Care.
Figure: Prevalence rate, alcohol use, by year and first official language spoken, ages 12-18, 2007 to 2010 and 2011 to 2014
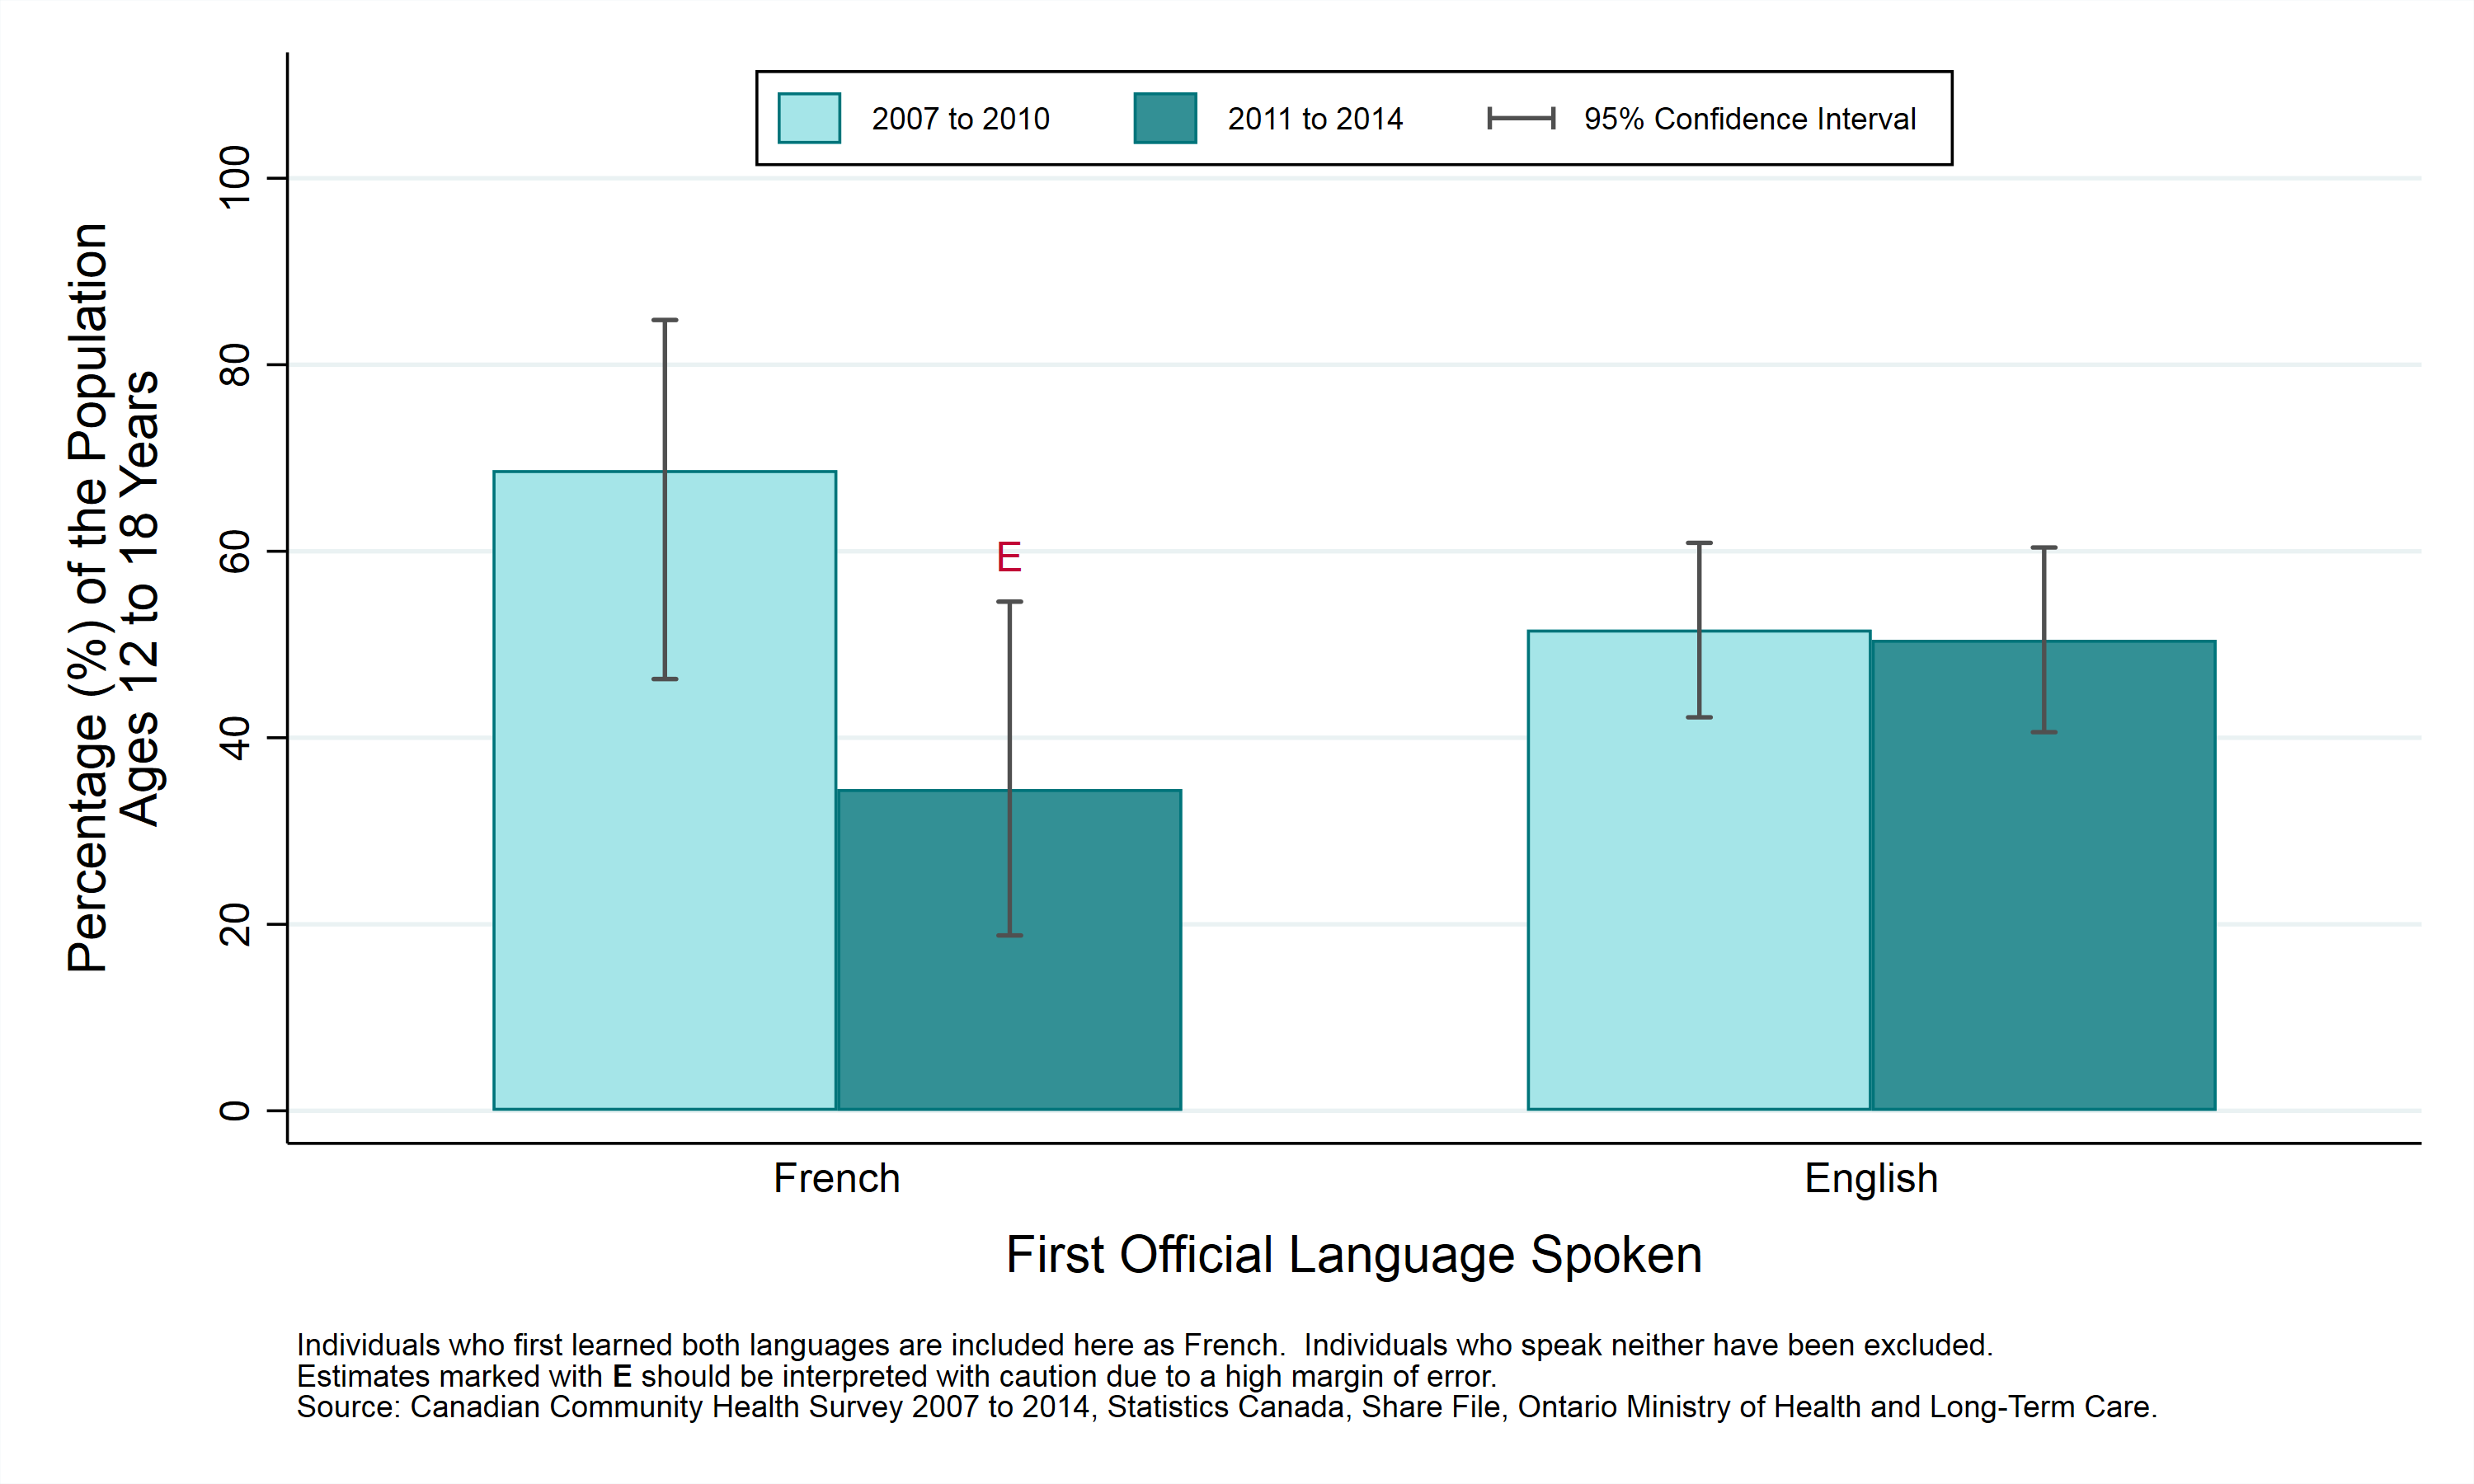
Table: Prevalence rate, alcohol use, by year and first official language spoken, ages 12-18, 2007 to 2010 and 2011 to 2014
Note: Numbers followed by the letter “E” are to be interpreted with caution due to high sampling variability.
| First Official Language Spoken | Prevalence Rate, 2007 to 2010 | Prevalence Rate, 2011 to 2014 |
|---|---|---|
| French | 68.7% (CI: 46.3% to 84.8%) | 34.5% E (CI: 18.8% to 54.6%) |
| English | 51.6% (CI: 42.2% to 60.9%) | 50.5% (CI: 40.6% to 60.4%) |
This item was last modified on August 8, 2018