Nutrition: Fruit and vegetable consumption
For each food group, Canada’s Food Guide (Health Canada) provides recommendations on the number of servings that Canadians should eat each day. Here, we present rates of individuals aged 12 and older who reported consuming at least the minimum number of recommended servings of fruits and vegetables for their age and sex, which are as follows:
- Children 12 to 13 years: 6 servings of fruits and vegetables daily
- Females 14+ years: 7 servings of fruits and vegetables daily
- Males 14 to 50 years: 8 servings of fruits and vegetables daily
- Males 51+ years: 7 servings of fruits and vegetables daily
Sections
Fruit and vegetable consumption by geographic area
Key findings:
- In 2013/14, survey results indicated that 13% of the Sudbury and districts population aged 12 and older were meeting the Canada Food Guide recommended intake of fruits and vegetables.
- The prevalence rate of the population meeting the recommended intake of fruits and vegetables in Sudbury and districts has consistently been similar to that reported in northeastern Ontario and Ontario overall.
- Between 2007/08 and 2013/14, the rate of the population meeting the recommended intake of fruits and vegetables in Sudbury and districts has not varied significantly.
Notes:
- Rates are age-standardized using the 2011 Canadian population.
- Rates are for the population aged 12 years and older.
- Data source: Canadian Community Health Survey (CCHS), 2007 to 2014, Statistics Canada, Share File, Ontario Ministry of Health and Long-Term Care.
Figure: Age-standardized prevalence rate, fruit and vegetable consumption meeting Canada Food Guide recommendations, by year and geographic area, ages 12+, 2007/08 to 2013/14
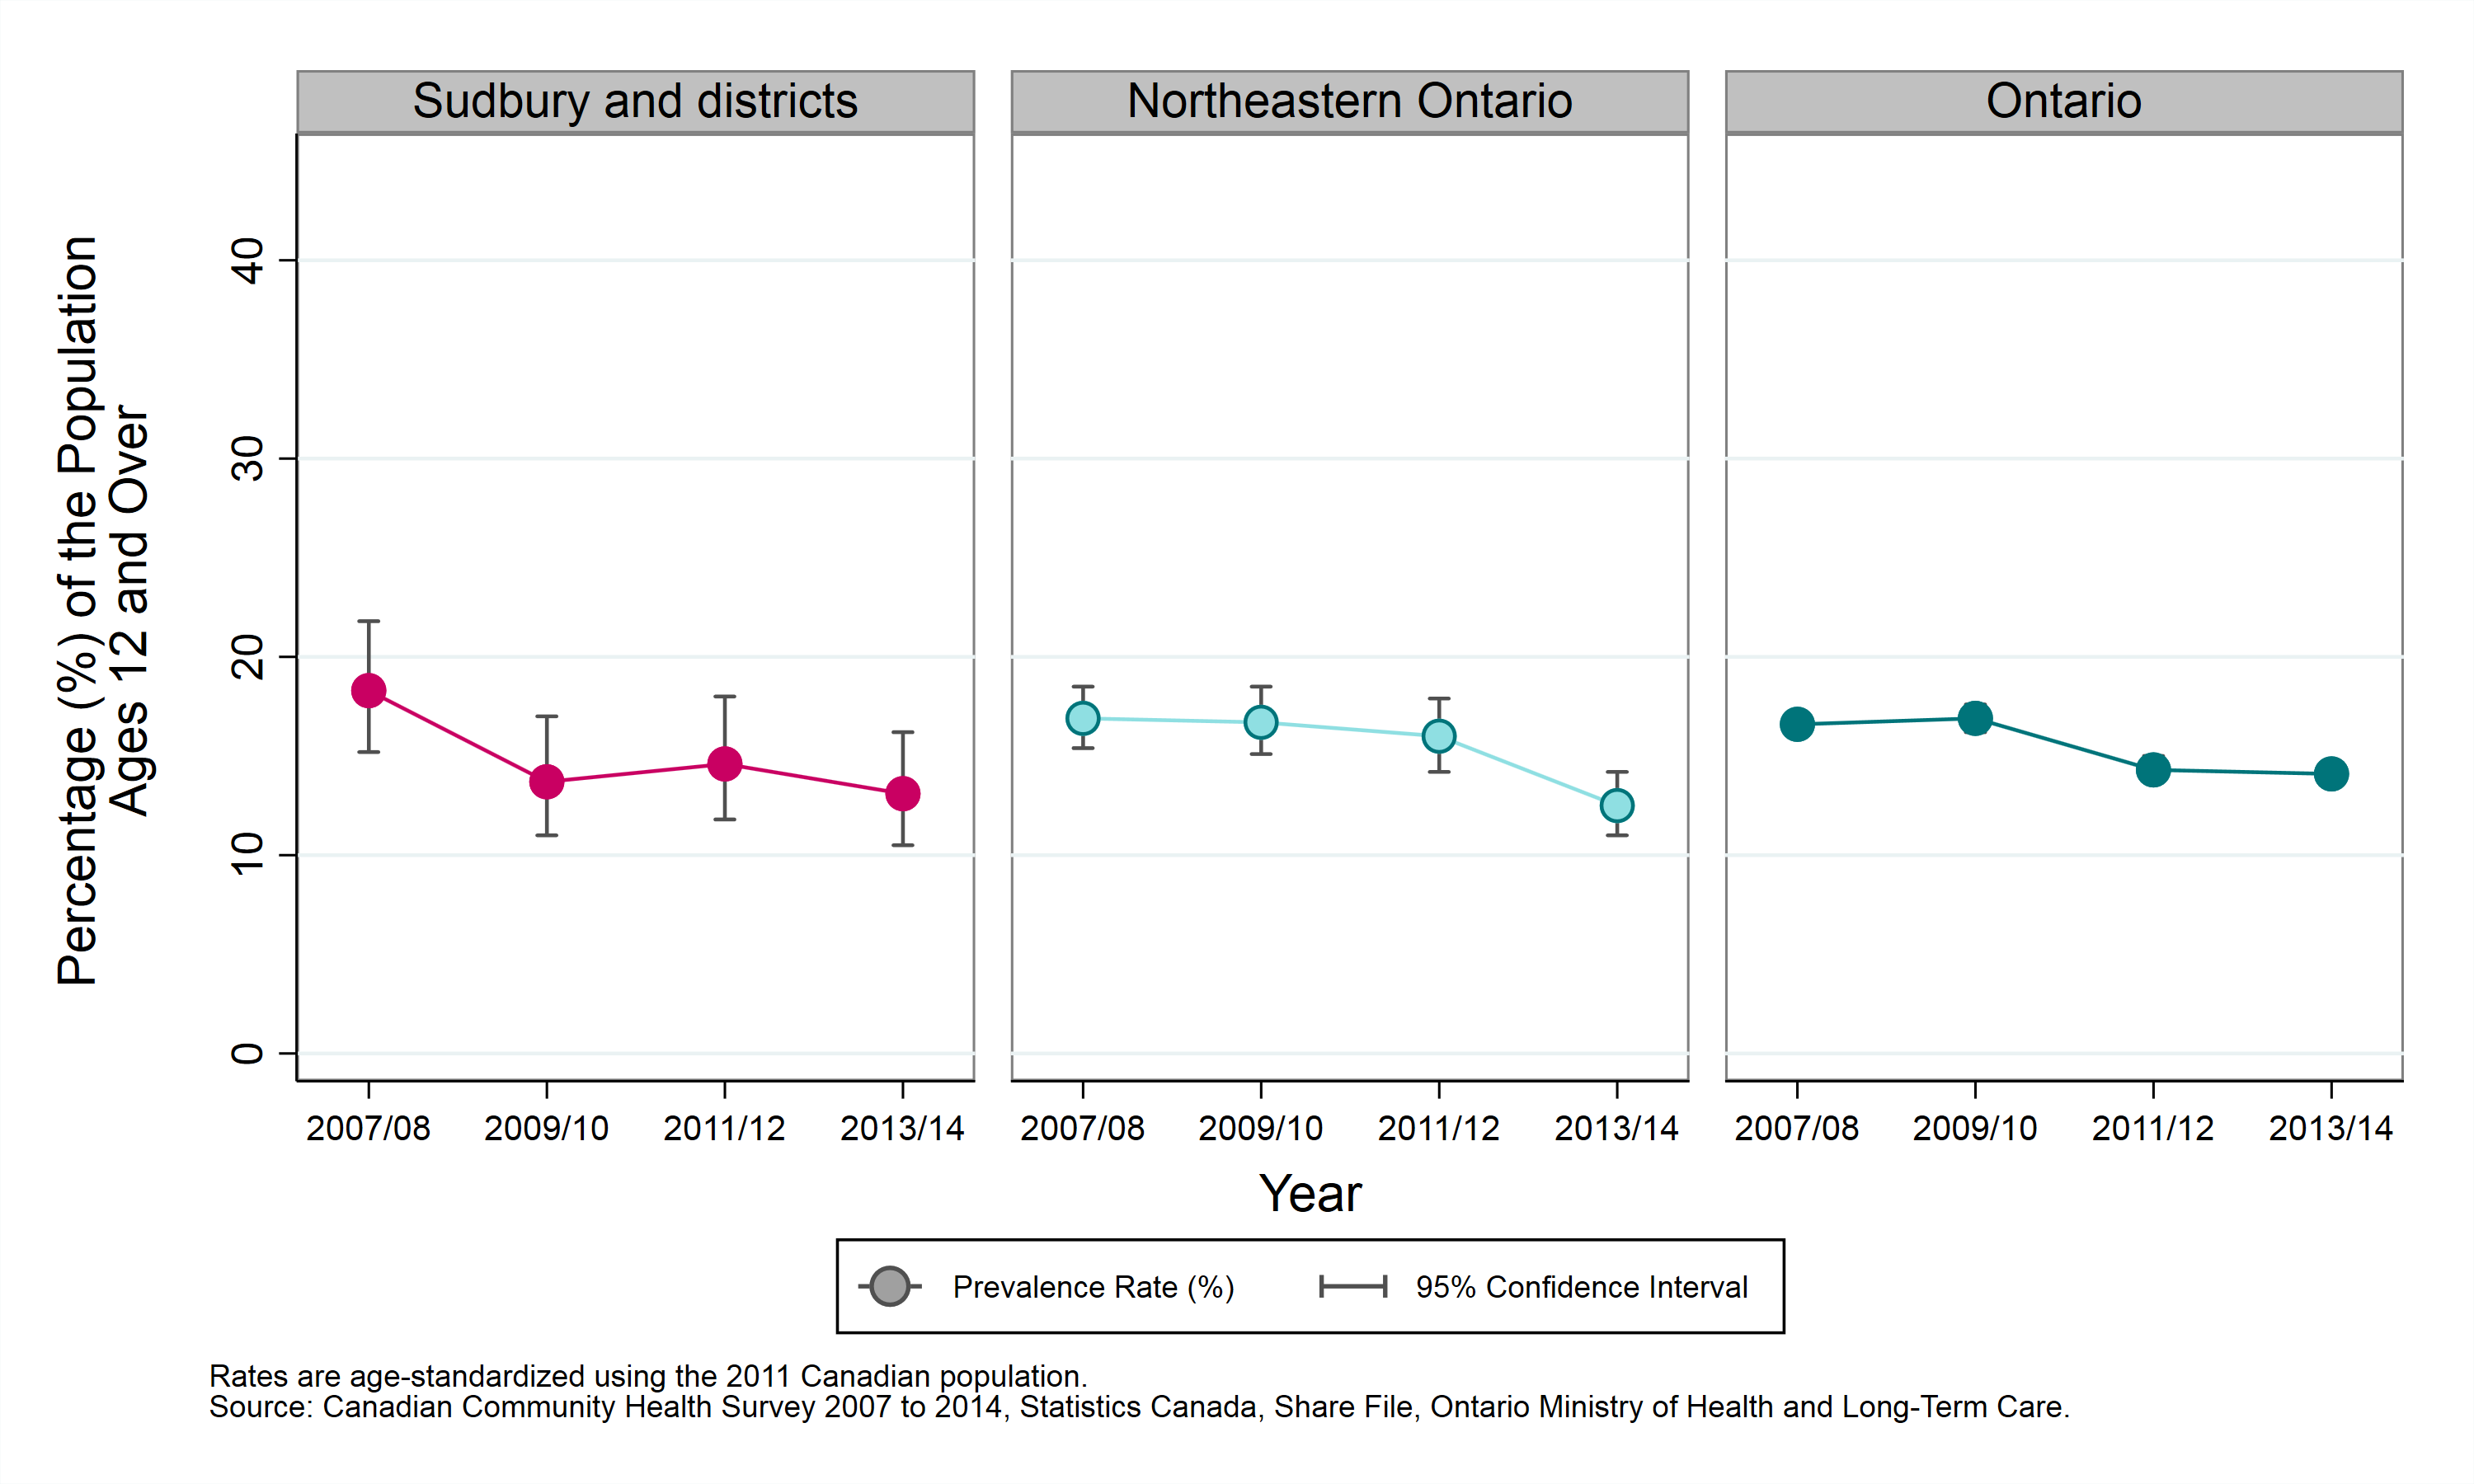
Table: Age-standardized prevalence rate, fruit and vegetable consumption meeting Canada Food Guide recommendations, by year and geographic area, ages 12+, 2007/08 to 2013/14
| Geographic Region | Prevalence Rate, 2007 to 2008 | Prevalence Rate, 2009 to 2010 | Prevalence Rate, 2011 to 2012 | Prevalence Rate, 2013 to 2014 |
|---|---|---|---|---|
| Sudbury and districts | 18.3% (CI: 15.2% to 21.8%) | 13.7% (CI: 11.0% to 17.0%) | 14.6% (CI: 11.8% to 18.0%) | 13.1% (CI: 10.5% to 16.2%) |
| Northeastern Ontario | 16.9% (CI: 15.4% to 18.5%) | 16.7% (CI: 15.1% to 18.5%) | 16.0% (CI: 14.2% to 17.9%) | 12.5% (CI: 11.0% to 14.2%) |
| Ontario | 16.6% (CI: 16.0% to 17.2%) | 16.9% (CI: 16.2% to 17.6%) | 14.3% (CI: 13.7% to 15.0%) | 14.1% (CI: 13.5% to 14.7%) |
Fruit and vegetable consumption by sex
Key findings:
- Between 2011 and 2014, survey results indicated that 10% of males and 18% of females aged 12 years and older in Sudbury and districts met their recommended daily intake of fruits and vegetables.
- The prevalence rate of meeting the recommended intake of fruits and vegetables in males in Sudbury and districts has consistently been lower than the rate in females in Sudbury and districts.
- Between 2007 to 2010 and 2011 to 2014, the rate of meeting the recommended intake of fruits and vegetables in Sudbury and districts has not varied significantly in either males or females.
Notes:
- Rates are age-standardized using the 2011 Canadian population.
- Rates are for the population aged 12 years and older.
- Data source: Canadian Community Health Survey (CCHS), 2007 to 2014, Statistics Canada, Share File, Ontario Ministry of Health and Long-Term Care.
Figure: Age-standardized prevalence rate, fruit and vegetable consumption meeting Canada Food Guide recommendations, by year and sex, ages 12+, 2007 to 2010 and 2011 to 2014
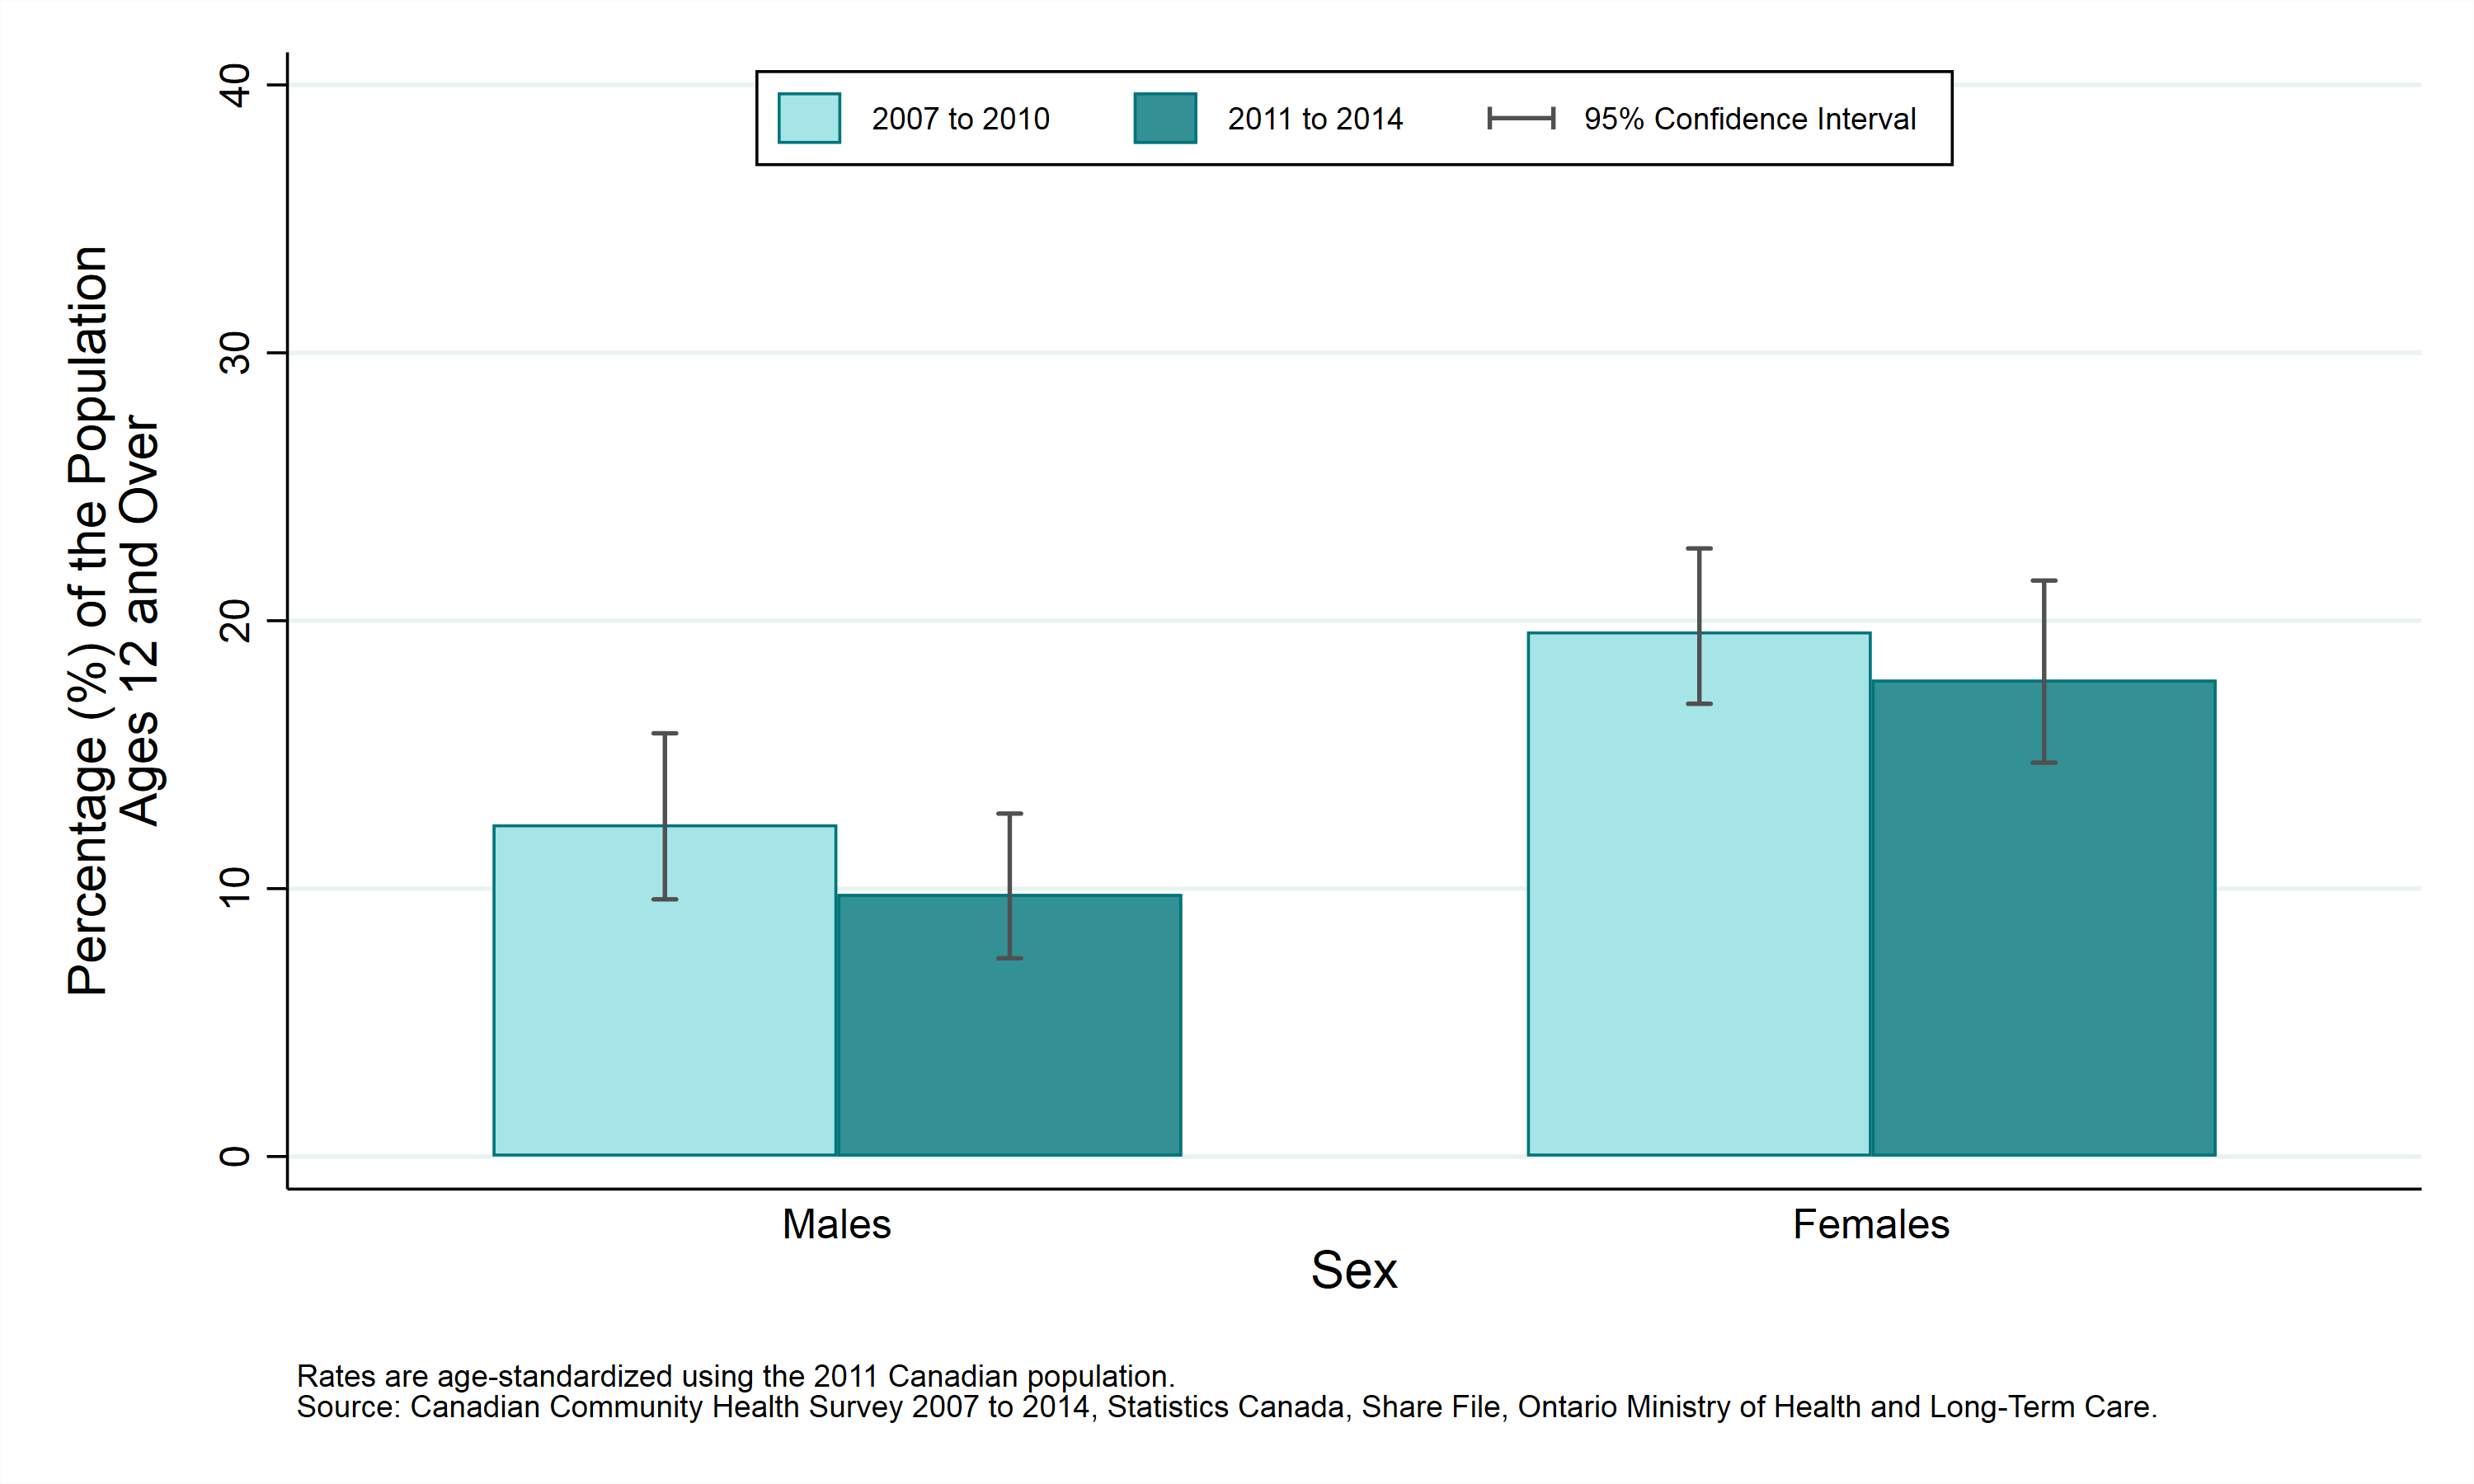
Table: Age-standardized prevalence rate, fruit and vegetable consumption meeting Canada Food Guide recommendations, by year and sex, ages 12+, 2007 to 2010 and 2011 to 2014
| Sex | Prevalence Rate, 2007 to 2010 | Prevalence Rate, 2011 to 2014 |
|---|---|---|
| Males | 12.4% (CI: 9.6% to 15.8%) | 9.8% (CI: 7.4% to 12.8%) |
| Females | 19.6% (CI: 16.9% to 22.7%) | 17.8% (CI: 14.7% to 21.5%) |
Fruits and vegetables consumption by age group
Key findings:
- Between 2011 and 2014, survey results indicated that the rate of meeting the recommended intake of fruits and vegetables was higher in youth aged 12 to 19 in Sudbury and districts. This was not statistically different than the rate in other age groups.
- Between 2007 to 2010 and 2011 to 2014, the reported rate of meeting the recommended intake of fruits and vegetables did not change significantly within any of the age groups.
Notes:
- Rates are for the population aged 12 years and older.
- Data source: Canadian Community Health Survey (CCHS), 2007 to 2014, Statistics Canada, Share File, Ontario Ministry of Health and Long-Term Care.
Figure: Prevalence rate, fruit and vegetable consumption meeting Canada Food Guide recommendations, by year and age group, ages 12+, 2007 to 2010 and 2011 to 2014
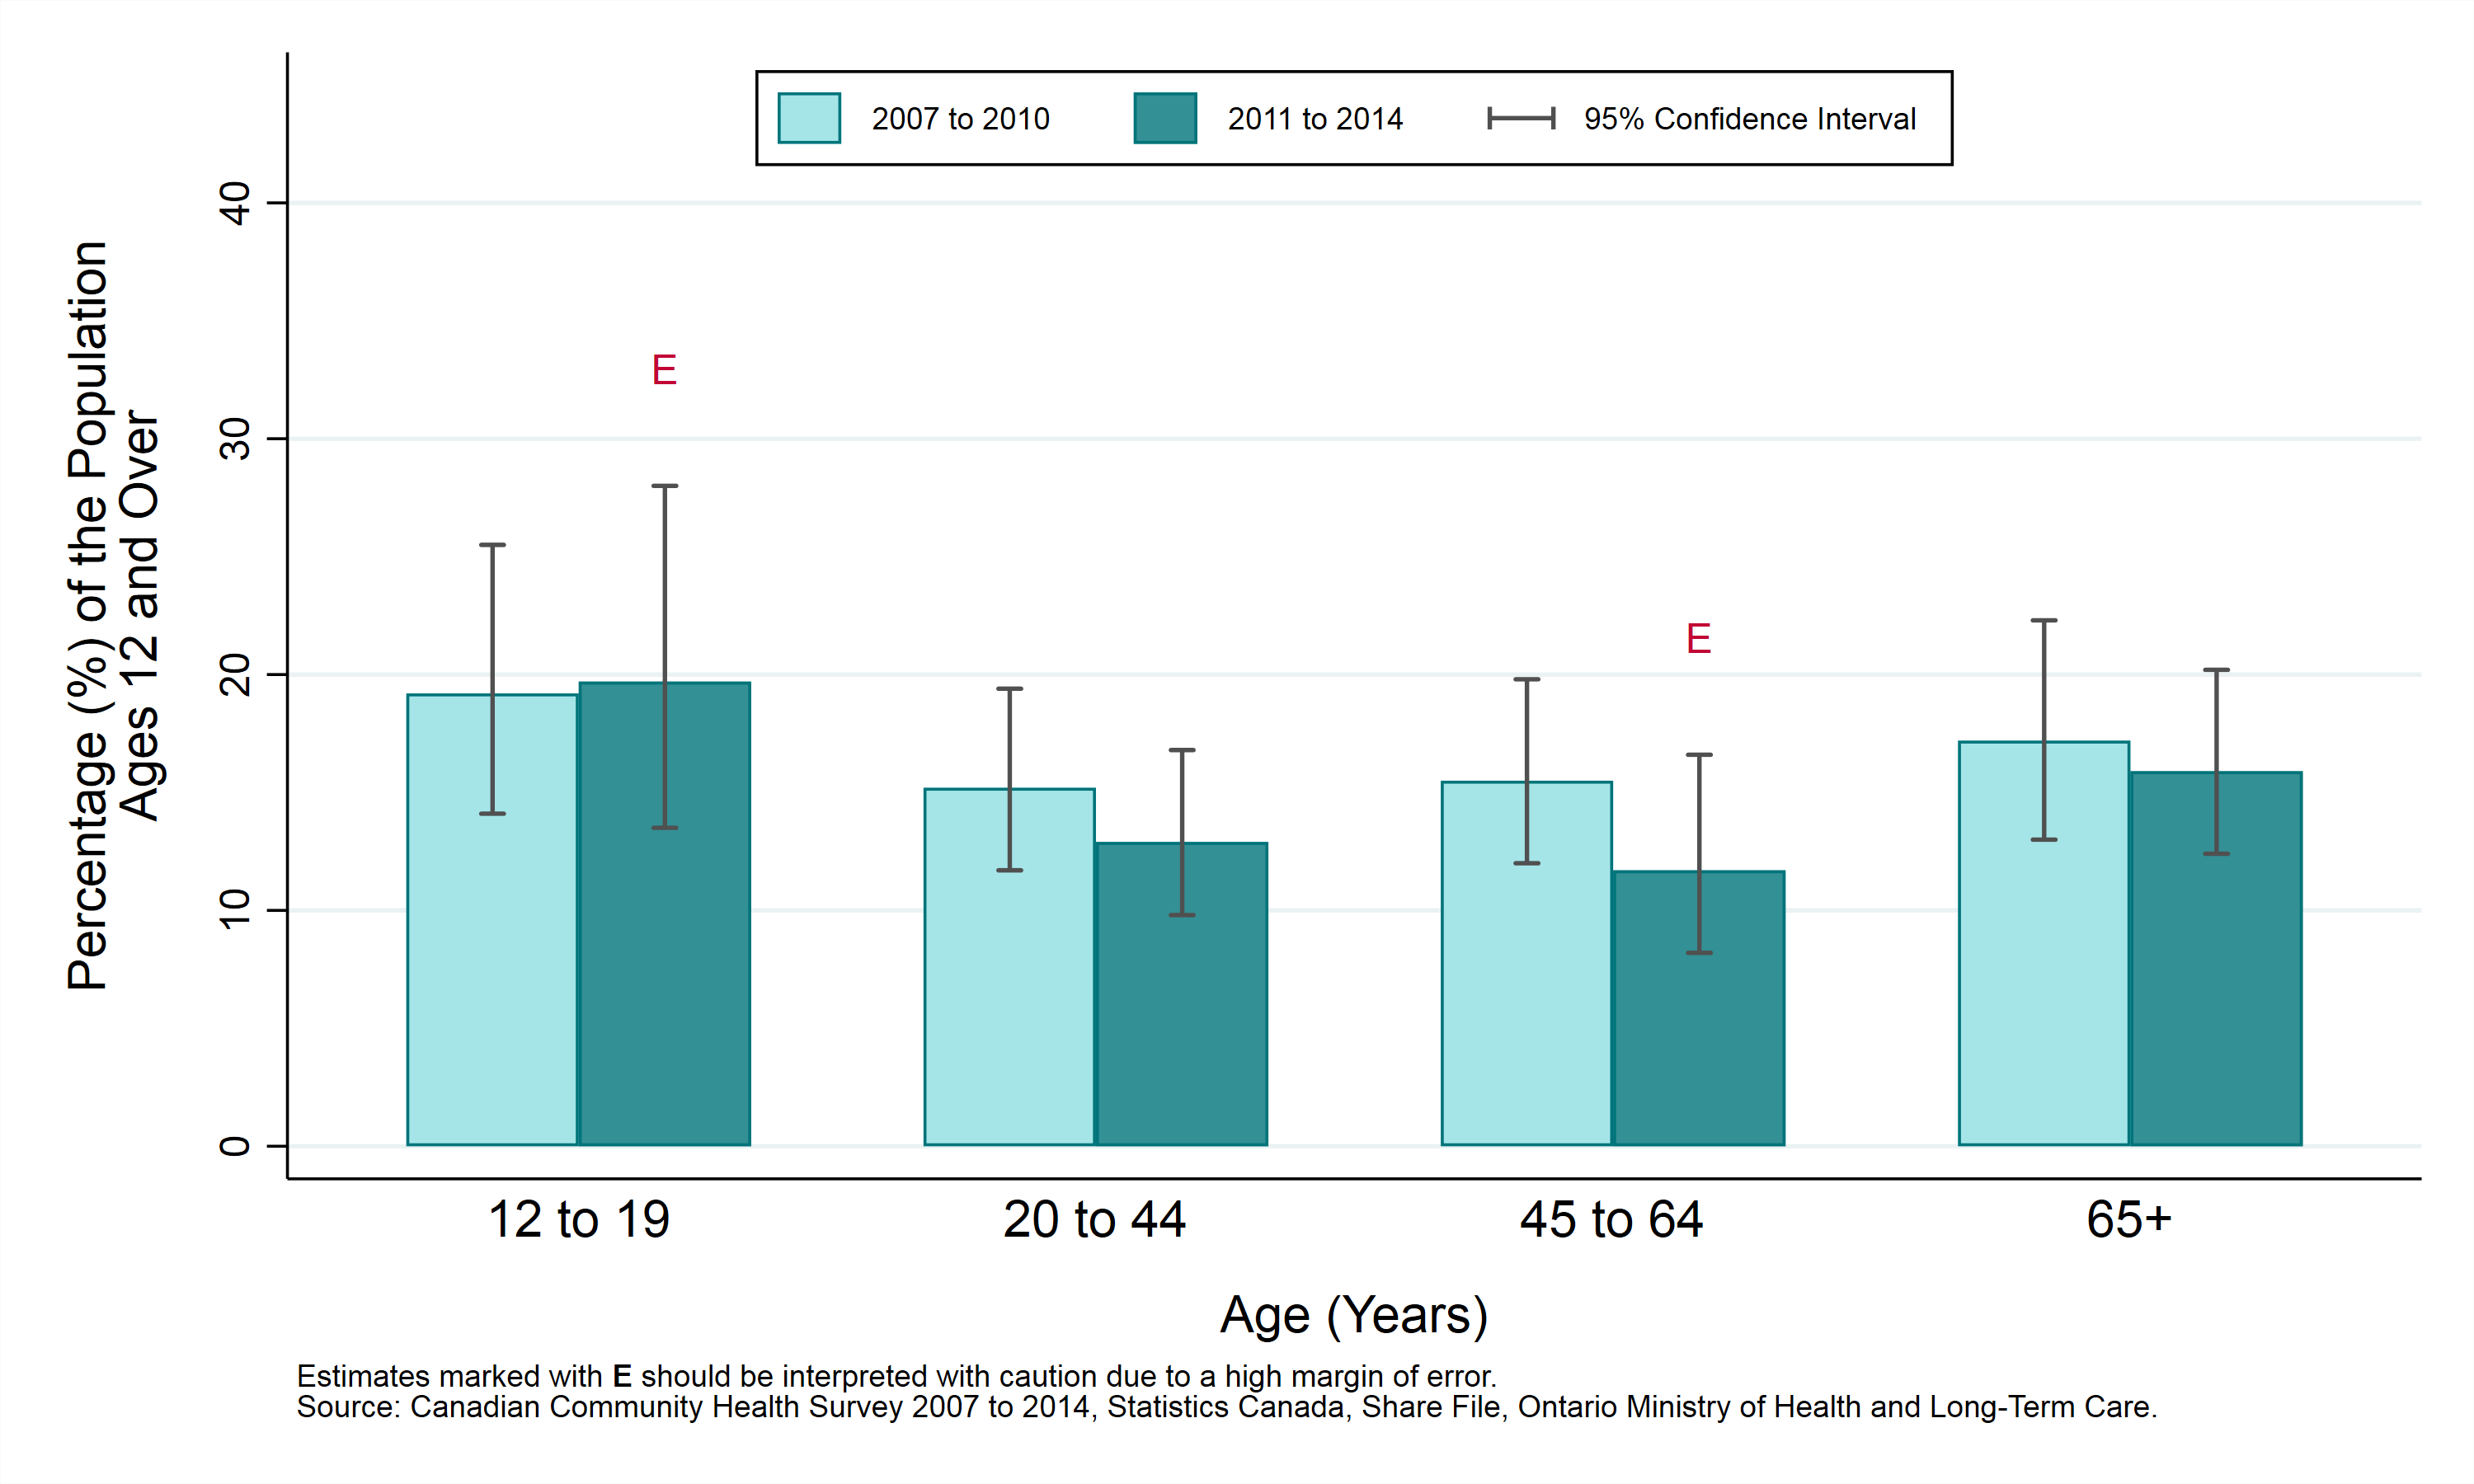
Table: Prevalence rate, fruit and vegetable consumption meeting Canada Food Guide recommendations, by year and age group, ages 12+, 2007 to 2010 and 2011 to 2014
Note: Numbers followed by the letter “E” are to be interpreted with caution due to high sampling variability.
| Age (Years) | Prevalence Rate, 2007 to 2010 | Prevalence Rate, 2011 to 2014 |
|---|---|---|
| 12 to 19 | 19.2% (CI: 14.1% to 25.5%) | 19.7% E (CI: 13.5% to 28.0%) |
| 20 to 44 | 15.2% (CI: 11.7% to 19.4%) | 12.9% (CI: 9.8% to 16.8%) |
| 45 to 64 | 15.5% (CI: 12.0% to 19.8%) | 11.7% E (CI: 8.2% to 16.6%) |
| 65+ | 17.2% (CI: 13.0% to 22.3%) | 15.9% (CI: 12.4% to 20.2%) |
Fruit and vegetable consumption by household income
Key findings:
- Between 2011 and 2014, survey results indicated that the rate of meeting the recommended intake of fruits and vegetables was highest within the highest household income quintile. However, this was not statistically different than the rate in other household income quintiles.
- Between 2007 to 2010 and 2011 to 2014, the reported rate of meeting the recommended intake of fruits and vegetables did not change significantly within any of the household income quintiles.
Notes:
- In this analysis, individuals are divided into “income quintiles”, or 5 groups of roughly equal size based on their reported household income. The groups are ranked, so that Quintile 1 represents the 20% of the population with the lowest incomes, and Quintile 5 represents the 20% with the highest incomes.
- Rates are age-standardized using the 2011 Canadian population.
- Rates are for the population aged 12 years and older.
- Data source: Canadian Community Health Survey (CCHS), 2007 to 2014, Statistics Canada, Share File, Ontario Ministry of Health and Long-Term Care.
Figure: Age-standardized prevalence rate, fruit and vegetable consumption meeting Canada Food Guide recommendations, by year and household income, ages 12+, 2007 to 2010 and 2011 to 2014
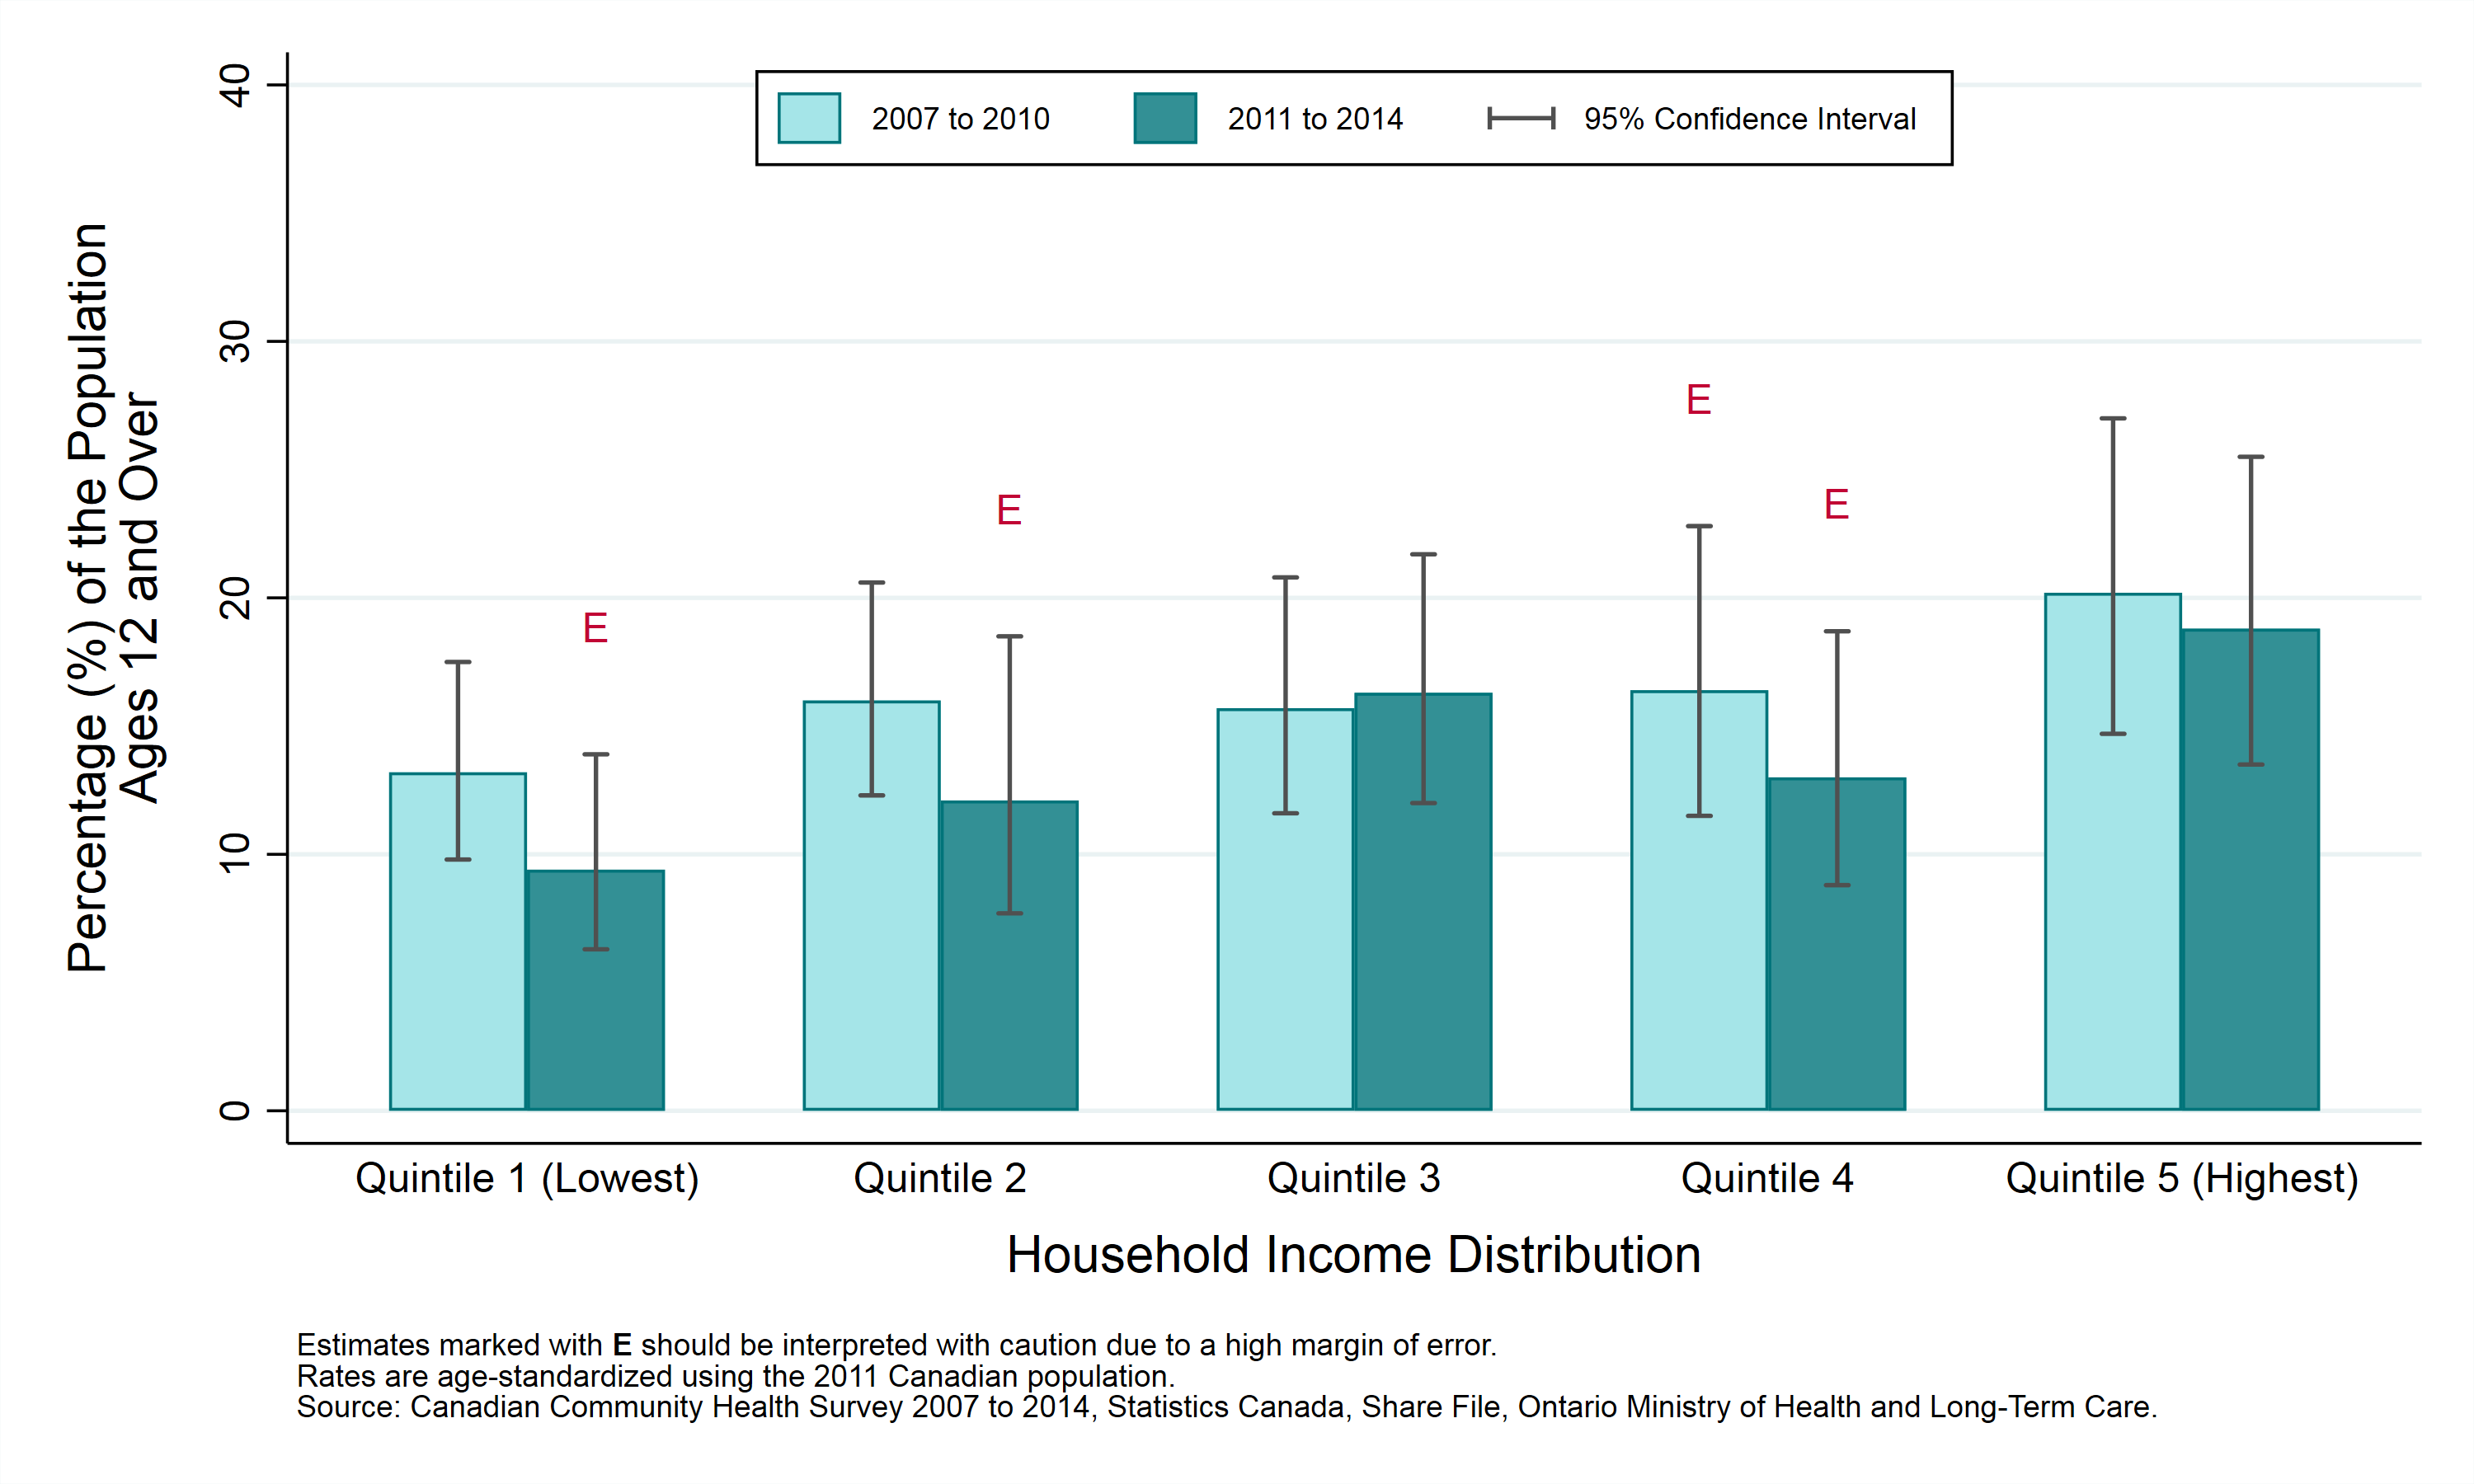
Table: Age-standardized prevalence rate, fruit and vegetable consumption meeting Canada Food Guide recommendations, by year and household income, ages 12+, 2007 to 2010 and 2011 to 2014
Note: Numbers followed by the letter “E” are to be interpreted with caution due to high sampling variability.
| Household Income Distribution | Prevalence Rate, 2007 to 2010 | Prevalence Rate, 2011 to 2014 |
|---|---|---|
| Quintile 1 (Lowest) | 13.2% (CI: 9.8% to 17.5%) | 9.4% E (CI: 6.3% to 13.9%) |
| Quintile 2 | 16.0% (CI: 12.3% to 20.6%) | 12.1% E (CI: 7.7% to 18.5%) |
| Quintile 3 | 15.7% (CI: 11.6% to 20.8%) | 16.3% (CI: 12.0% to 21.7%) |
| Quintile 4 | 16.4% E (CI: 11.5% to 22.8%) | 13.0% E (CI: 8.8% to 18.7%) |
| Quintile 5 (Highest) | 20.2% (CI: 14.7% to 27.0%) | 18.8% (CI: 13.5% to 25.5%) |
Fruit and vegetable consumption by education
Key findings:
- Between 2011 and 2014, survey results indicated that 22% of individuals with a university degree in Sudbury and districts met their recommended intake of fruits and vegetables. This is statistically higher than the rate among those with a high school diploma or less.
- Between 2007 to 2010 and 2011 to 2014, the reported rate of meeting the recommended intake of fruits and vegetables did not change significantly within any of the education level groups.
Notes:
- Rates are age-standardized using the 2011 Canadian population.
- Rates are for the population aged 12 years and older.
- Data source: Canadian Community Health Survey (CCHS), 2007 to 2014, Statistics Canada, Share File, Ontario Ministry of Health and Long-Term Care.
Figure: Age-standardized prevalence rate, fruit and vegetable consumption meeting Canada Food Guide recommendations, by year and education level, ages 12+, 2007 to 2010 and 2011 to 2014
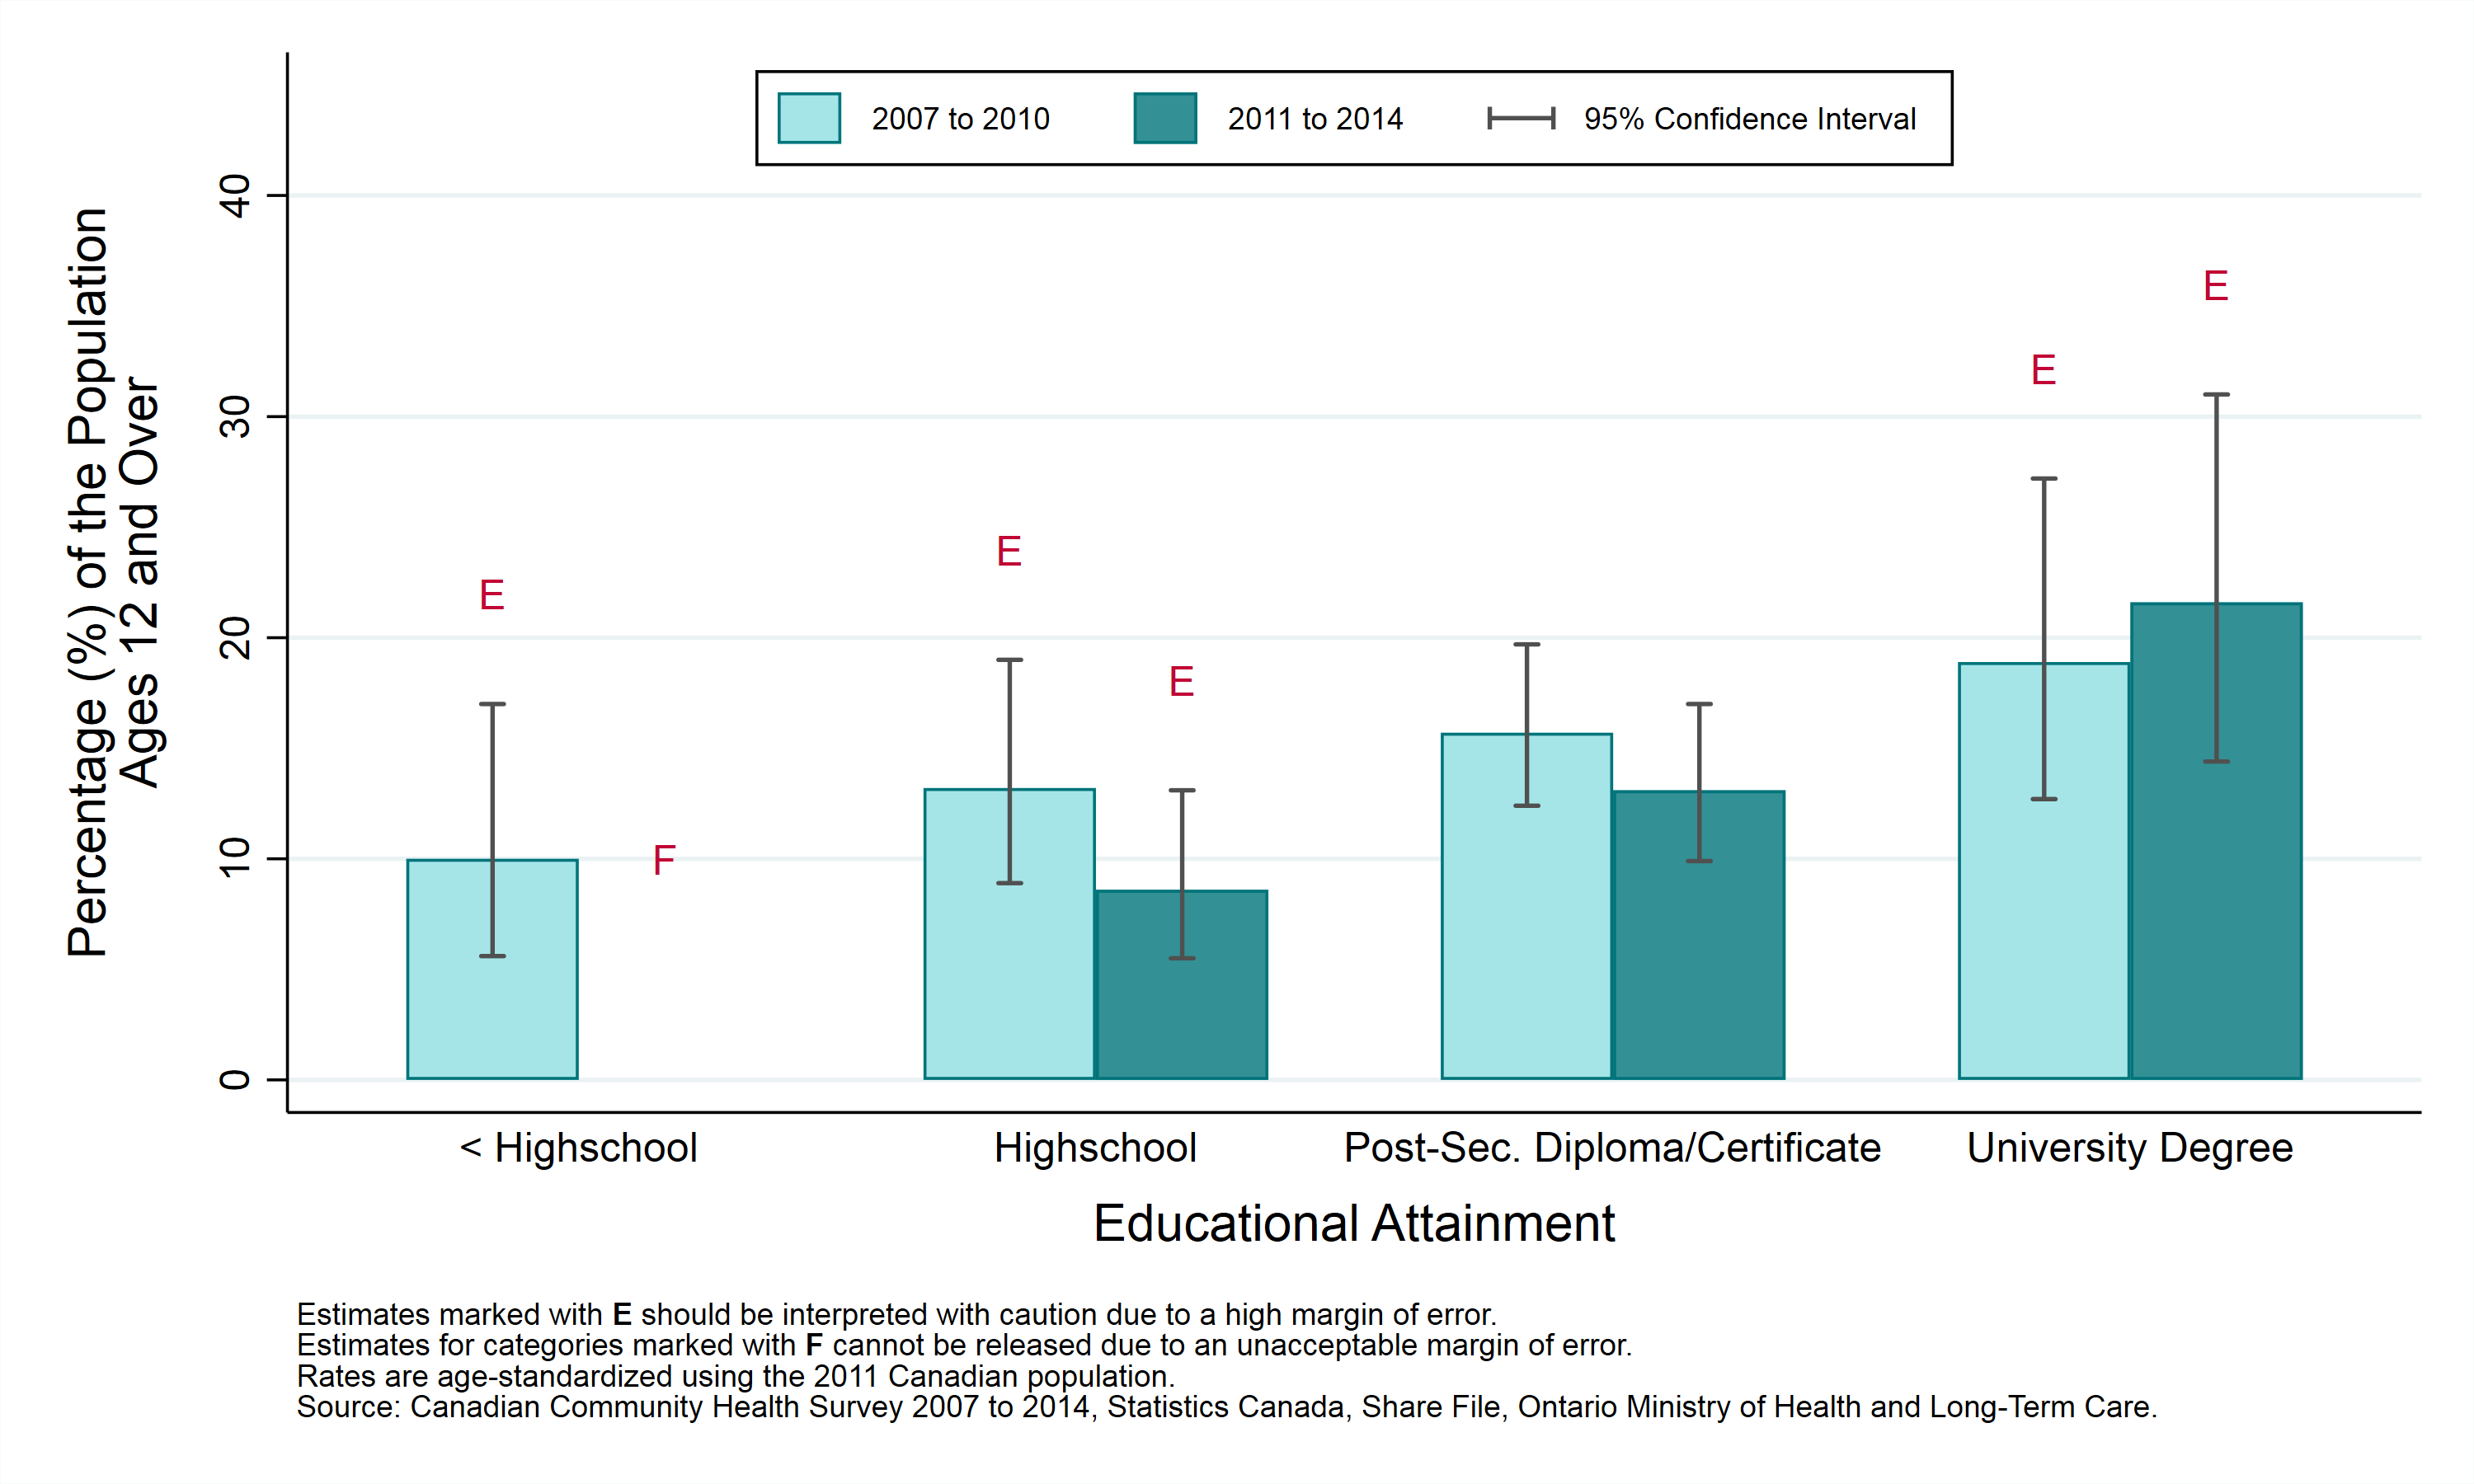
Table: Age-standardized prevalence rate, fruit and vegetable consumption meeting Canada Food Guide recommendations, by year and education level, ages 12+, 2007 to 2010 and 2011 to 2014
Note: Numbers followed by the letter “E” are to be interpreted with caution due to high sampling variability.
| Education | Prevalence Rate, 2007 to 2010 | Prevalence Rate, 2011 to 2014 |
|---|---|---|
| < Highschool Diploma | 10.0% E (CI: 5.6% to 17.0%) | F |
| Highschool Diploma | 13.2% E (CI: 8.9% to 19.0%) | 8.6% E (CI: 5.5% to 13.1%) |
| Trade, College or University Diploma or Certificate | 15.7% (CI: 12.4% to 19.7%) | 13.1% (CI: 9.9% to 17.0%) |
| University Degree | 18.9% E (CI: 12.7% to 27.2%) | 21.6% E (CI: 14.4% to 31.0%) |
Fruit and vegetable consumption by first official language spoken
Key findings:
- Between 2011 and 2014, survey results indicated that there was no statistical difference in the rate at which the two official language groups in Sudbury and districts met their recommended intake of fruits and vegetables.
- Between 2007 to 2010 and 2011 to 2014, the reported rate of meeting the recommended intake of fruits and vegetables did not change significantly in either official language group.
Notes:
- Canada’s official languages are French and English. An individual’s “first official language spoken” is determined using their answers to a number of questions about the languages they speak. A small percentage of people are classified as having both French and English as their “first” official language spoken. Such individuals are included here as French. People speaking neither French nor English are excluded from this analysis.
- Rates are age-standardized using the 2011 Canadian population.
- Rates are for the population aged 12 years and older.
- Data source: Canadian Community Health Survey (CCHS), 2007 to 2014, Statistics Canada, Share File, Ontario Ministry of Health and Long-Term Care.
Figure: Age-standardized prevalence rate, fruit and vegetable consumption meeting Canada Food Guide recommendations, by year and first official language spoken, ages 12+, 2007 to 2010 and 2011 to 2014
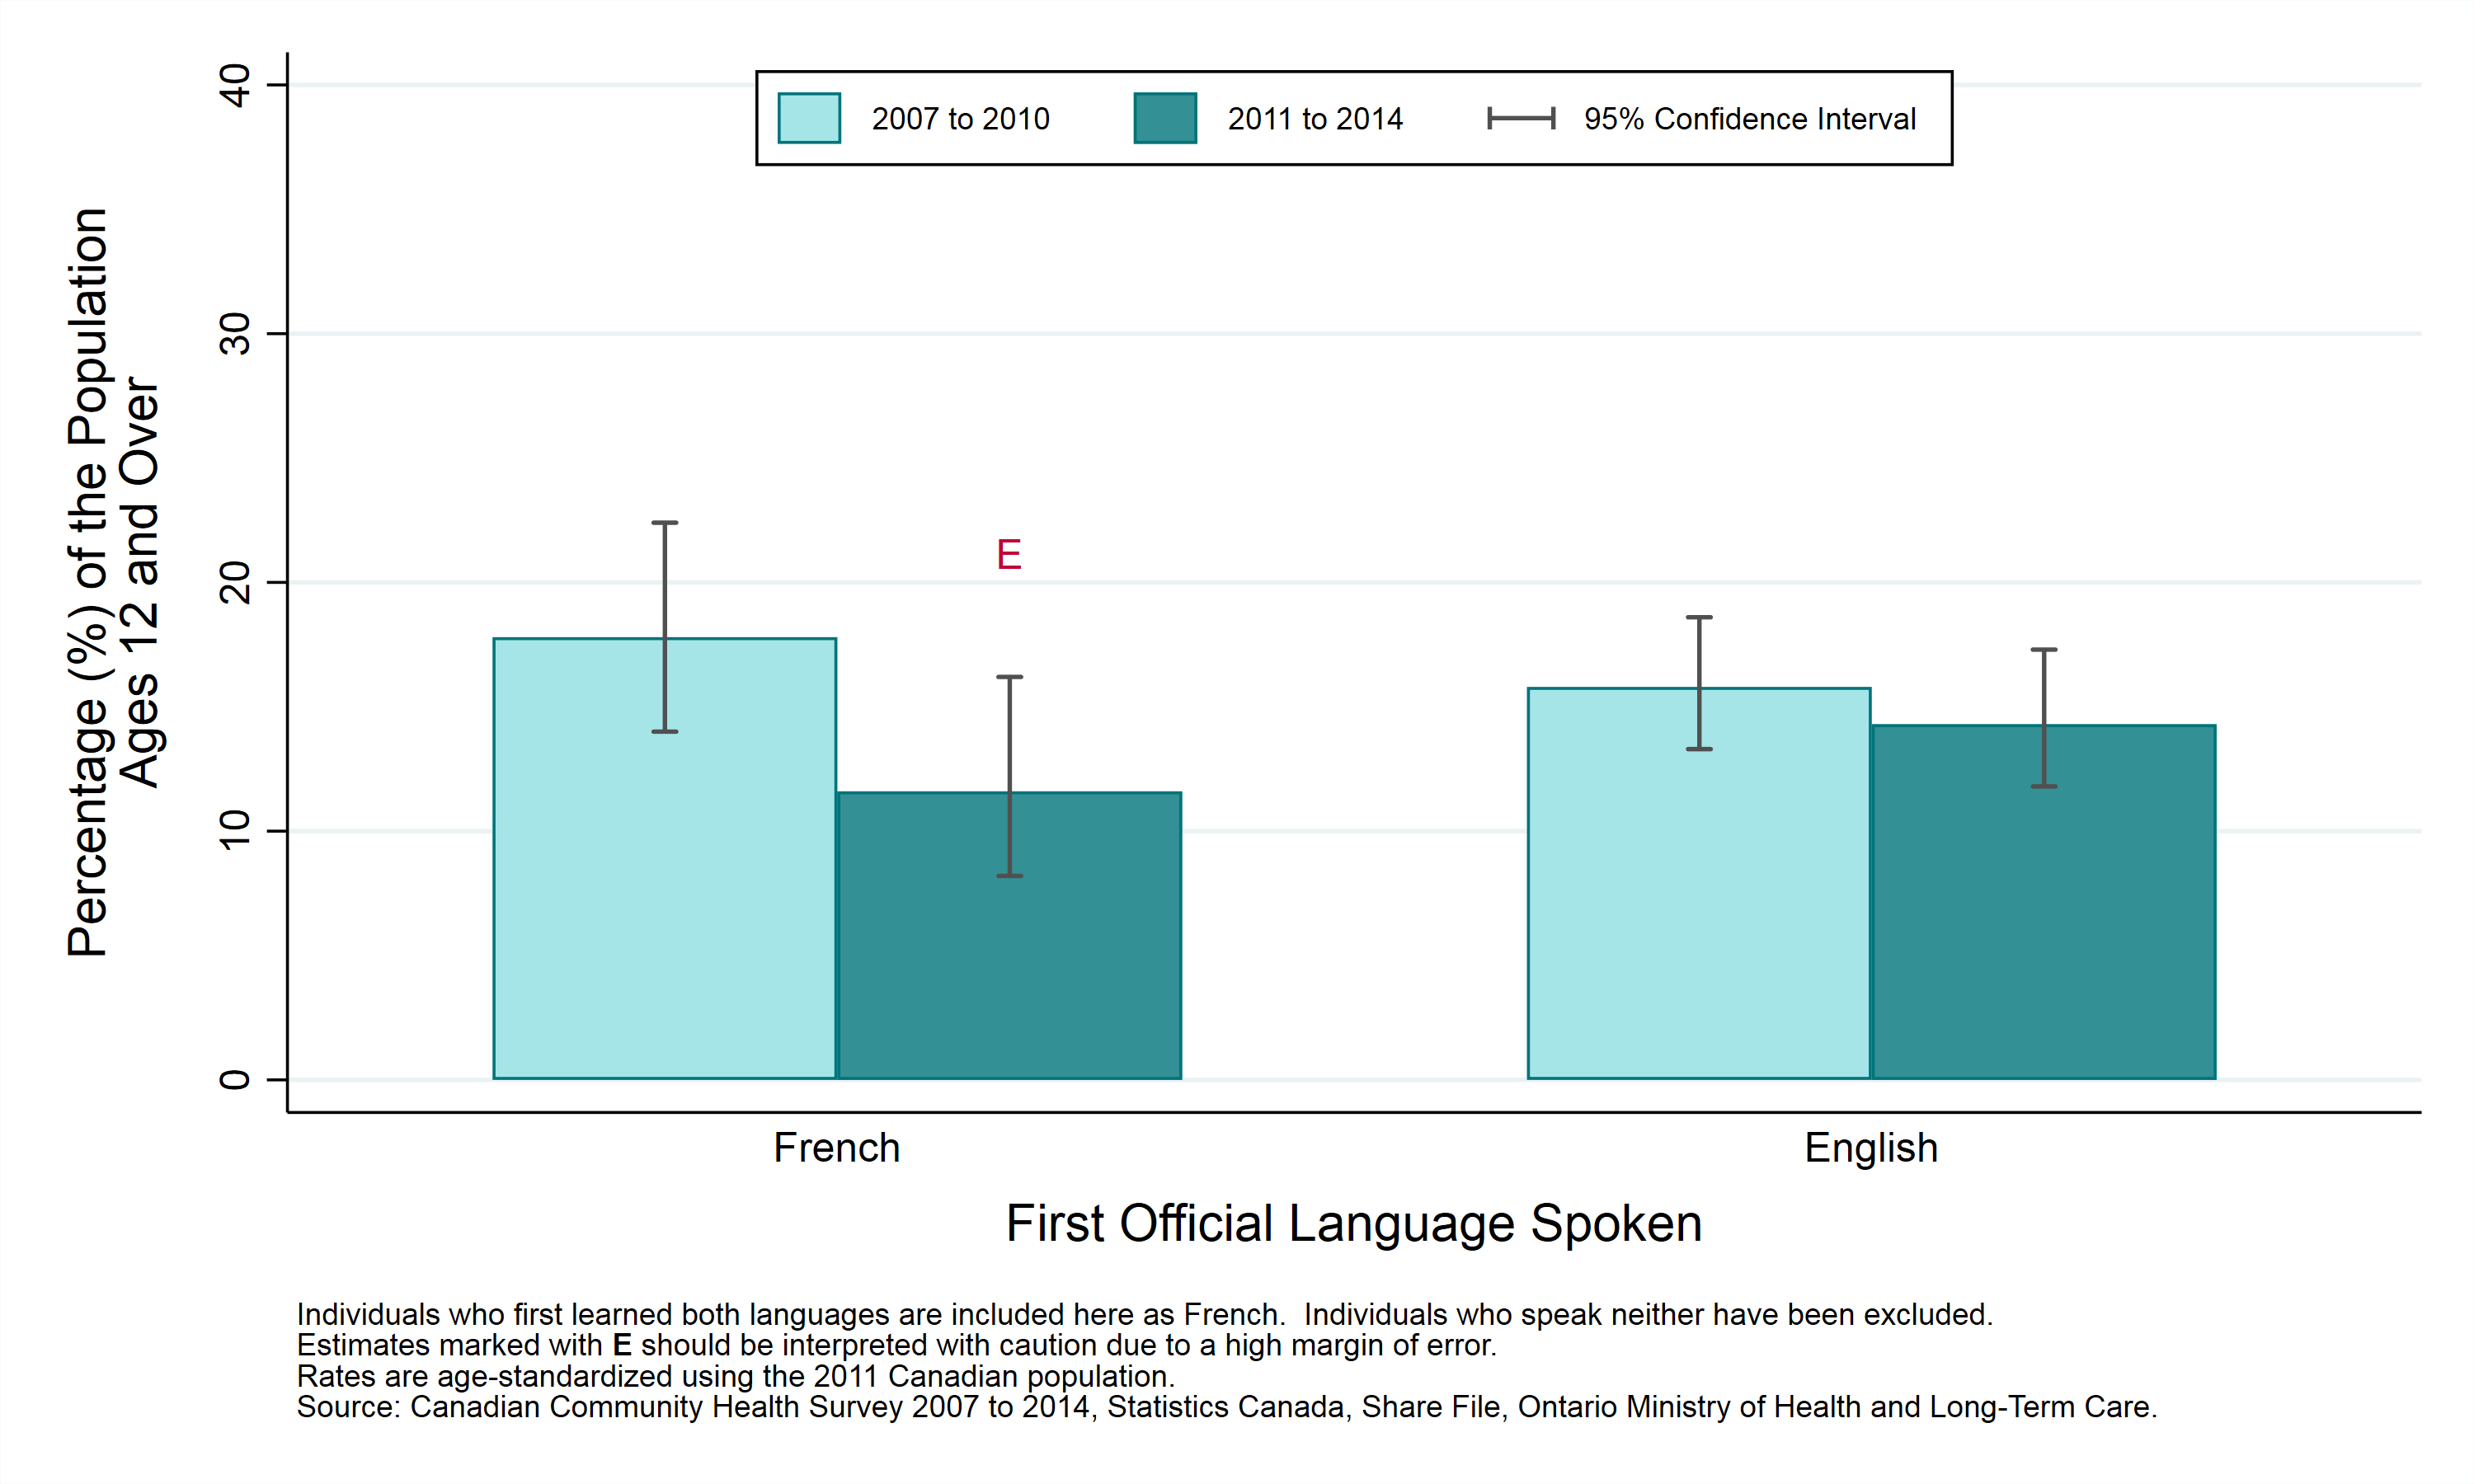
Table: Age-standardized prevalence rate, fruit and vegetable consumption meeting Canada Food Guide recommendations, by year and first official language spoken, ages 12+, 2007 to 2010 and 2011 to 2014
Note: Numbers followed by the letter “E” are to be interpreted with caution due to high sampling variability.
| First Official Language Spoken | Prevalence Rate, 2007 to 2010 | Prevalence Rate, 2011 to 2014 |
|---|---|---|
| French | 17.8% (CI: 14.0% to 22.4%) | 11.6% E (CI: 8.2% to 16.2%) |
| English | 15.8% (CI: 13.3% to 18.6%) | 14.3% (CI: 11.8% to 17.3%) |
This item was last modified on August 22, 2018