Exposure to environmental tobacco smoke in public places
Exposure to environmental tobacco smoke, also known as second-hand smoke, can be harmful to your health. Here we present rates of non-smokers aged 12 years and over who were regularly (every day or almost every day) exposed to tobacco smoke in public places such as bars, restaurants, shopping malls, arenas, bingo halls, bowling alleys, etc.
Exposure to environmental tobacco smoke in public places by geographic area
Key findings:
- In 2013/14, survey results indicated that 14% of the Sudbury and districts population aged 12 years and older were exposed to environmental tobacco smoke in public places.
- The prevalence rate of exposure to environmental tobacco smoke in public places in Sudbury and districts has consistently been similar to that reported in northeastern Ontario, and Ontario overall.
- Between 2007/08 and 2013/14, the rate of exposure to environmental tobacco smoke in public places in Sudbury and districts has not changed significantly.
Notes:
- Rates are age-standardized using the 2011 Canadian population.
- Rates are for the population aged 12 years and older.
- Data source: Canadian Community Health Survey (CCHS), 2007 to 2014, Statistics Canada, Share File, Ontario Ministry of Health and Long-Term Care.
Figure: Age-standardized prevalence rate, exposure to environmental tobacco smoke in public places, by year and geographic area, ages 12+, 2007/08 to 2013/14
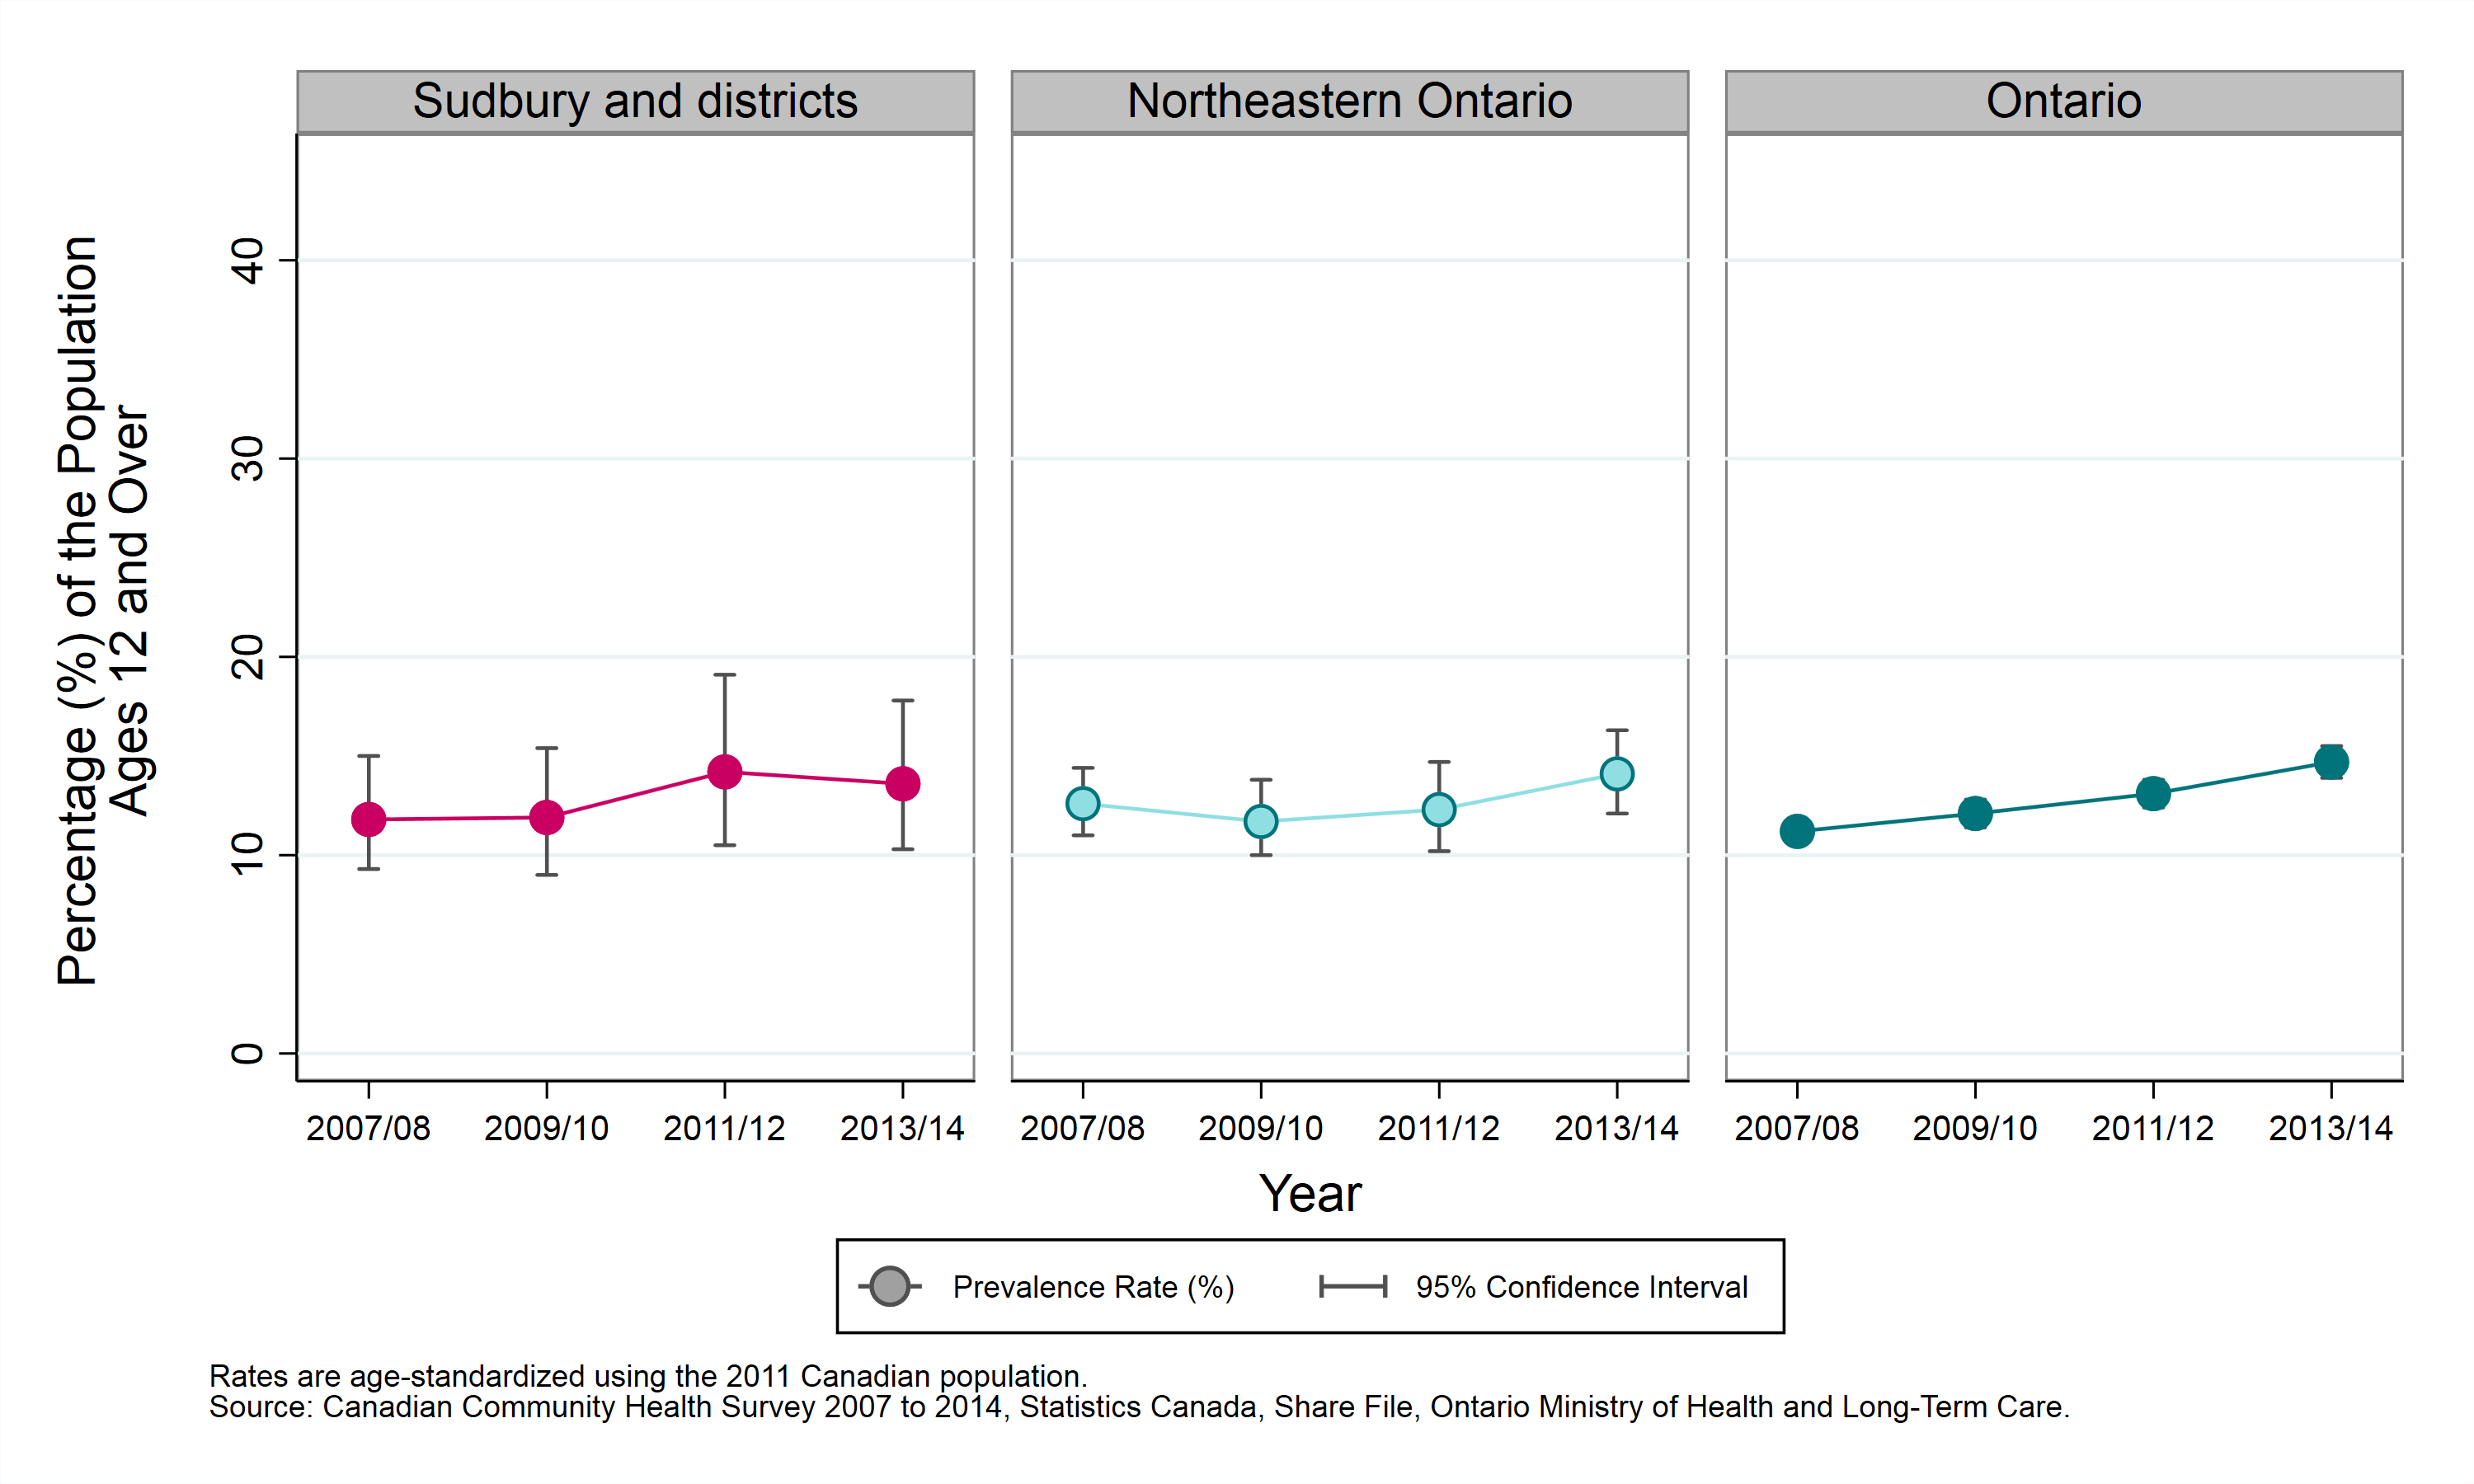
Table: Age-standardized prevalence rate, exposure to environmental tobacco smoke in public places, by year and geographic area, ages 12+, 2007/08 to 2013/14
| Geographic Region | Prevalence Rate, 2007 to 2008 | Prevalence Rate, 2009 to 2010 | Prevalence Rate, 2011 to 2012 | Prevalence Rate, 2013 to 2014 |
|---|---|---|---|---|
| Sudbury and districts | 11.8% (CI: 9.3% to 15.0%) | 11.9% (CI: 9.0% to 15.4%) | 14.2% (CI: 10.5% to 19.1%) | 13.6% (CI: 10.3% to 17.8%) |
| Northeastern Ontario | 12.6% (CI: 11.0% to 14.4%) | 11.7% (CI: 10.0% to 13.8%) | 12.3% (CI: 10.2% to 14.7%) | 14.1% (CI: 12.1% to 16.3%) |
| Ontario | 11.2% (CI: 10.6% to 11.8%) | 12.1% (CI: 11.4% to 12.8%) | 13.1% (CI: 12.4% to 13.8%) | 14.7% (CI: 13.9% to 15.5%) |
Exposure to environmental tobacco smoke in public places by sex
Key findings:
- Between 2011 and 2014, survey results indicated that prevalence rate of exposure to environmental tobacco smoke in public places was not statistically different between males and females.
- Between 2007 to 2010 and 2011 to 2014, the rate of exposure to environmental tobacco smoke in public places in Sudbury and districts has not varied significantly in either males or females.
Notes:
- Rates are age-standardized using the 2011 Canadian population.
- Rates are for the population aged 12 years and older.
- Data source: Canadian Community Health Survey (CCHS), 2007 to 2014, Statistics Canada, Share File, Ontario Ministry of Health and Long-Term Care.
Figure: Age-standardized prevalence rate, exposure to environmental tobacco smoke in public places, by year and sex, ages 12+, 2007 to 2010 and 2011 to 2014
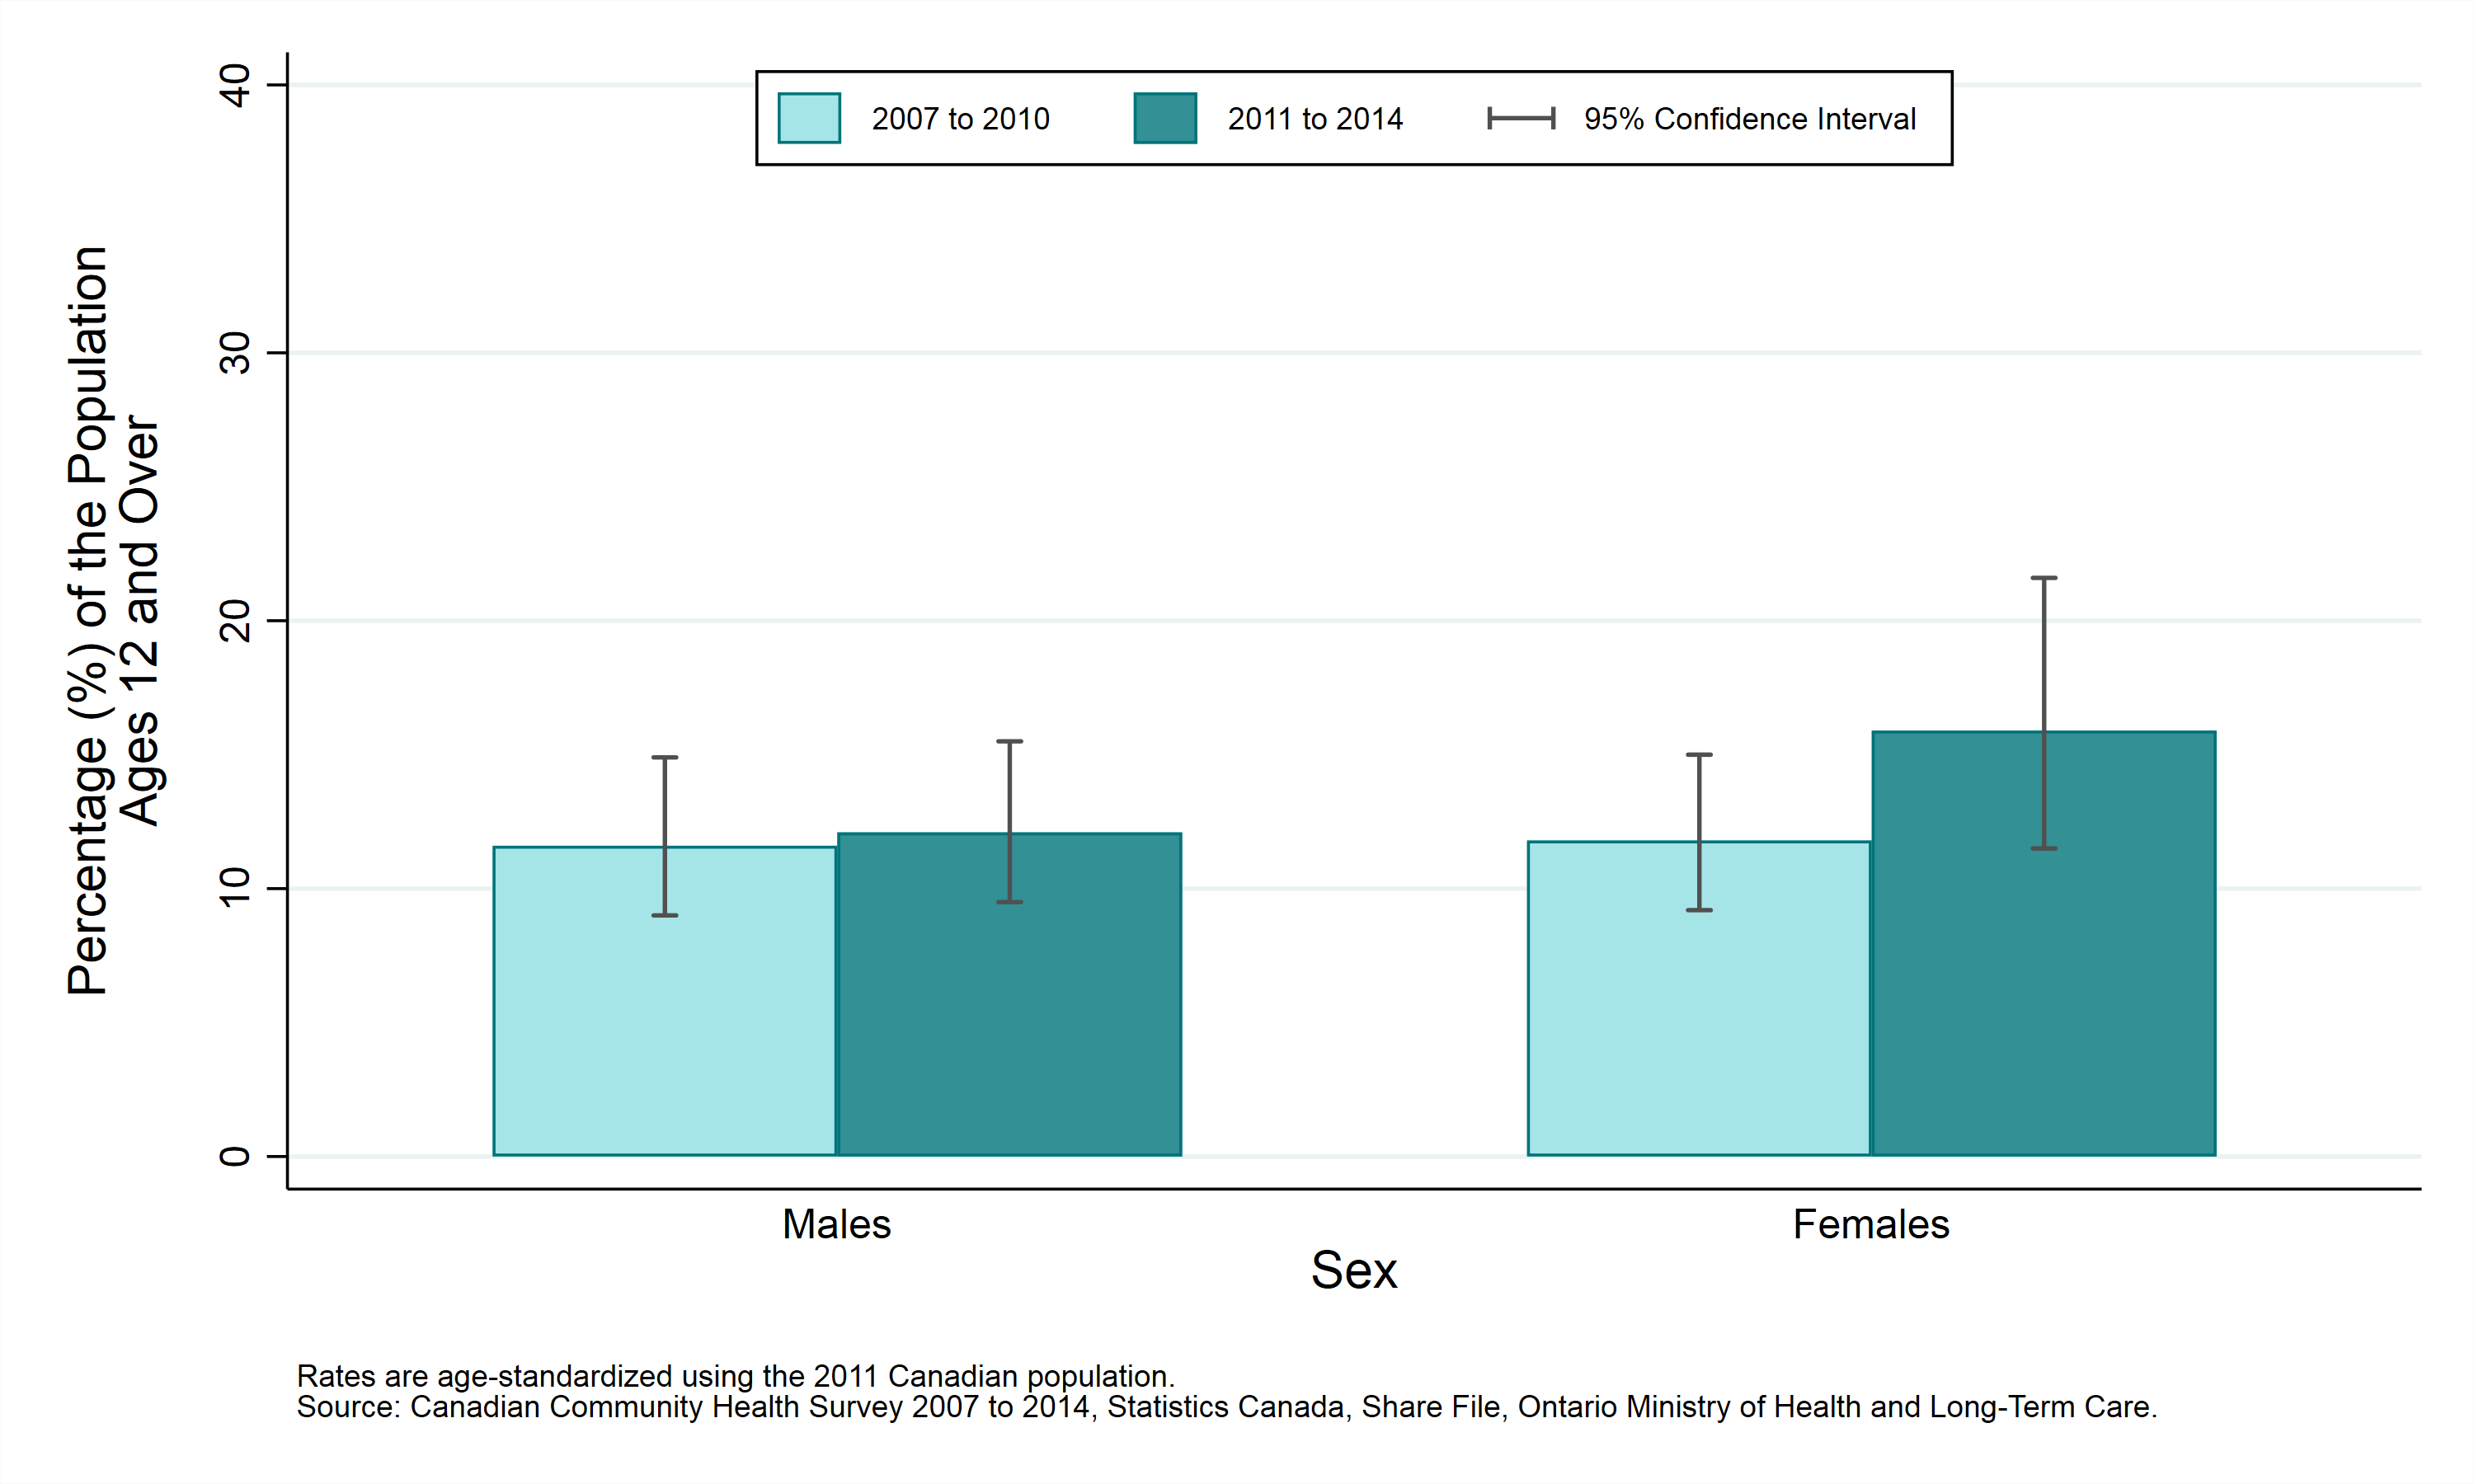
Table: Age-standardized prevalence rate, exposure to environmental tobacco smoke in public places, by year and sex, ages 12+, 2007 to 2010 and 2011 to 2014
| Sex | Prevalence Rate, 2007 to 2010 | Prevalence Rate, 2011 to 2014 |
|---|---|---|
| Males | 11.6% (CI: 9.0% to 14.9%) | 12.1% (CI: 9.5% to 15.5%) |
| Females | 11.8% (CI: 9.2% to 15.0%) | 15.9% (CI: 11.5% to 21.6%) |
Exposure to environmental tobacco smoke in public places by age group
Key findings:
- Between 2011 and 2014, survey results indicated that the prevalence rate of exposure to environmental tobacco smoke in public places in the 12 to 19 year old age group was statistically higher than that in the 45 to 64 year age group. No other statistically significant differences were observed.
- Between 2007 to 2010, and 2011 to 2014, the rate of exposure to environmental tobacco smoke in public places in Sudbury and districts has not varied significantly in any of the age groups.
Notes:
- Rates are for the population aged 12 years and older.
- Data source: Canadian Community Health Survey (CCHS), 2007 to 2014, Statistics Canada, Share File, Ontario Ministry of Health and Long-Term Care.
Figure: Prevalence rate, exposure to environmental tobacco smoke in public places, by year and age group, ages 12+, 2007 to 2010 and 2011 to 2014
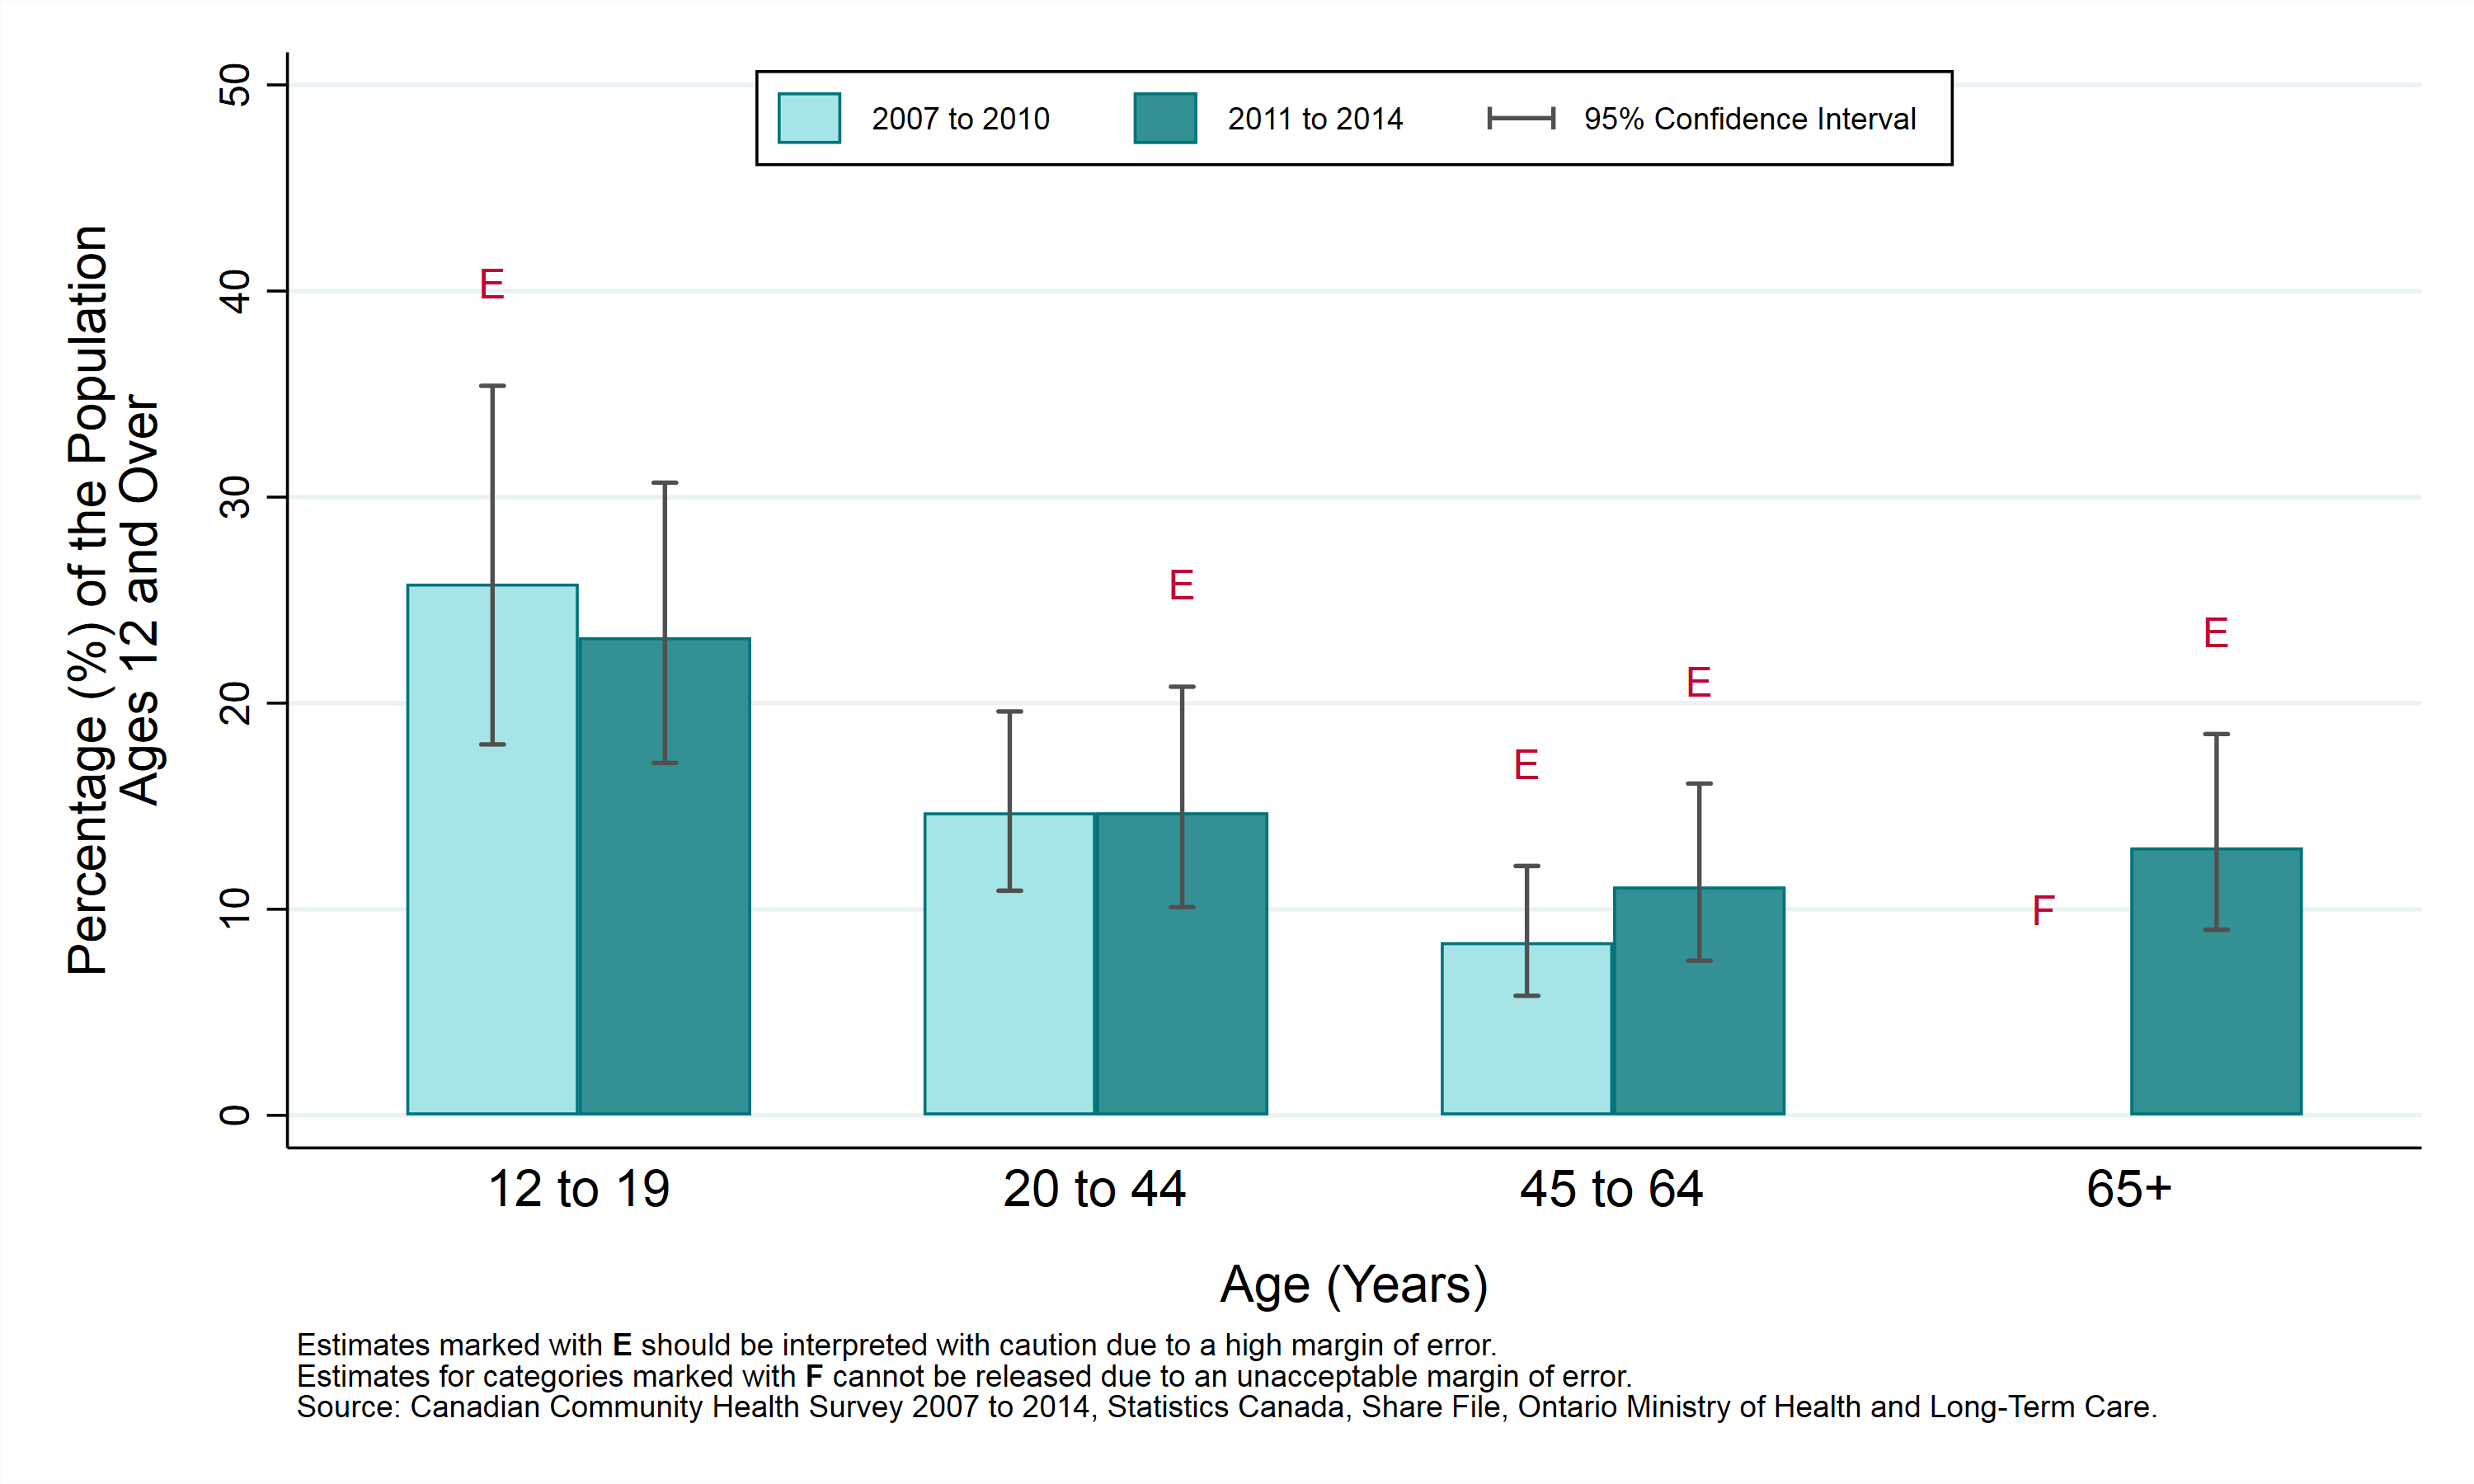
Table: Prevalence rate, exposure to environmental tobacco smoke in public places, by year and age group, ages 12+, 2007 to 2010 and 2011 to 2014
Note: Numbers followed by the letter “E” are to be interpreted with caution due to high sampling variability.
The letter “F” is to be interpreted as an estimate which has been suppressed due to high sampling variability.
| Age (Years) | Prevalence Rate, 2007 to 2010 | Prevalence Rate, 2011 to 2014 |
|---|---|---|
| 12 to 19 | 25.8% E (CI: 18.0% to 35.4%) | 23.2% (CI: 17.1% to 30.7%) |
| 20 to 44 | 14.7% (CI: 10.9% to 19.6%) | 14.7% E (CI: 10.1% to 20.8%) |
| 45 to 64 | 8.4% E (CI: 5.8% to 12.1%) | 11.1% E (CI: 7.5% to 16.1%) |
| 65+ | F | 13.0% E (CI: 9.0% to 18.5%) |
Exposure to environmental tobacco smoke in public places by household income
Key findings:
- Between 2011 and 2014, survey results indicated that the prevalence rate of exposure to environmental tobacco smoke in public places was similar among household income quintiles.
- Between 2007 to 2010 and 2011 to 2014, the rate of exposure to environmental tobacco smoke in public places in Sudbury and districts has not varied significantly in any of the household income quintiles.
Notes:
- In this analysis, individuals are divided into “income quintiles”, or 5 groups of roughly equal size based on their reported household income. The groups are ranked, so that Quintile 1 represents the 20% of the population with the lowest incomes, and Quintile 5 represents the 20% with the highest incomes.
- Rates are age-standardized using the 2011 Canadian population.
- Rates are for the population aged 12 years and older.
- Data source: Canadian Community Health Survey (CCHS), 2007 to 2014, Statistics Canada, Share File, Ontario Ministry of Health and Long-Term Care.
Figure: Age-standardized prevalence rate, exposure to environmental tobacco smoke in public places, by year and household income, ages 12+, 2007 to 2010 and 2011 to 2014
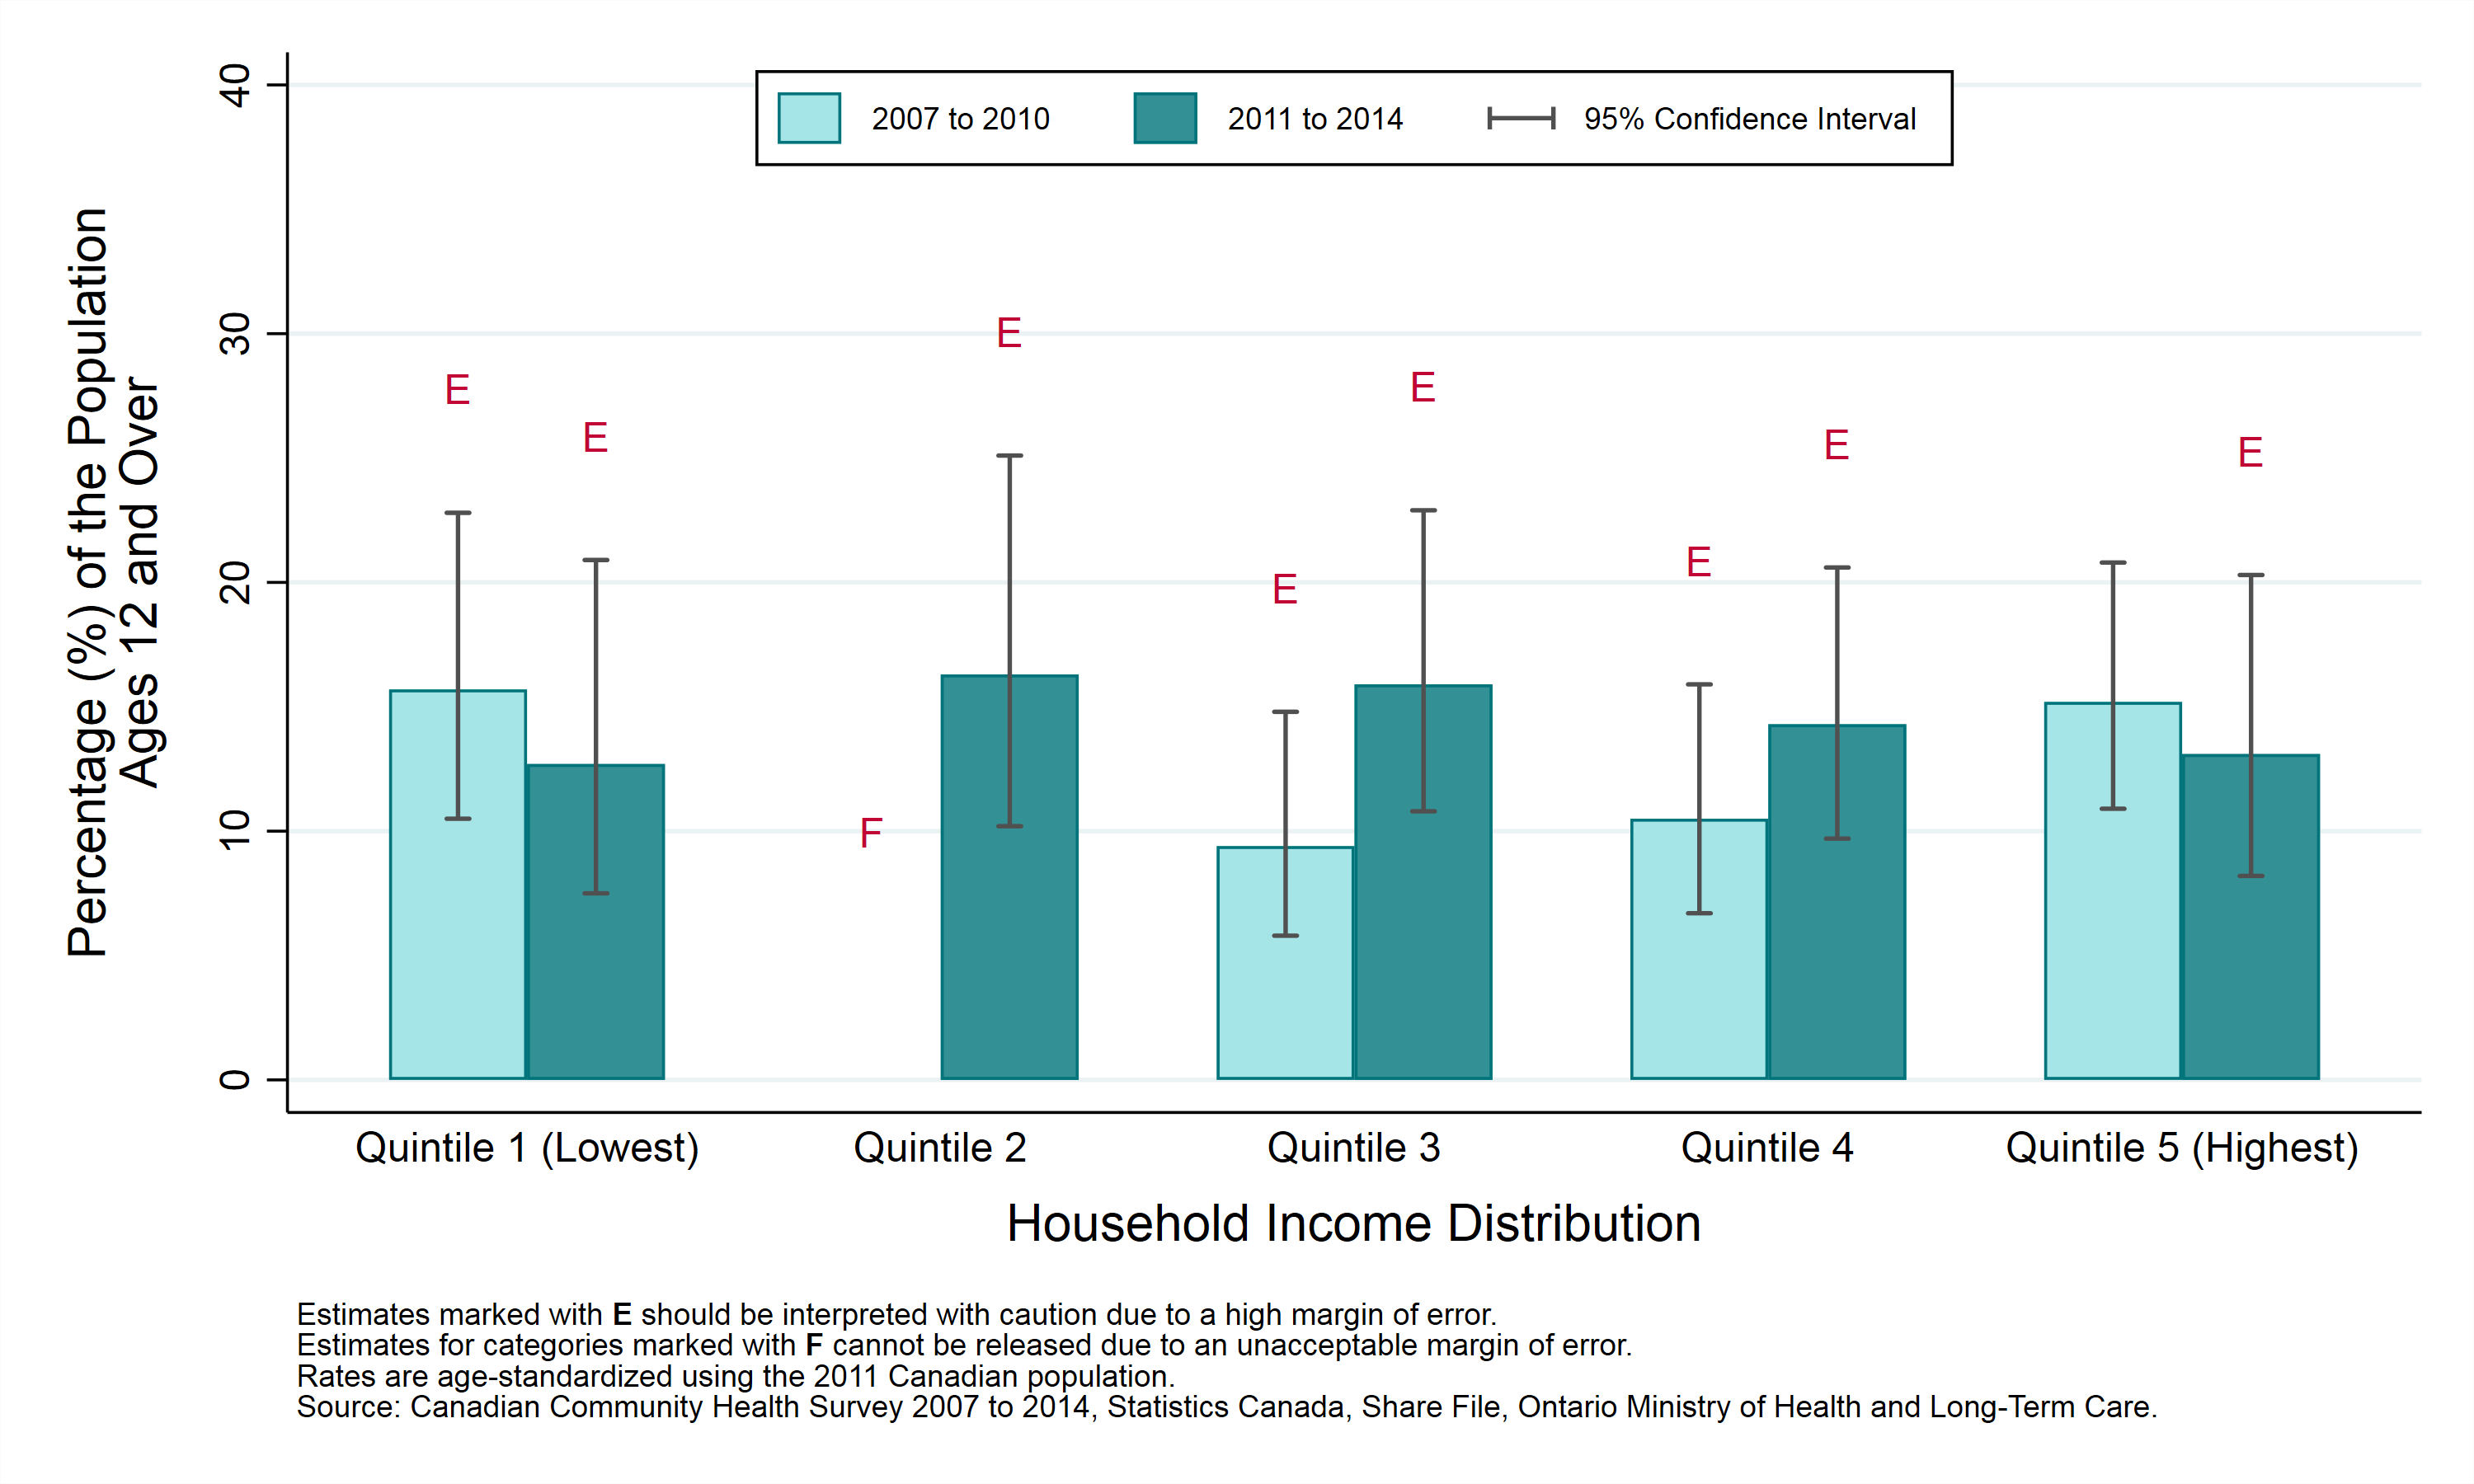
Table: Age-standardized prevalence rate, exposure to environmental tobacco smoke in public places, by year and household income, ages 12+, 2007 to 2010 and 2011 to 2014
Note: Numbers followed by the letter “E” are to be interpreted with caution due to high sampling variability.
The letter “F” is to be interpreted as an estimate which has been suppressed due to high sampling variability.
| Household Income Distribution | Prevalence Rate, 2007 to 2010 | Prevalence Rate, 2011 to 2014 |
|---|---|---|
| Quintile 1 (Lowest) | 15.7% E (CI: 10.5% to 22.8%) | 12.7% E (CI: 7.5% to 20.9%) |
| Quintile 2 | F | 16.3% E (CI: 10.2% to 25.1%) |
| Quintile 3 | 9.4% E (CI: 5.8% to 14.8%) | 15.9% E (CI: 10.8% to 22.9%) |
| Quintile 4 | 10.5% E (CI: 6.7% to 15.9%) | 14.3% E (CI: 9.7% to 20.6%) |
| Quintile 5 (Highest) | 15.2% (CI: 10.9% to 20.8%) | 13.1% E (CI: 8.2% to 20.3%) |
Exposure to environmental tobacco smoke in public places by education
Key findings:
- Between 2011 and 2014, survey results indicated that the prevalence rate of exposure to environmental tobacco smoke in public places was not statistically different between various education levels.
- Between 2007 to 2010 and 2011 to 2014, the rate of exposure to environmental tobacco smoke in public places in Sudbury and districts did not vary among the education groups for which comparison could be made.
Notes:
- Rates are age-standardized using the 2011 Canadian population.
- Rates are for the population aged 12 years and older.
- Data source: Canadian Community Health Survey (CCHS), 2007 to 2014, Statistics Canada, Share File, Ontario Ministry of Health and Long-Term Care.
Figure: Age-standardized prevalence rate, exposure to environmental tobacco smoke in public places, by year and education, ages 12+, 2007 to 2010 and 2011 to 2014
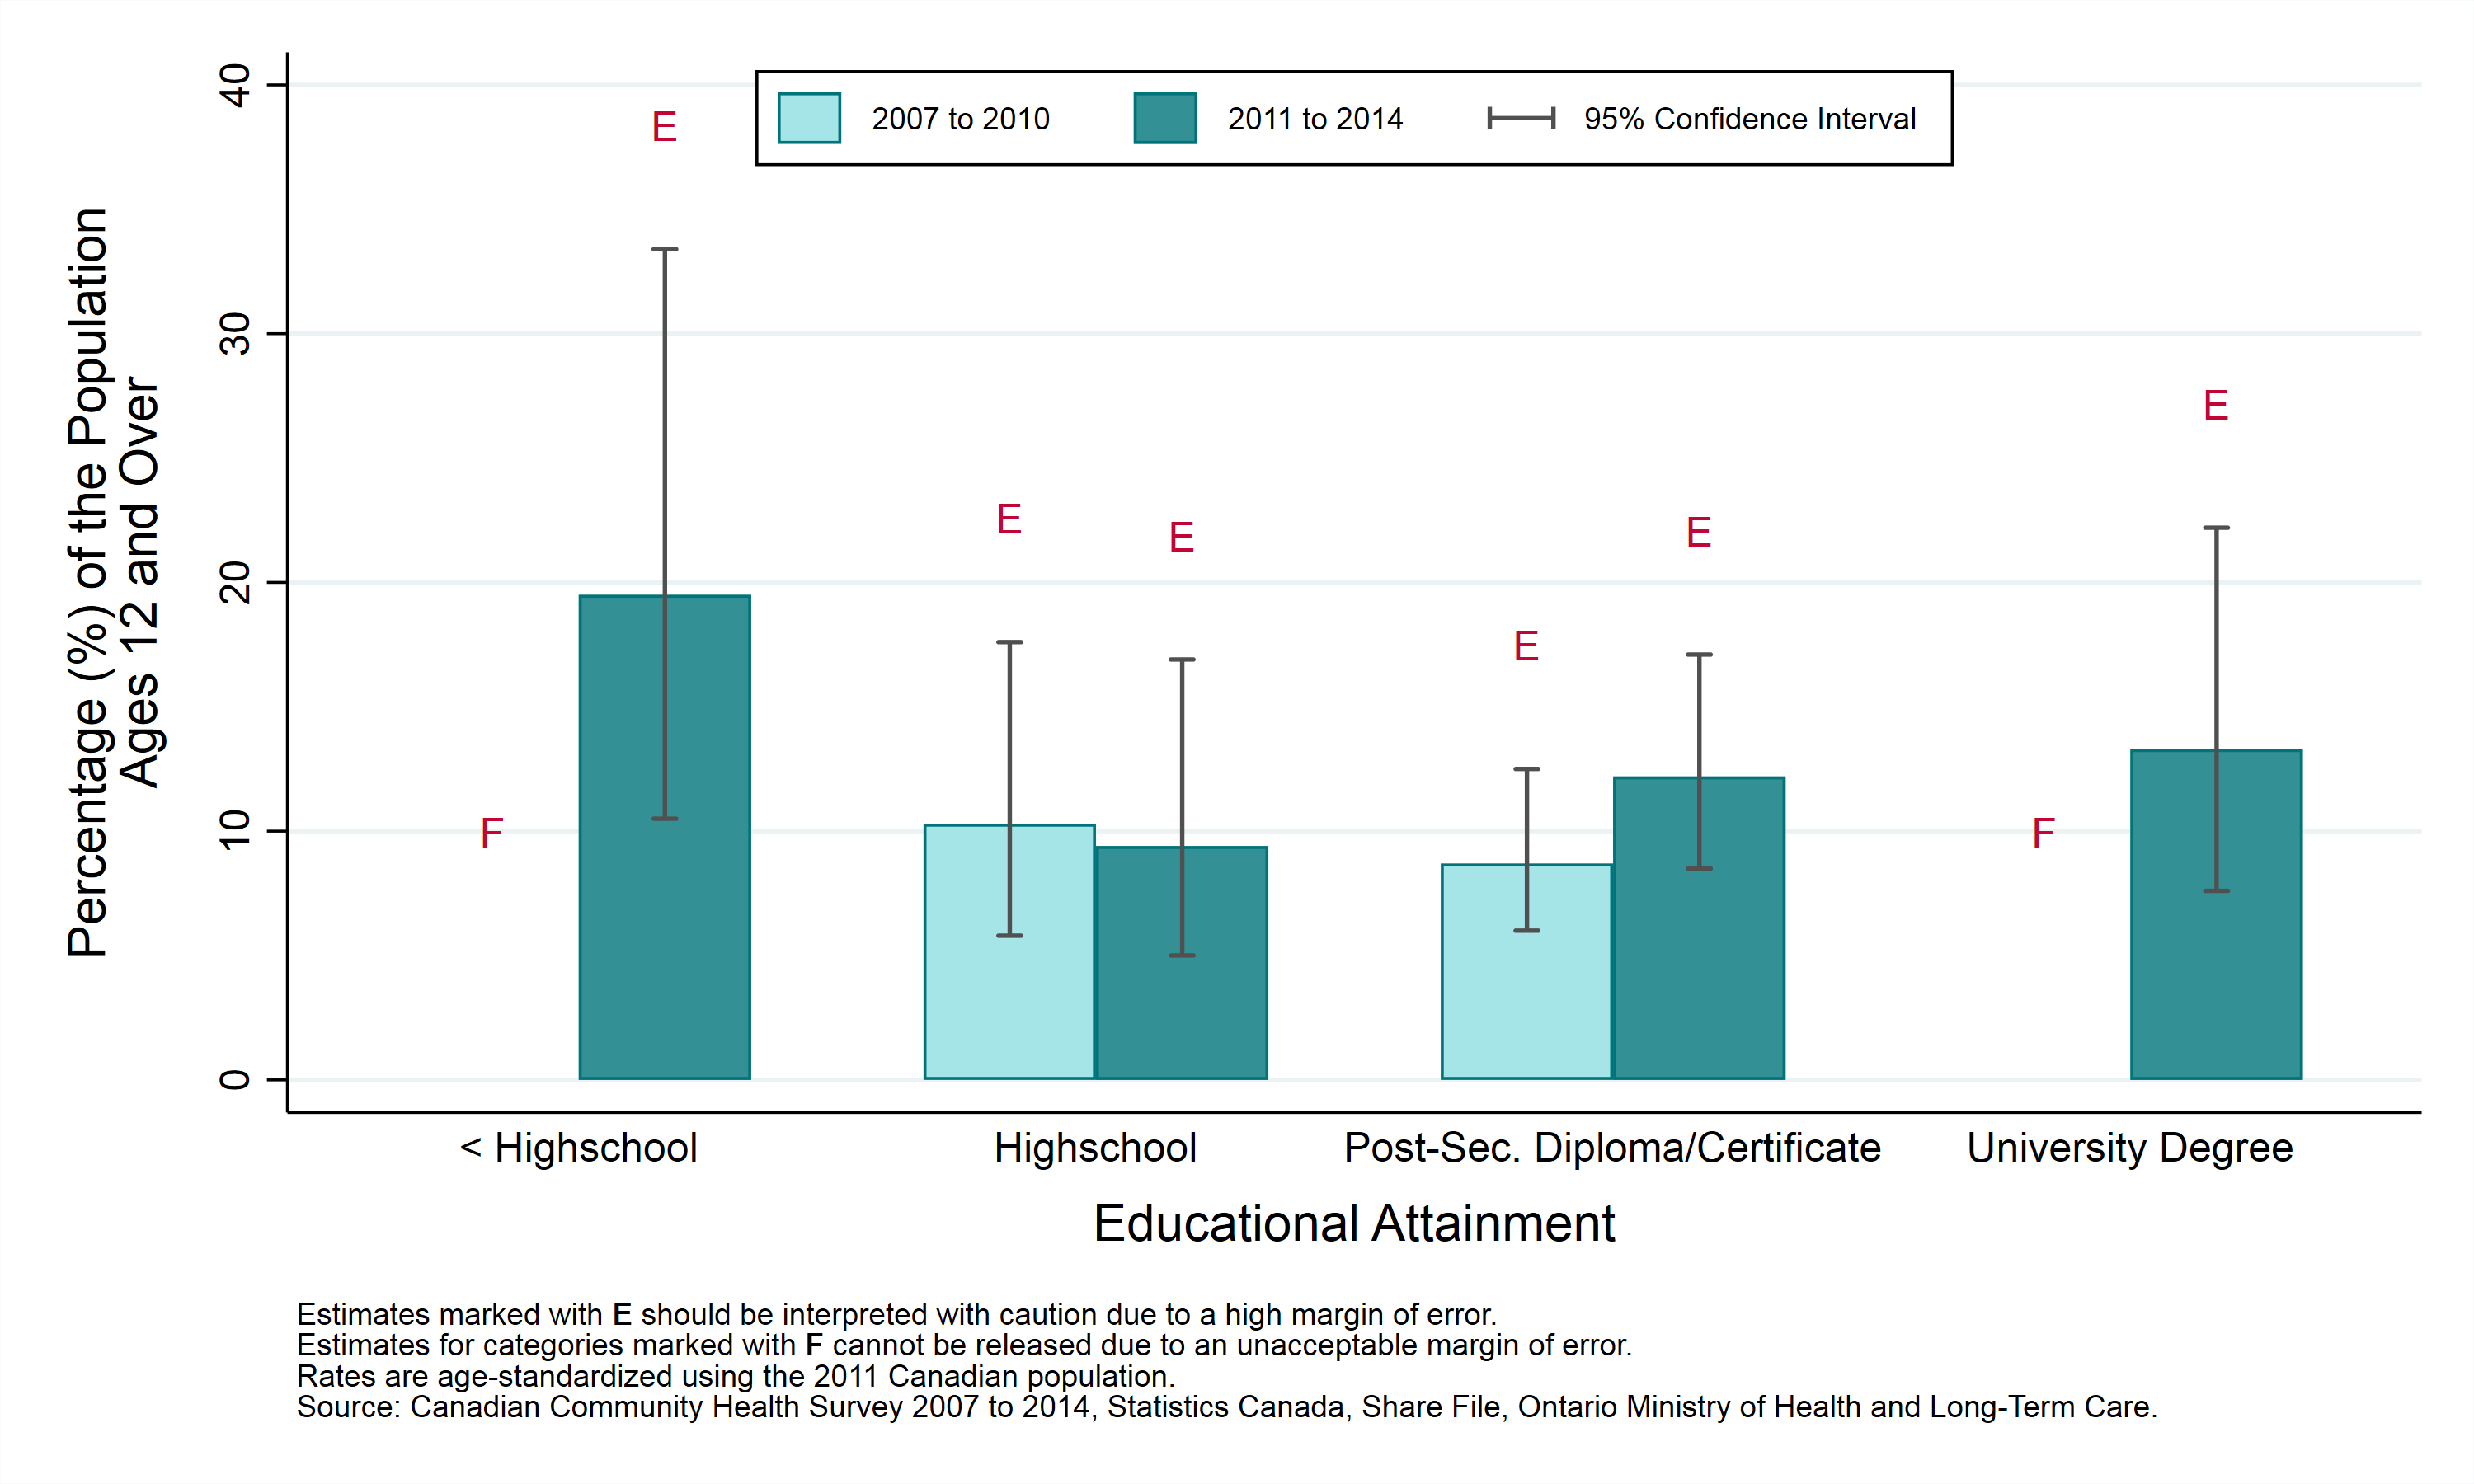
Table: Age-standardized prevalence rate, exposure to environmental tobacco smoke in public places, by year and education, ages 12+, 2007 to 2010, and 2011 to 2014
Note: Numbers followed by the letter “E” are to be interpreted with caution due to high sampling variability.
Numbers followed by the letter “F” have been suppressed due to high sampling variability.
| Education | Prevalence Rate, 2007 to 2010 | Prevalence Rate, 2011 to 2014 |
|---|---|---|
| < Highschool Diploma | F | 19.5% E (CI: 10.5% to 33.4%) |
| Highschool Diploma | 10.3% E (CI: 5.8% to 17.6%) | 9.4% E (CI: 5.0% to 16.9%) |
| Trade, College or University Diploma or Certificate | 8.7% E (CI: 6.0% to 12.5%) | 12.2% E (CI: 8.5% to 17.1%) |
| University Degree | F | 13.3% E (CI: 7.6% to 22.2%) |
Exposure to environmental tobacco smoke in public places by first official language spoken
Key findings:
- Between 2011 and 2014, survey results indicated that the prevalence rate of exposure to environmental tobacco smoke in public places was not statistically different between official language groups in Sudbury and districts.
- Between 2007 to 2010 and 2011 to 2014, the rate of exposure to environmental tobacco smoke in public places increased significantly among people whose first official language spoken was English. There was no statistical change in the rate among people whose first official language spoken included French.
Notes:
- Canada’s official languages are French and English. An individual’s “first official language spoken” is determined using their answers to a number of questions about the languages they speak. A small percentage of people are classified as having both French and English as their “first” official language spoken. Such individuals are included here as French. People speaking neither French nor English are excluded from this analysis.
- Rates are age-standardized using the 2011 Canadian population.
- Rates are for the population aged 12 years and older.
- Data source: Canadian Community Health Survey (CCHS), 2007 to 2014, Statistics Canada, Share File, Ontario Ministry of Health and Long-Term Care.
Figure: Age-standardized prevalence rate, exposure to environmental tobacco smoke in public places, by year and first official language spoken, ages 12+, 2007 to 2010 and 2011 to 2014
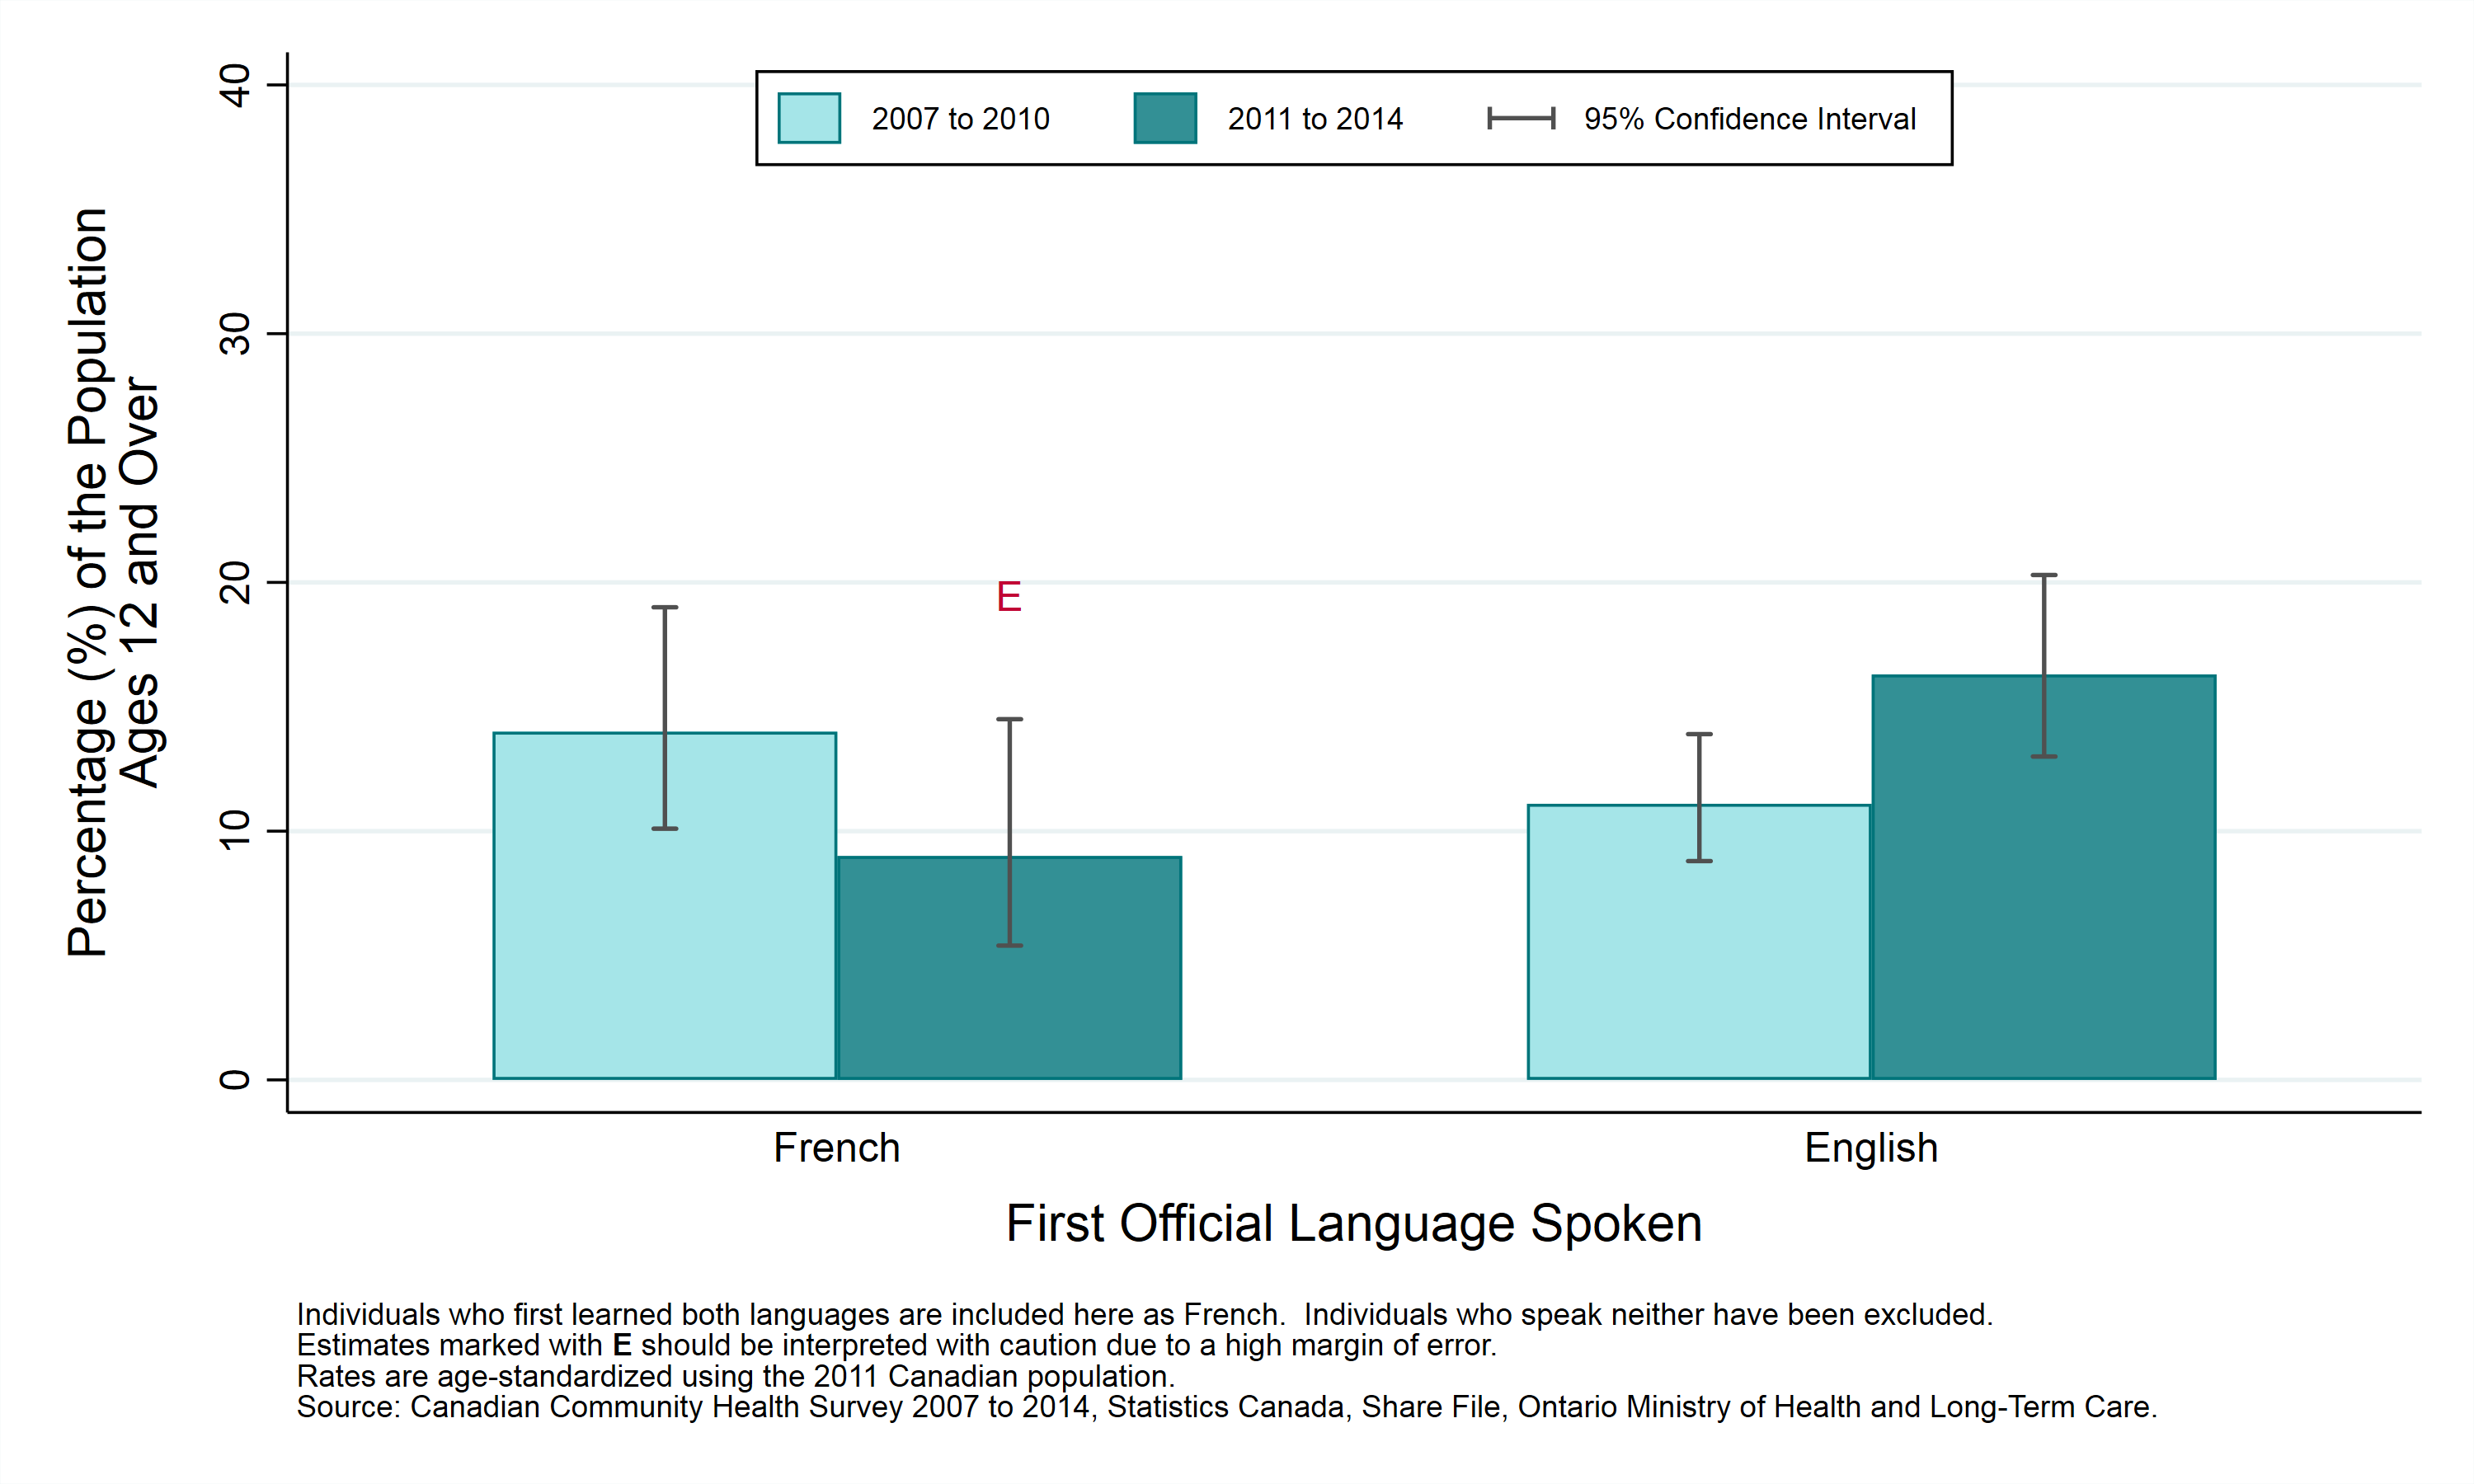
Table: Age-standardized prevalence rate, exposure to environmental tobacco smoke in public places, by year and first official language spoken, ages 12+, 2007 to 2010 and 2011 to 2014
Note: Numbers followed by the letter “E” are to be interpreted with caution due to high sampling variability.
| First Official Language Spoken | Prevalence Rate, 2007 to 2010 | Prevalence Rate, 2011 to 2014 |
|---|---|---|
| French | 14.0% (CI: 10.1% to 19.0%) | 9.0% E (CI: 5.4% to 14.5%) |
| English | 11.1% (CI: 8.8% to 13.9%) | 16.3% (CI: 13.0% to 20.3%) |
This item was last modified on April 12, 2024