Work stress
For the purpose of monitoring trends in work stress, individuals were classified based on their self-reported work stress into the following three categories: “not at all or not very stressful,” “a bit stressful,” or “quite or extremely stressful.”
Overall findings:
- In 2015/16, survey results indicated that 32% of individuals ages 15 and over in Sudbury and districts rated their work stress as not at all or not very stressful, 43% rated their work stress as a bit stressful, while 25% rated their work stress as quite or extremely stressful.
- Between 2007/08 and 2013/14, the prevalence rate of quite or extremely stressful work stress in Sudbury and districts has not varied significantly.
Notes:
- Rates are age-standardized using the 2011 Canadian population.
- Rates are for the population aged 15 years and older.
- Data source: Canadian Community Health Survey (CCHS), 2007 to 2016, Statistics Canada, Share File, Ontario Ministry of Health and Long-Term Care.
Figure: Age-standardized prevalence rate, work stress, Sudbury and districts, ages 15+, 2015/2016
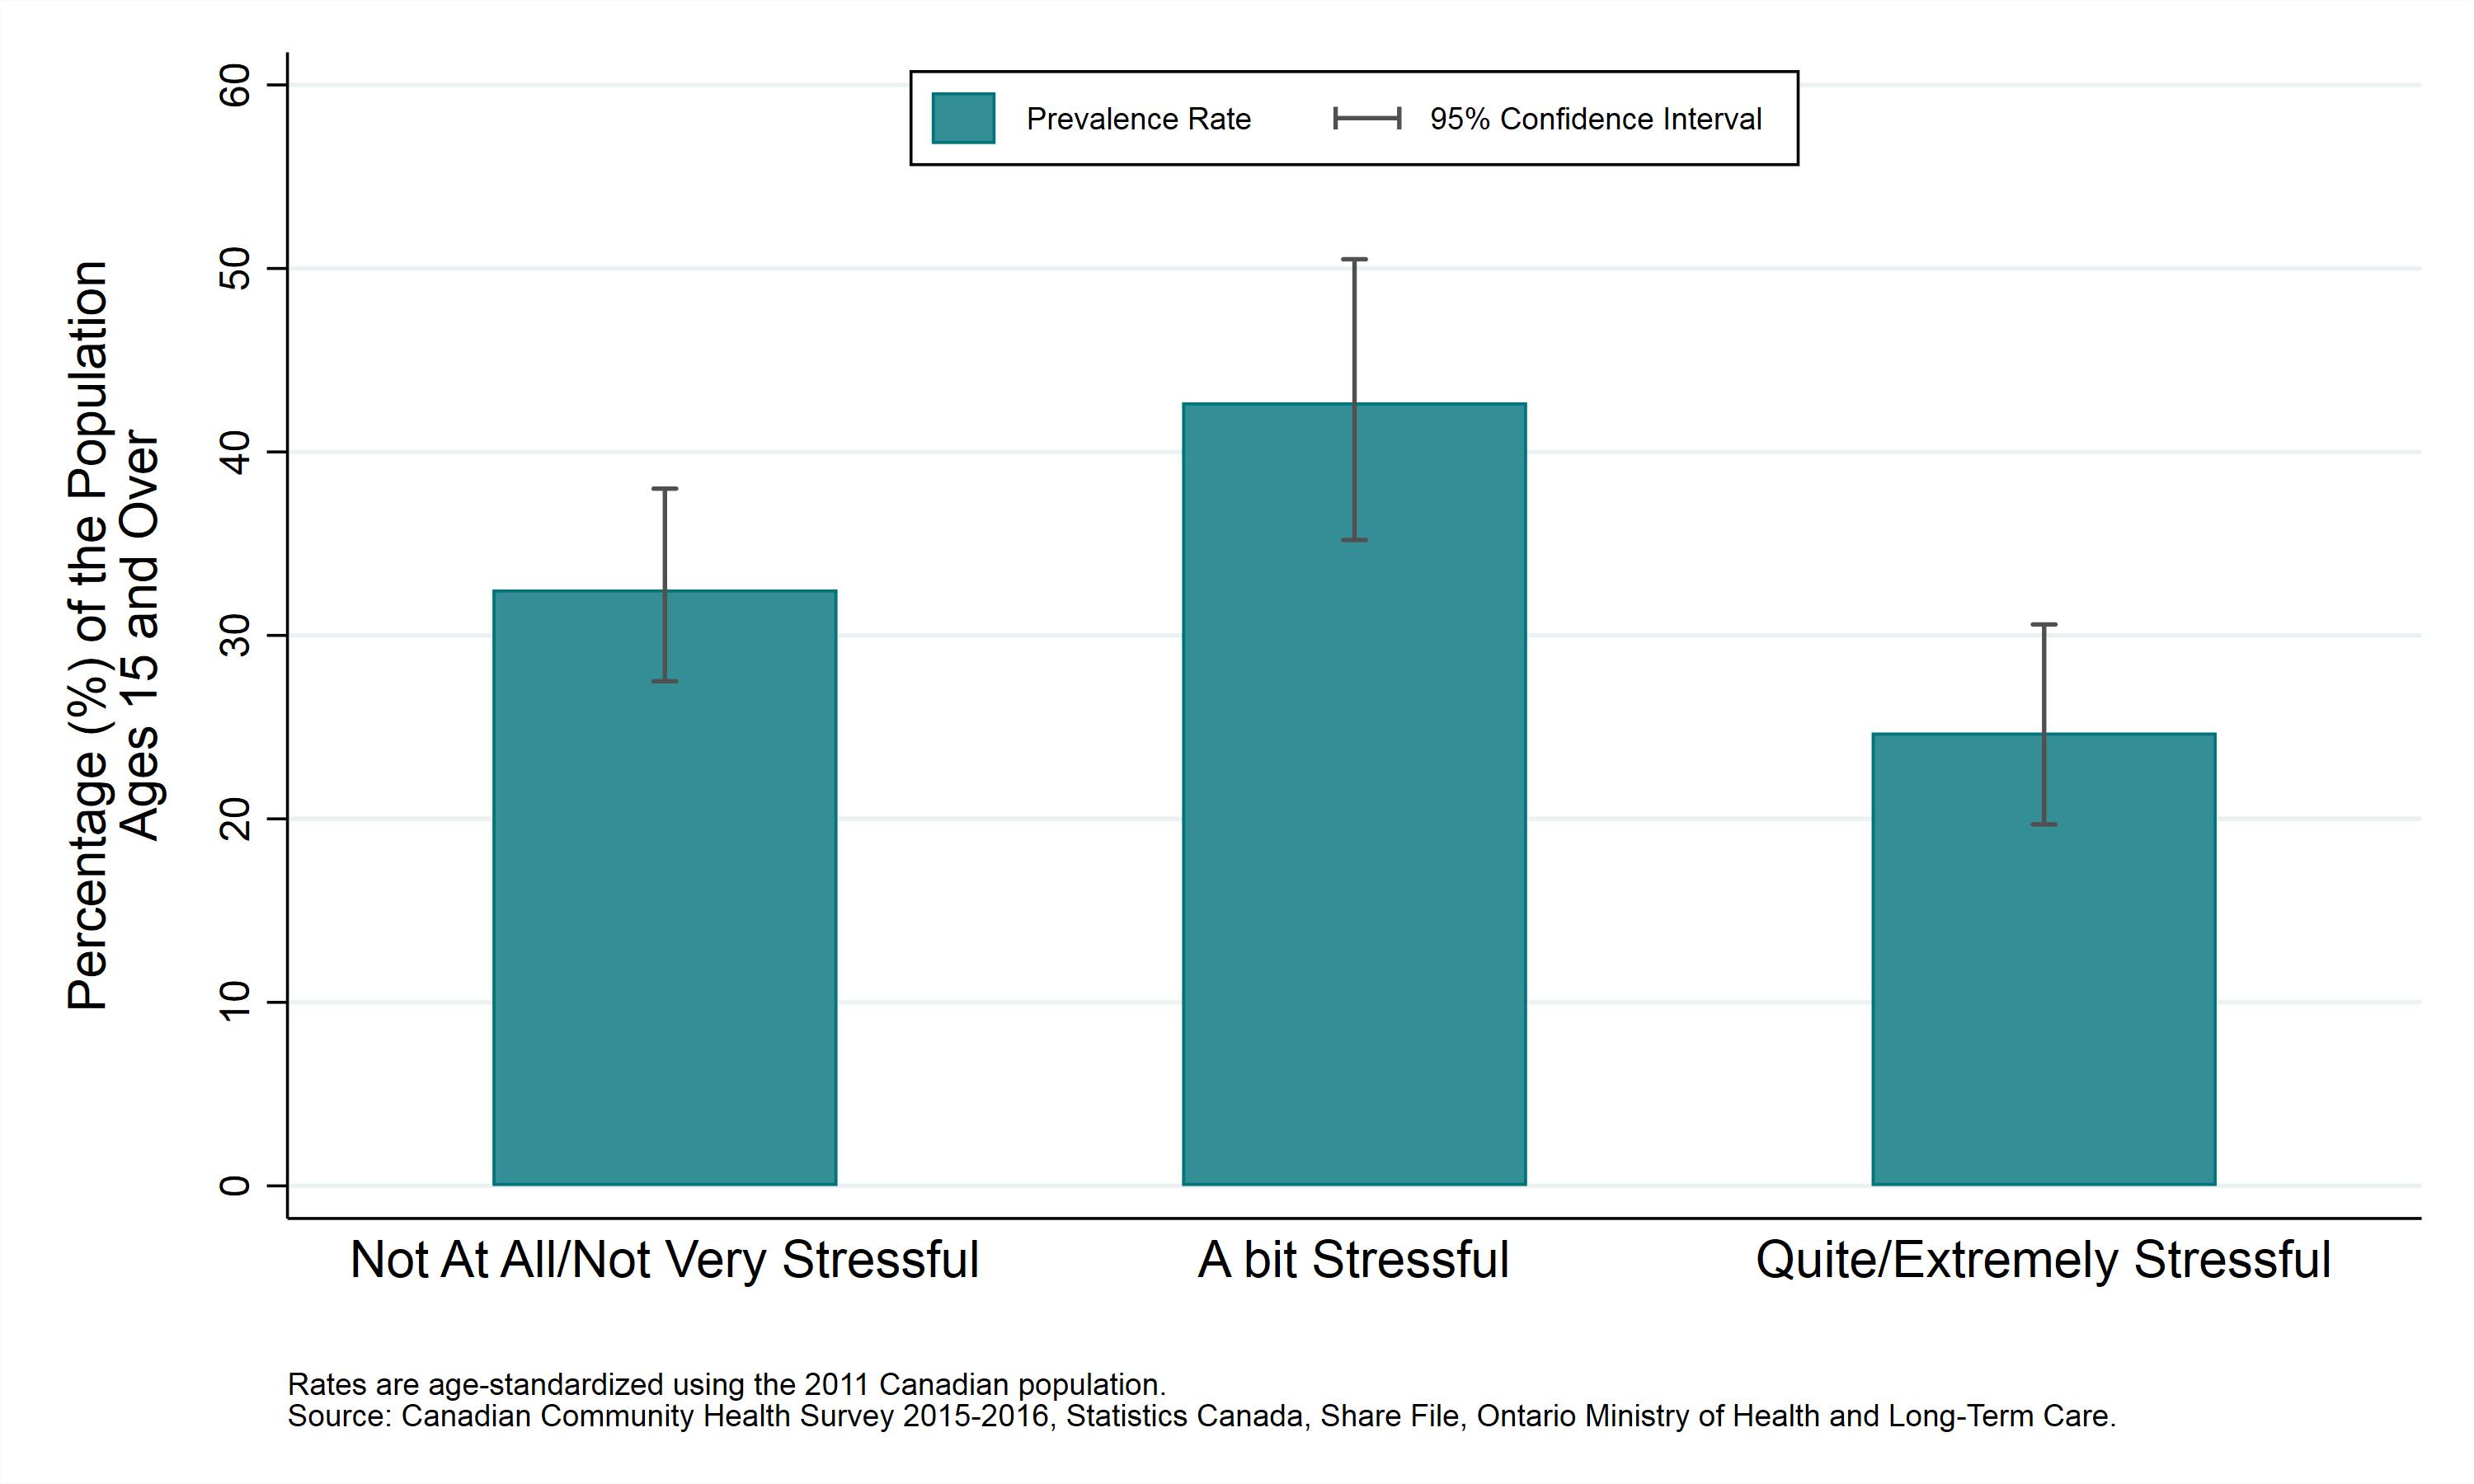
Table: Age-standardized prevalence rate, work stress, Sudbury and districts, ages 15+, 2015/2016
| Self-Rated Mental Health | Prevalence Rate |
|---|---|
| Not At All/Not Very Stressful | 32.5% (CI: 27.5% to 38.0%) |
| A bit Stressful | 42.7% (CI: 35.2% to 50.5%) |
| Quite/Extremely Stressful | 24.7% (CI: 19.7% to 30.6%) |
Work stress (quite or extremely stressful)
Work stress (quite or extremely stressful) by geographic area
Key findings:
- In 2013/14, survey results indicated that 24% of individuals aged 15 years and older in Sudbury and districts rated their work stress as quite or extremely stressful.
- The prevalence rate of quite or extremely stressful work stress in Sudbury and districts is similar to that reported in northeastern Ontario and Ontario overall.
- Between 2007/08 and 2013/14, the prevalence rate of quite or extremely stressful work stress in Sudbury and districts has not varied significantly.
Notes:
- Rates are age-standardized using the 2011 Canadian population.
- Rates are for the population aged 15 years and older.
- Data source: Canadian Community Health Survey (CCHS), 2007 to 2014, Statistics Canada, Share File, Ontario Ministry of Health and Long-Term Care.
Figure: Age-standardized prevalence rate, work stress (quite or extremely stressful), by year and geographic area, ages 15+, 2007/08 to 2013/14
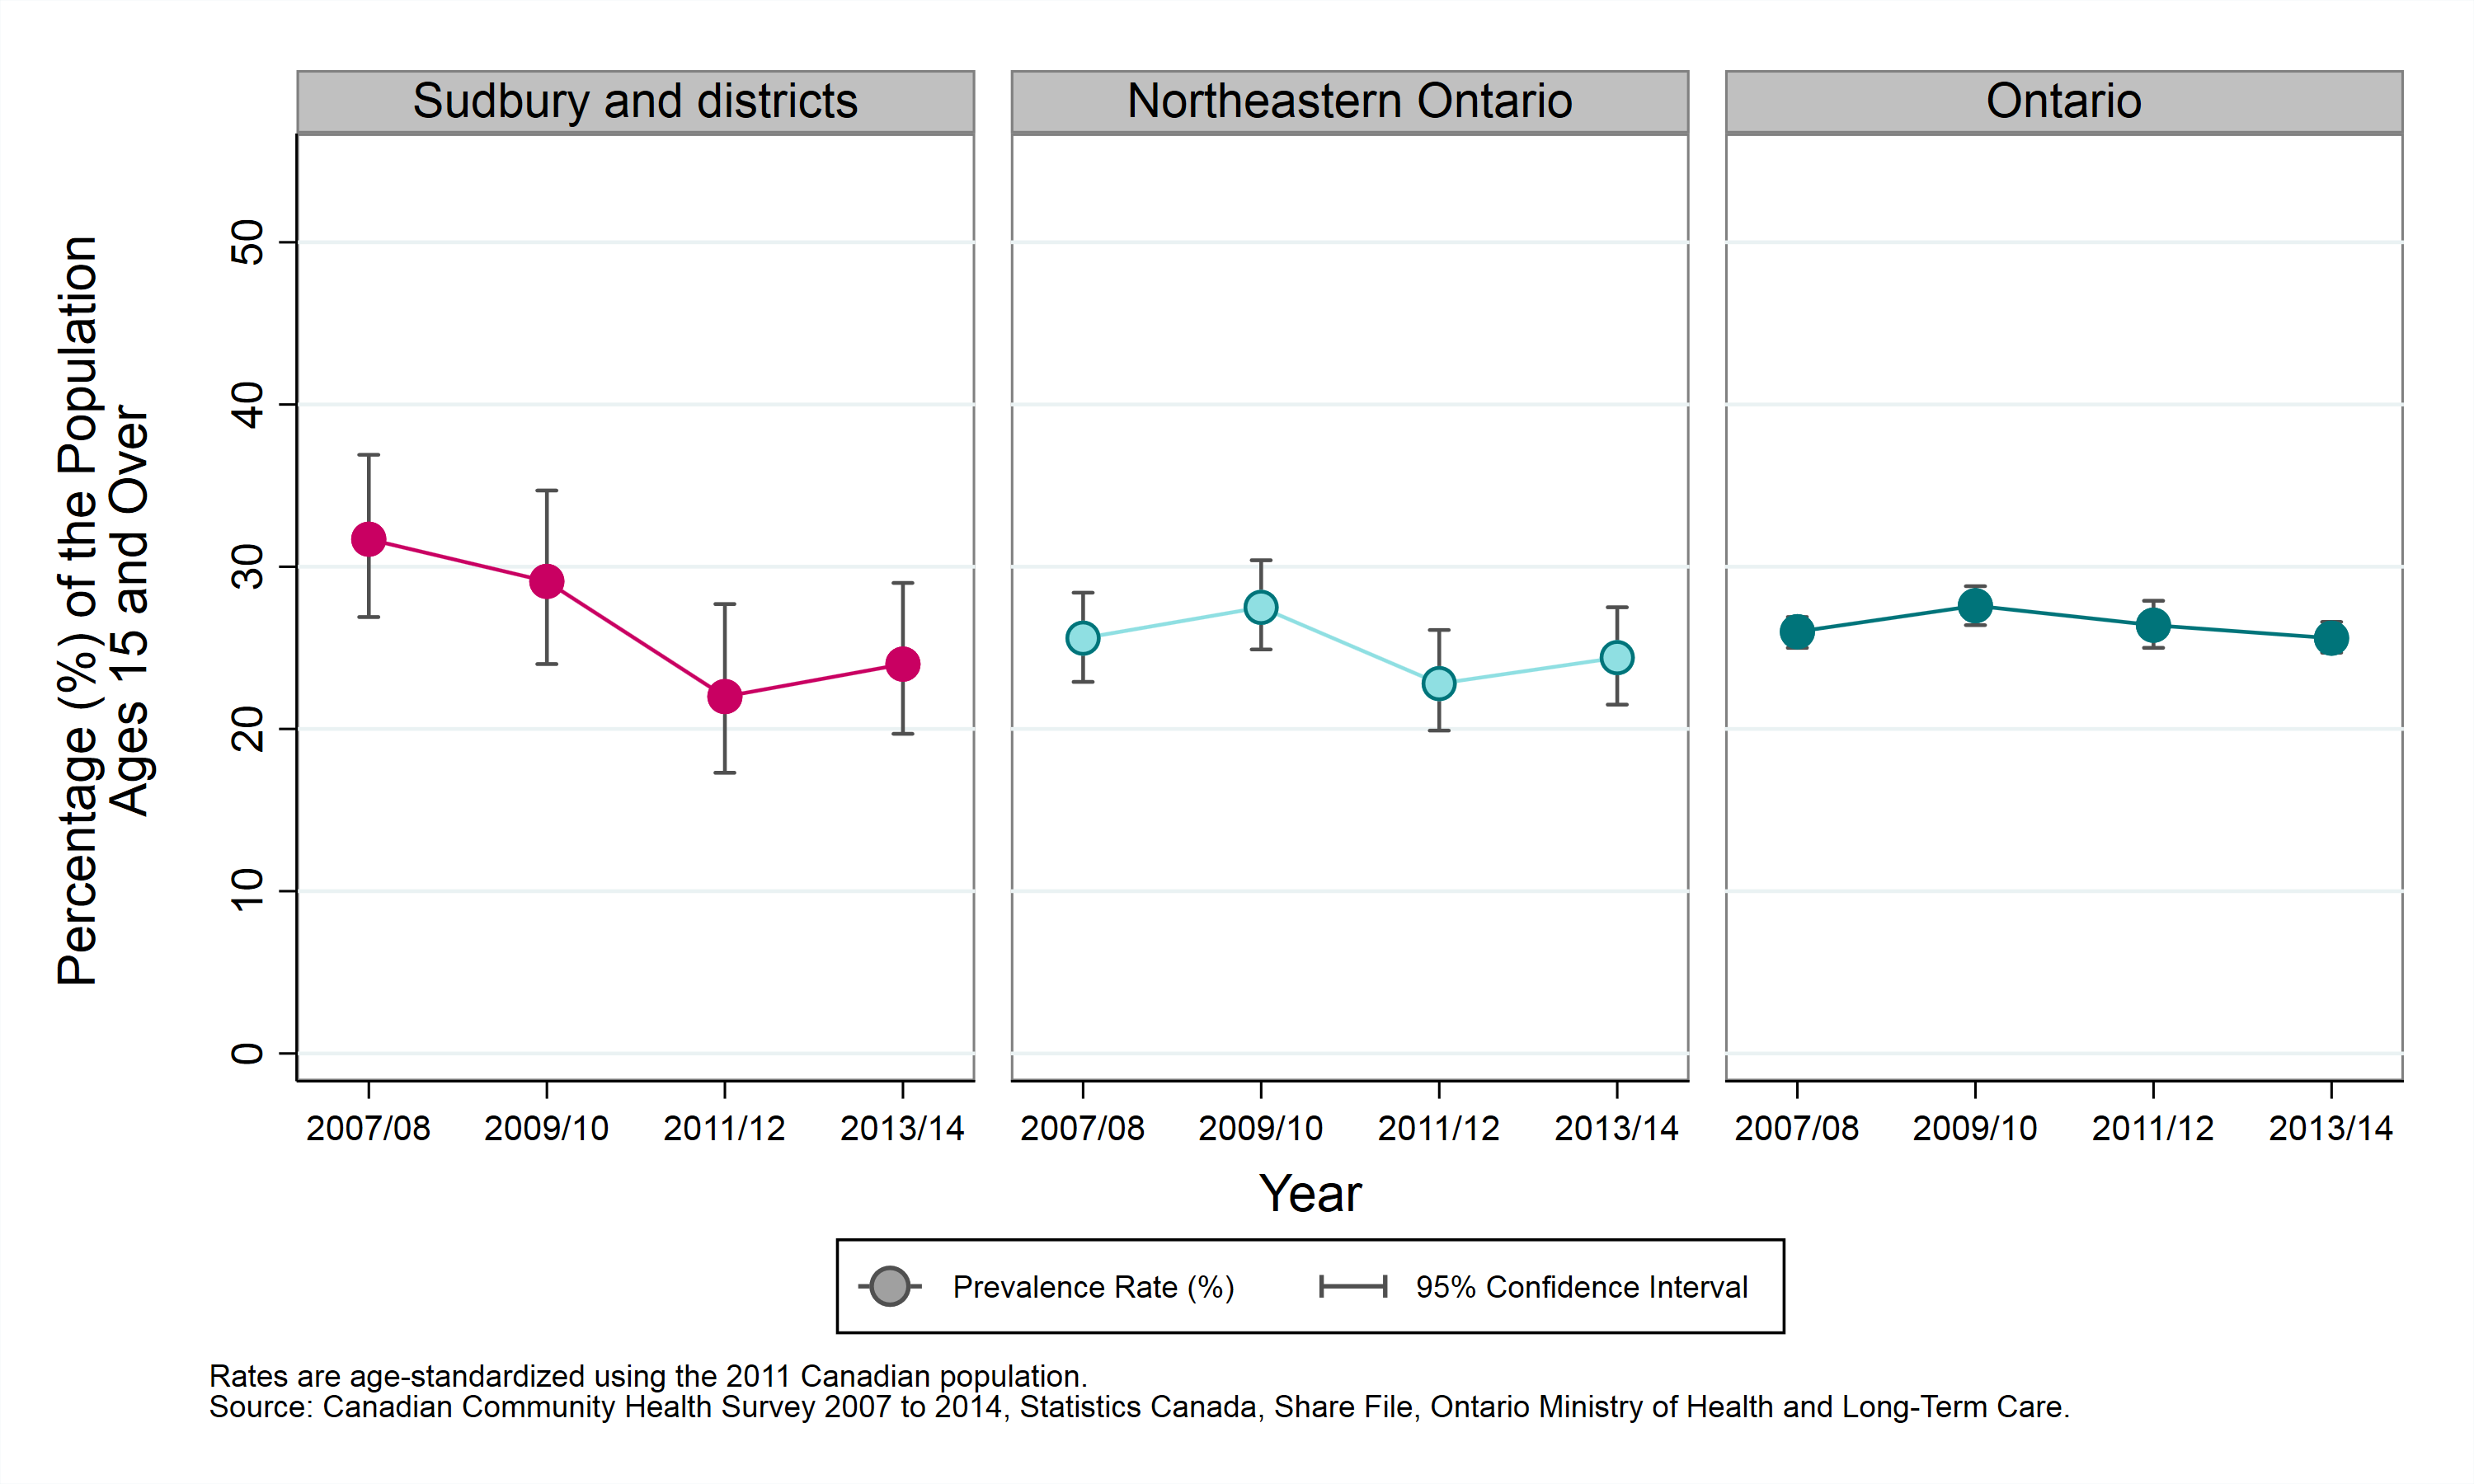
Table: Age-standardized prevalence rate, work stress (quite or extremely stressful), by year and geographic area, ages 15+, 2007/08 to 2013/14
| Geographic Region | Prevalence Rate, 2007 to 2008 | Prevalence Rate, 2009 to 2010 | Prevalence Rate, 2011 to 2012 | Prevalence Rate, 2013 to 2014 |
|---|---|---|---|---|
| Sudbury and districts | 31.7% (CI: 26.9% to 36.9%) | 29.1% (CI: 24.0% to 34.7%) | 22.0% (CI: 17.3% to 27.7%) | 24.0% (CI: 19.7% to 29.0%) |
| Northeastern Ontario | 25.6% (CI: 22.9% to 28.4%) | 27.5% (CI: 24.9% to 30.4%) | 22.8% (CI: 19.9% to 26.1%) | 24.4% (CI: 21.5% to 27.5%) |
| Ontario | 26.0% (CI: 25.0% to 26.9%) | 27.6% (CI: 26.4% to 28.8%) | 26.4% (CI: 25.0% to 27.9%) | 25.6% (CI: 24.7% to 26.6%) |
Work stress (quite or extremely stressful) by sex
Key findings:
- Between 2011 and 2014, survey results indicated that the prevalence rate of quite or extremely stressful work stress in males in Sudbury and districts has been similar to that in females.
- Between 2007 to 2010 and 2011 to 2014, the rate of quite or extremely stressful work stress in Sudbury and districts has not varied significantly in either males or females.
Notes:
- Rates are age-standardized using the 2011 Canadian population.
- Rates are for the population aged 15 years and older.
- Data source: Canadian Community Health Survey (CCHS), 2007 to 2014, Statistics Canada, Share File, Ontario Ministry of Health and Long-Term Care.
Figure: Age-standardized prevalence rate, work stress (quite or extremely stressful), by year and sex, ages 15+, 2007 to 2010 and 2011 to 2014
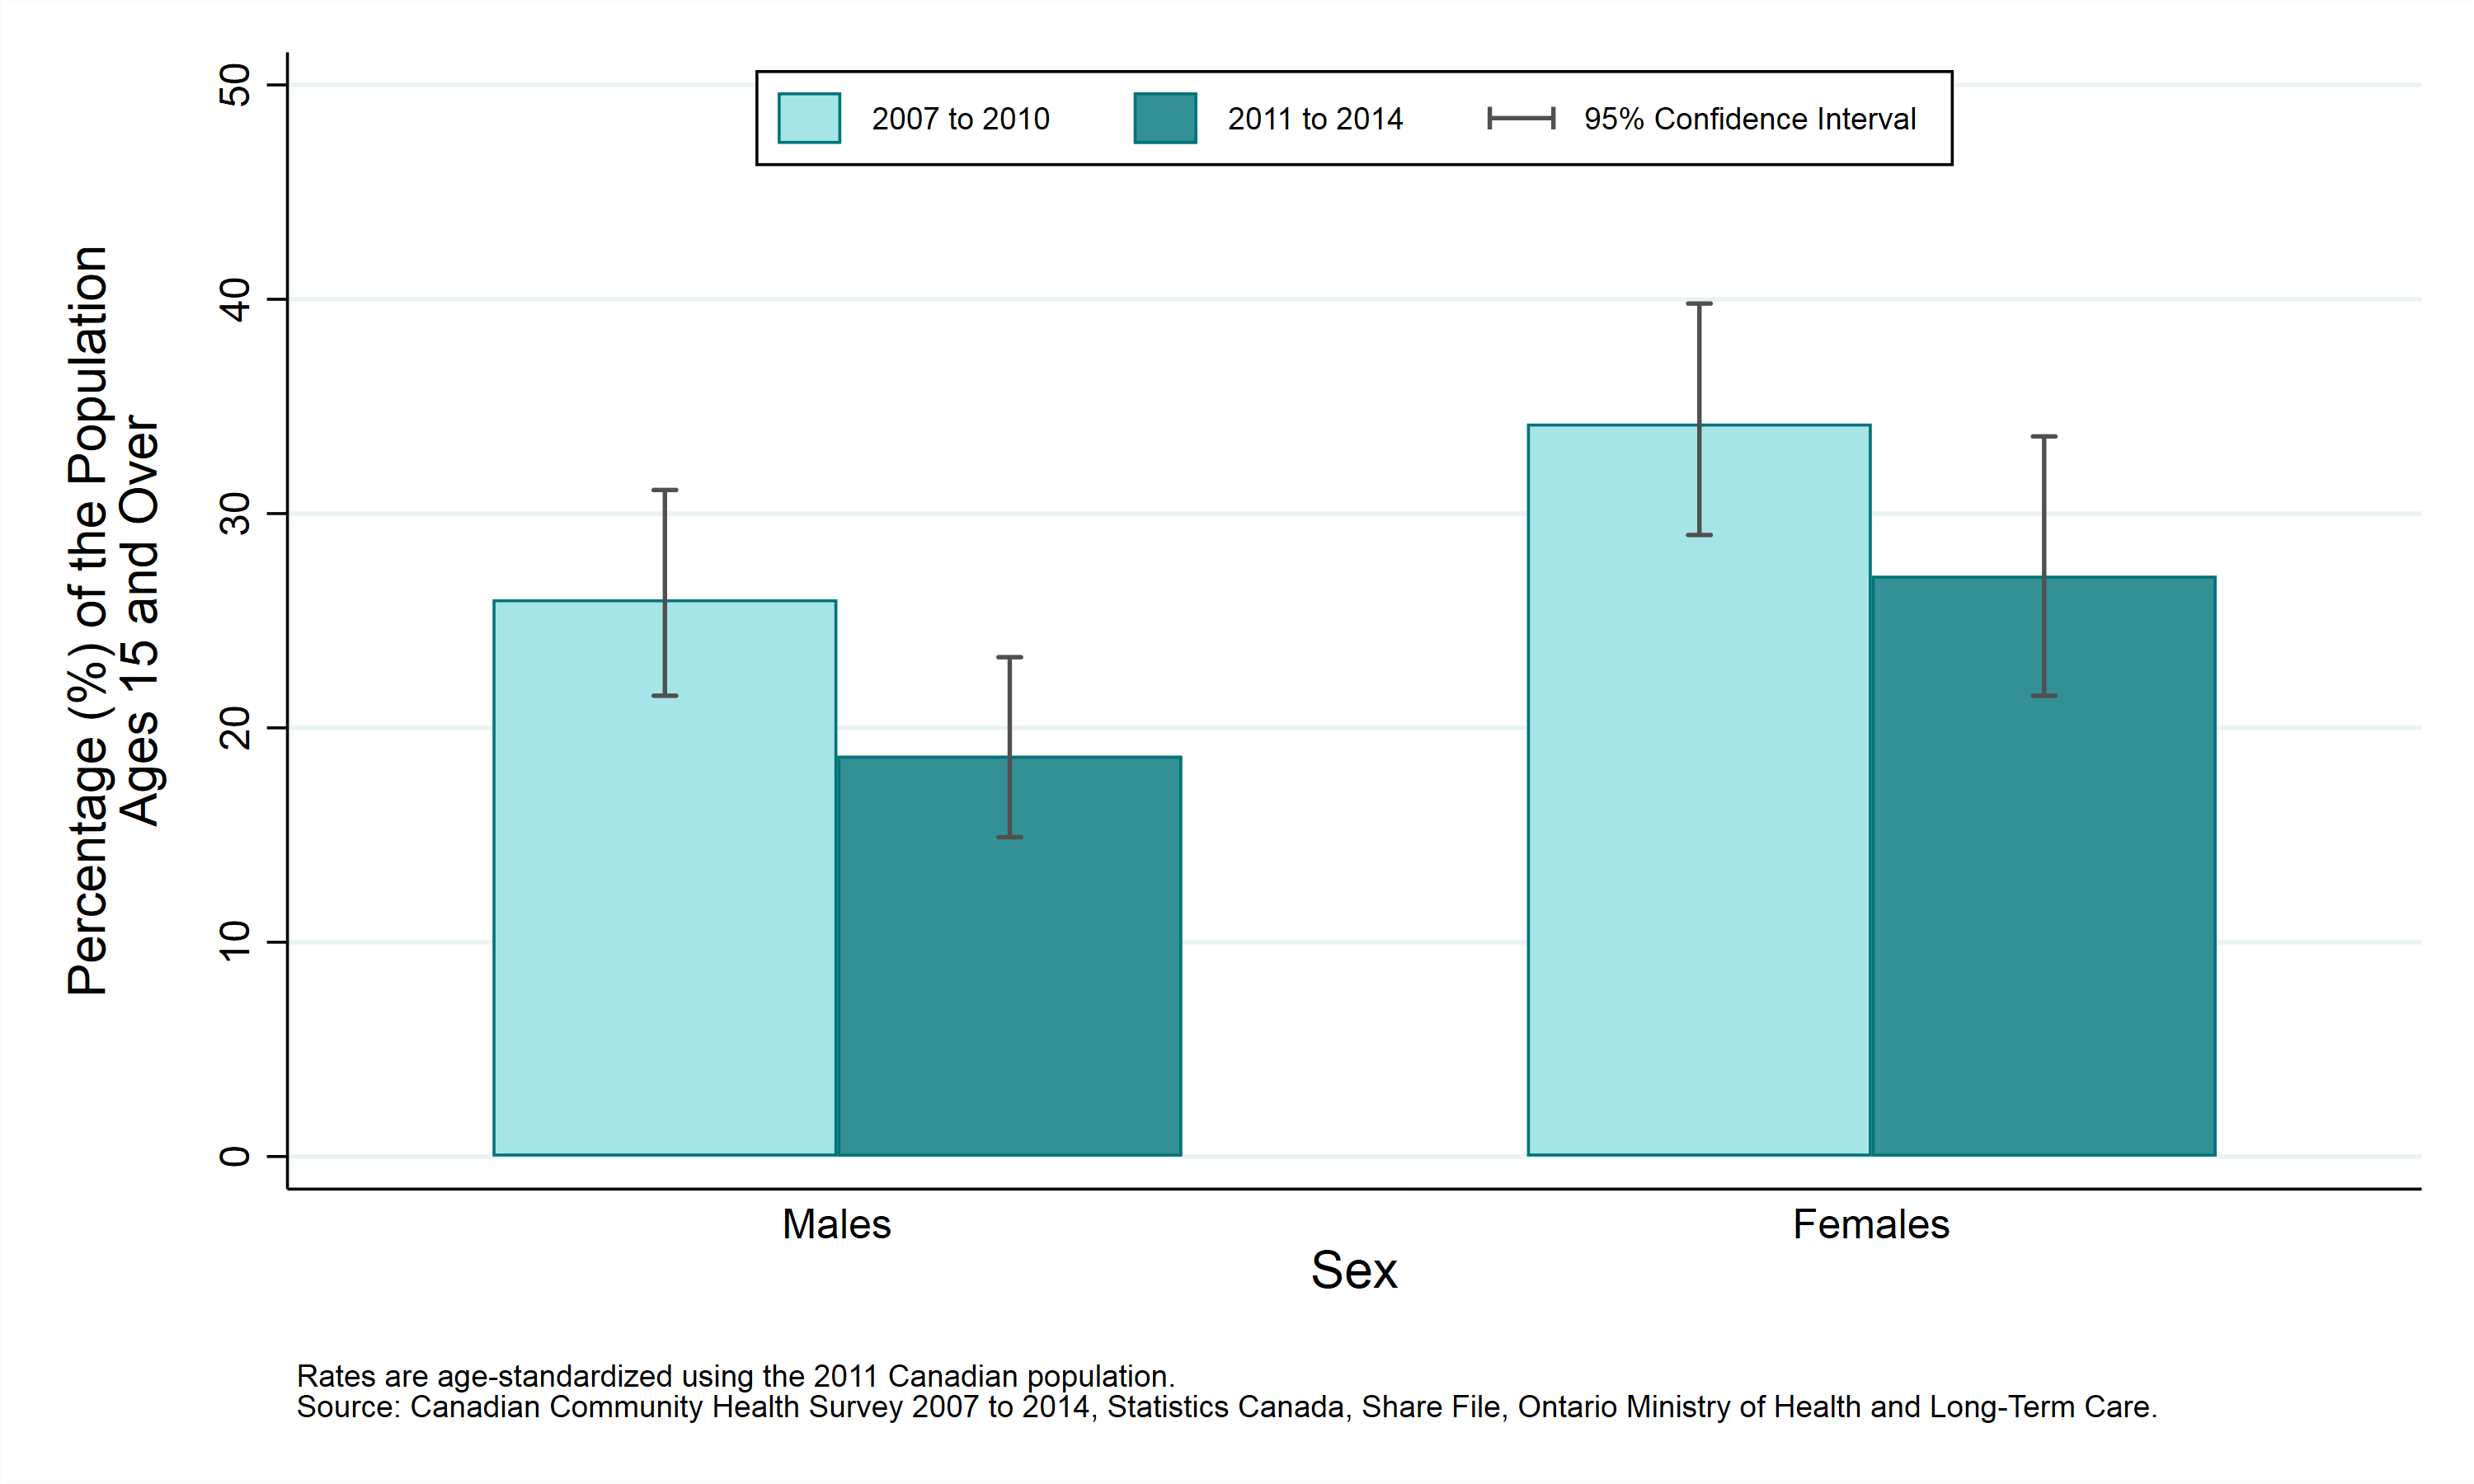
Table: Age-standardized prevalence rate, work stress (quite or extremely stressful), by year and sex, ages 15+, 2007 to 2010 and 2011 to 2014
| Sex | Prevalence Rate, 2007 to 2010 | Prevalence Rate, 2011 to 2014 |
|---|---|---|
| Males | 26.0% (CI: 21.5% to 31.1%) | 18.7% (CI: 14.9% to 23.3%) |
| Females | 34.2% (CI: 29.0% to 39.8%) | 27.1% (CI: 21.5% to 33.6%) |
Work stress (quite or extremely stressful) by age group
Key findings:
- Between 2011 and 2014, survey results indicated that the prevalence rate of quite or extremely stressful work stress was higher in 25 to 64 age group in Sudbury and districts.
- Between 2007 to 2010 and 2011 to 2014, the rate of quite or extremely stressful work stress in Sudbury and districts has not varied significantly in any of the age groups.
Notes:
- Rates are for the population aged 15 years and older.
- Data source: Canadian Community Health Survey (CCHS), 2007 to 2014, Statistics Canada, Share File, Ontario Ministry of Health and Long-Term Care.
Figure: Prevalence rate, work stress (quite or extremely stressful), by year and age group, ages 15+, 2007 to 2010 and 2011 to 2014
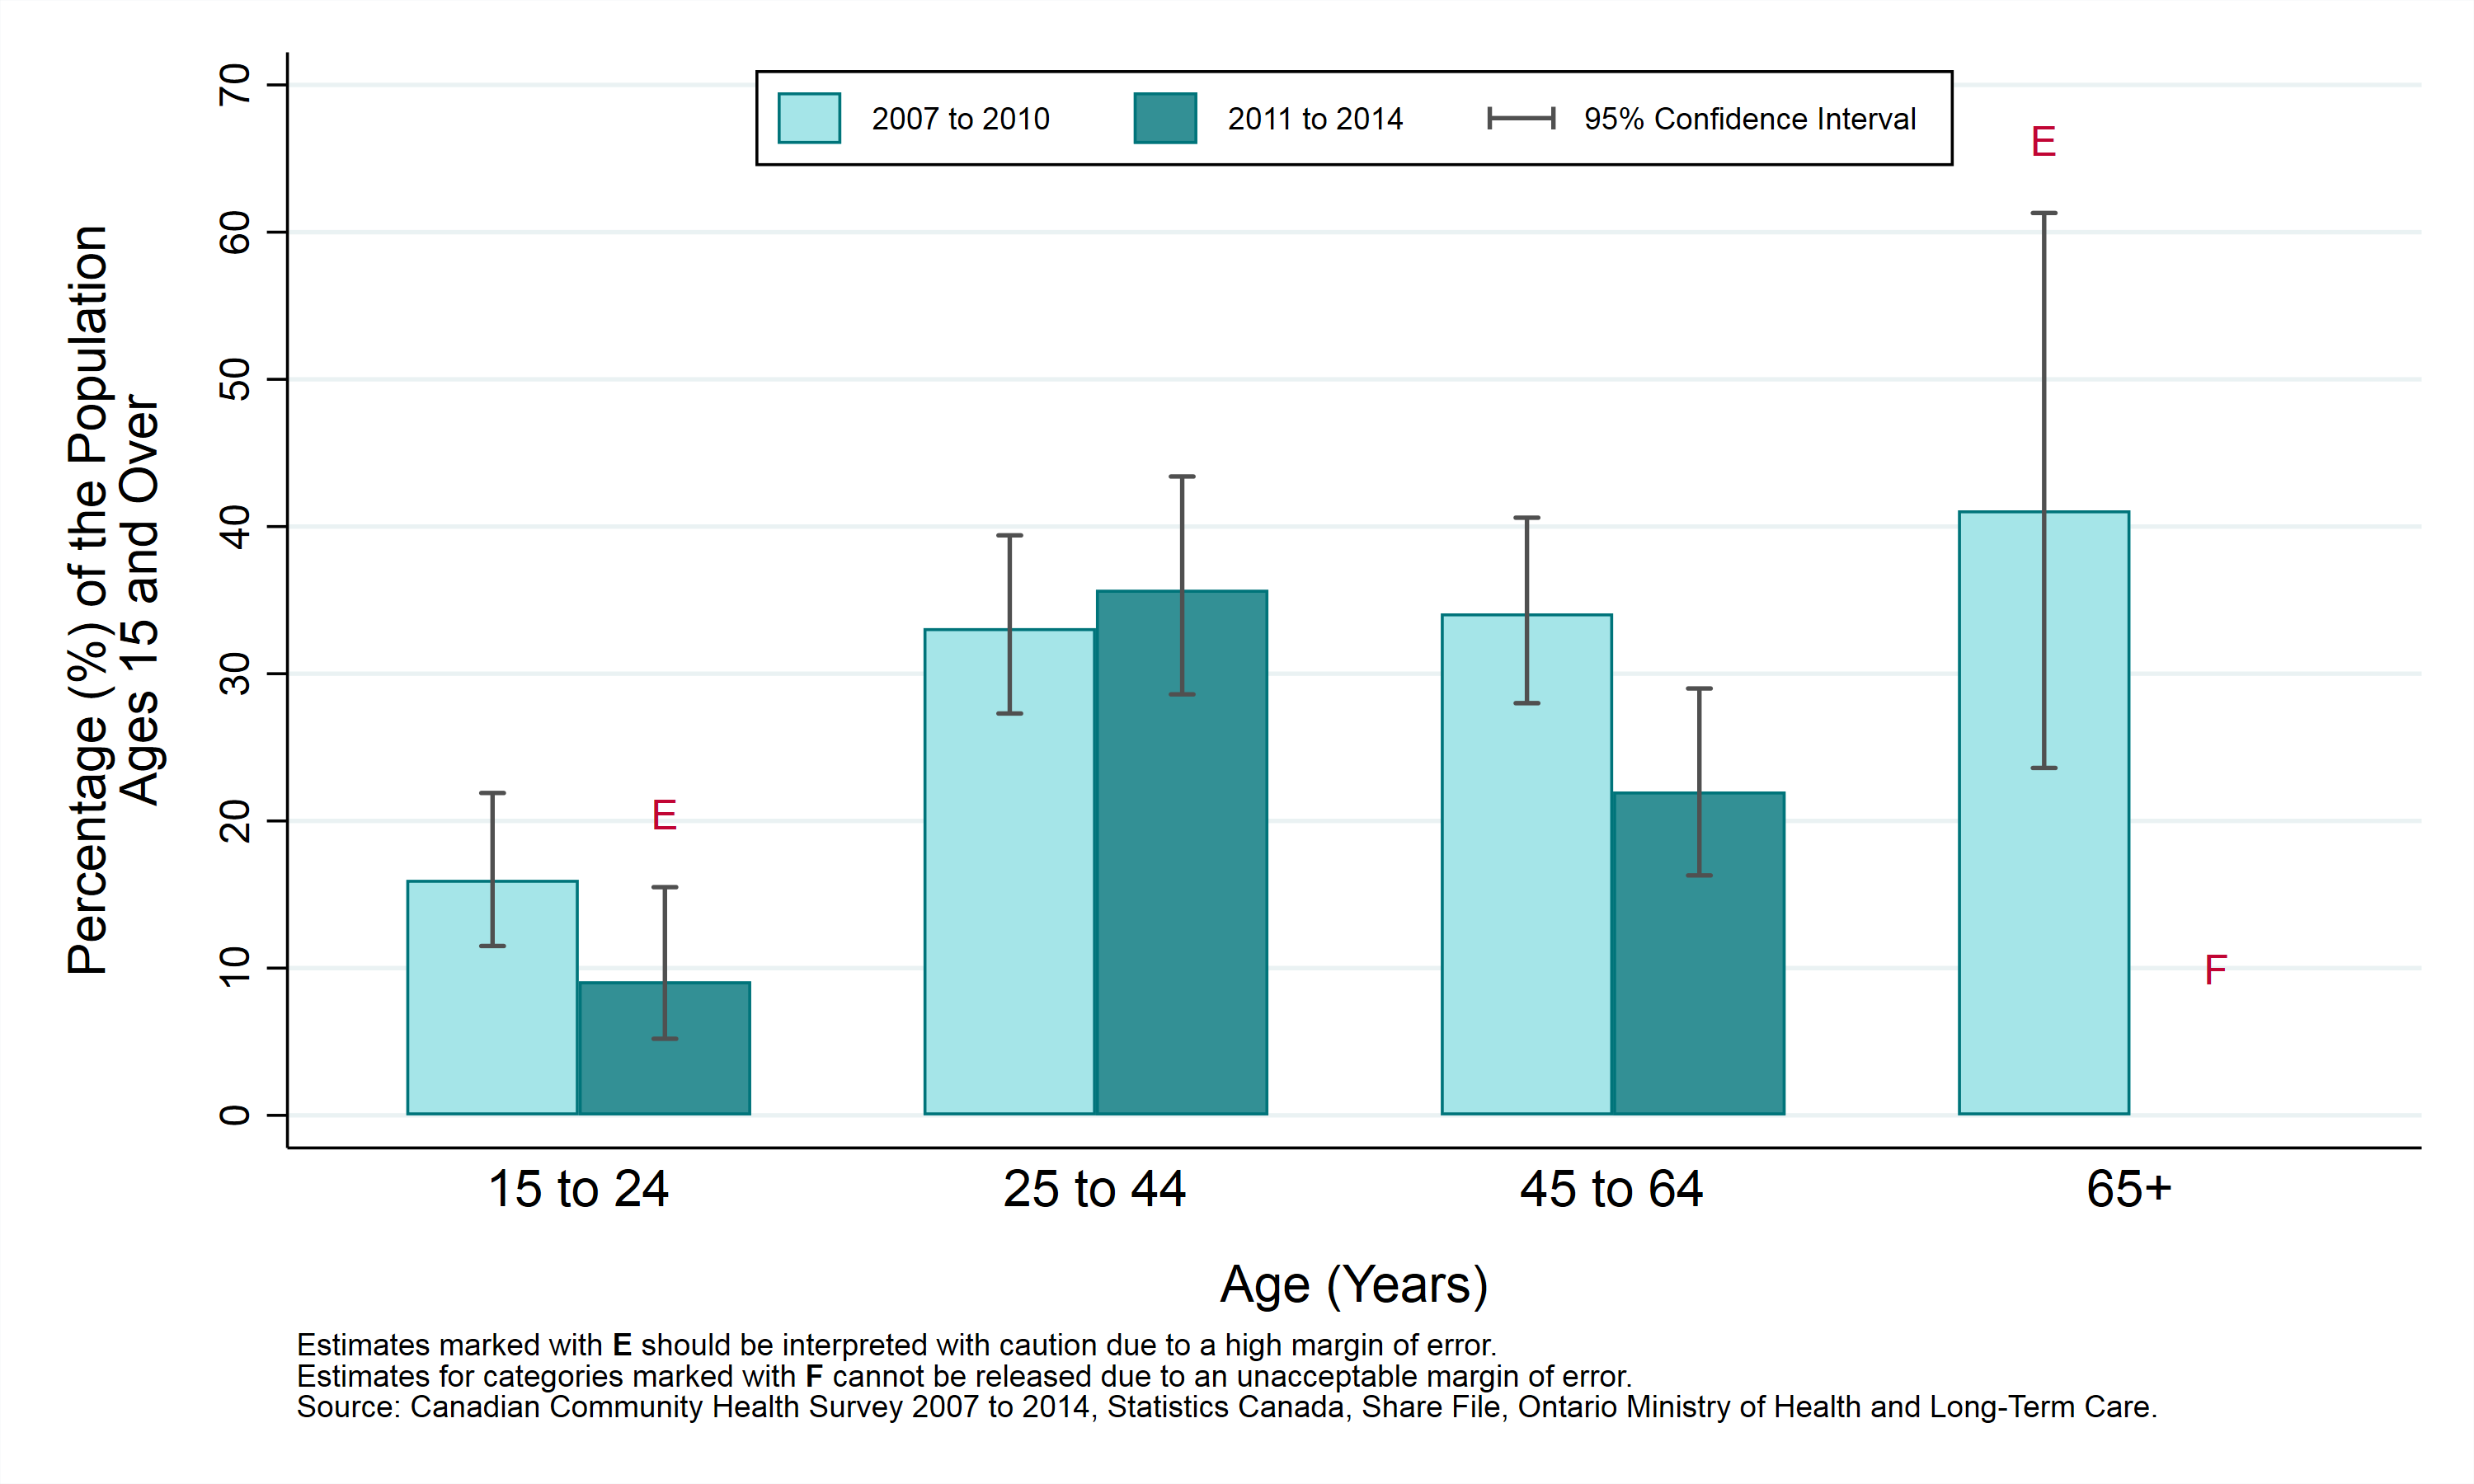
Table: Prevalence rate, work stress (quite or extremely stressful), by year and age group, ages 15+, 2007 to 2010 and 2011 to 2014
Note: Estimates marked with E should be interpreted with caution due to high margin of error. Estimates for categories marked with F cannot be released due to an unacceptable margin of error.
| Age (Years) | Prevalence Rate, 2007 to 2010 | Prevalence Rate, 2011 to 2014 |
|---|---|---|
| 15 to 24 | 16.0% (CI: 11.5% to 21.9%) | 9.1% E (CI: 5.2% to 15.5%) |
| 25 to 44 | 33.1% (CI: 27.3% to 39.4%) | 35.7% (CI: 28.6% to 43.4%) |
| 45 to 64 | 34.1% (CI: 28.0% to 40.6%) | 22.0% (CI: 16.3% to 29.0%) |
| 65+ | 41.1% E (CI: 23.6% to 61.3%) | F |
Work stress (quite or extremely stressful) by household income
Key findings:
- Between 2011 and 2014, survey results indicated that the prevalence rate of quite or extremely stressful work stress was not statistically different among income groups in Sudbury and districts.
- Between 2007 to 2010 and 2011 to 2014, the rate of quite or extremely stressful work stress in Sudbury and districts has not varied significantly in any of the household income quintiles.
Notes:
- In this analysis, individuals are divided into “income quintiles” or 5 groups of roughly equal size based on their reported household income. The groups are ranked, so that Quintile 1 represents the 20% of the population with the lowest incomes, and Quintile 5 represents the 20% with the highest incomes.
- Rates are age-standardized using the 2011 Canadian population.
- Rates are for the population aged 15 years and older.
- Data source: Canadian Community Health Survey (CCHS), 2007 to 2014, Statistics Canada, Share File, Ontario Ministry of Health and Long-Term Care.
Figure: Prevalence rate, work stress (quite or extremely stressful), by year and household income, ages 15+, 2007 to 2010 and 2011 to 2014
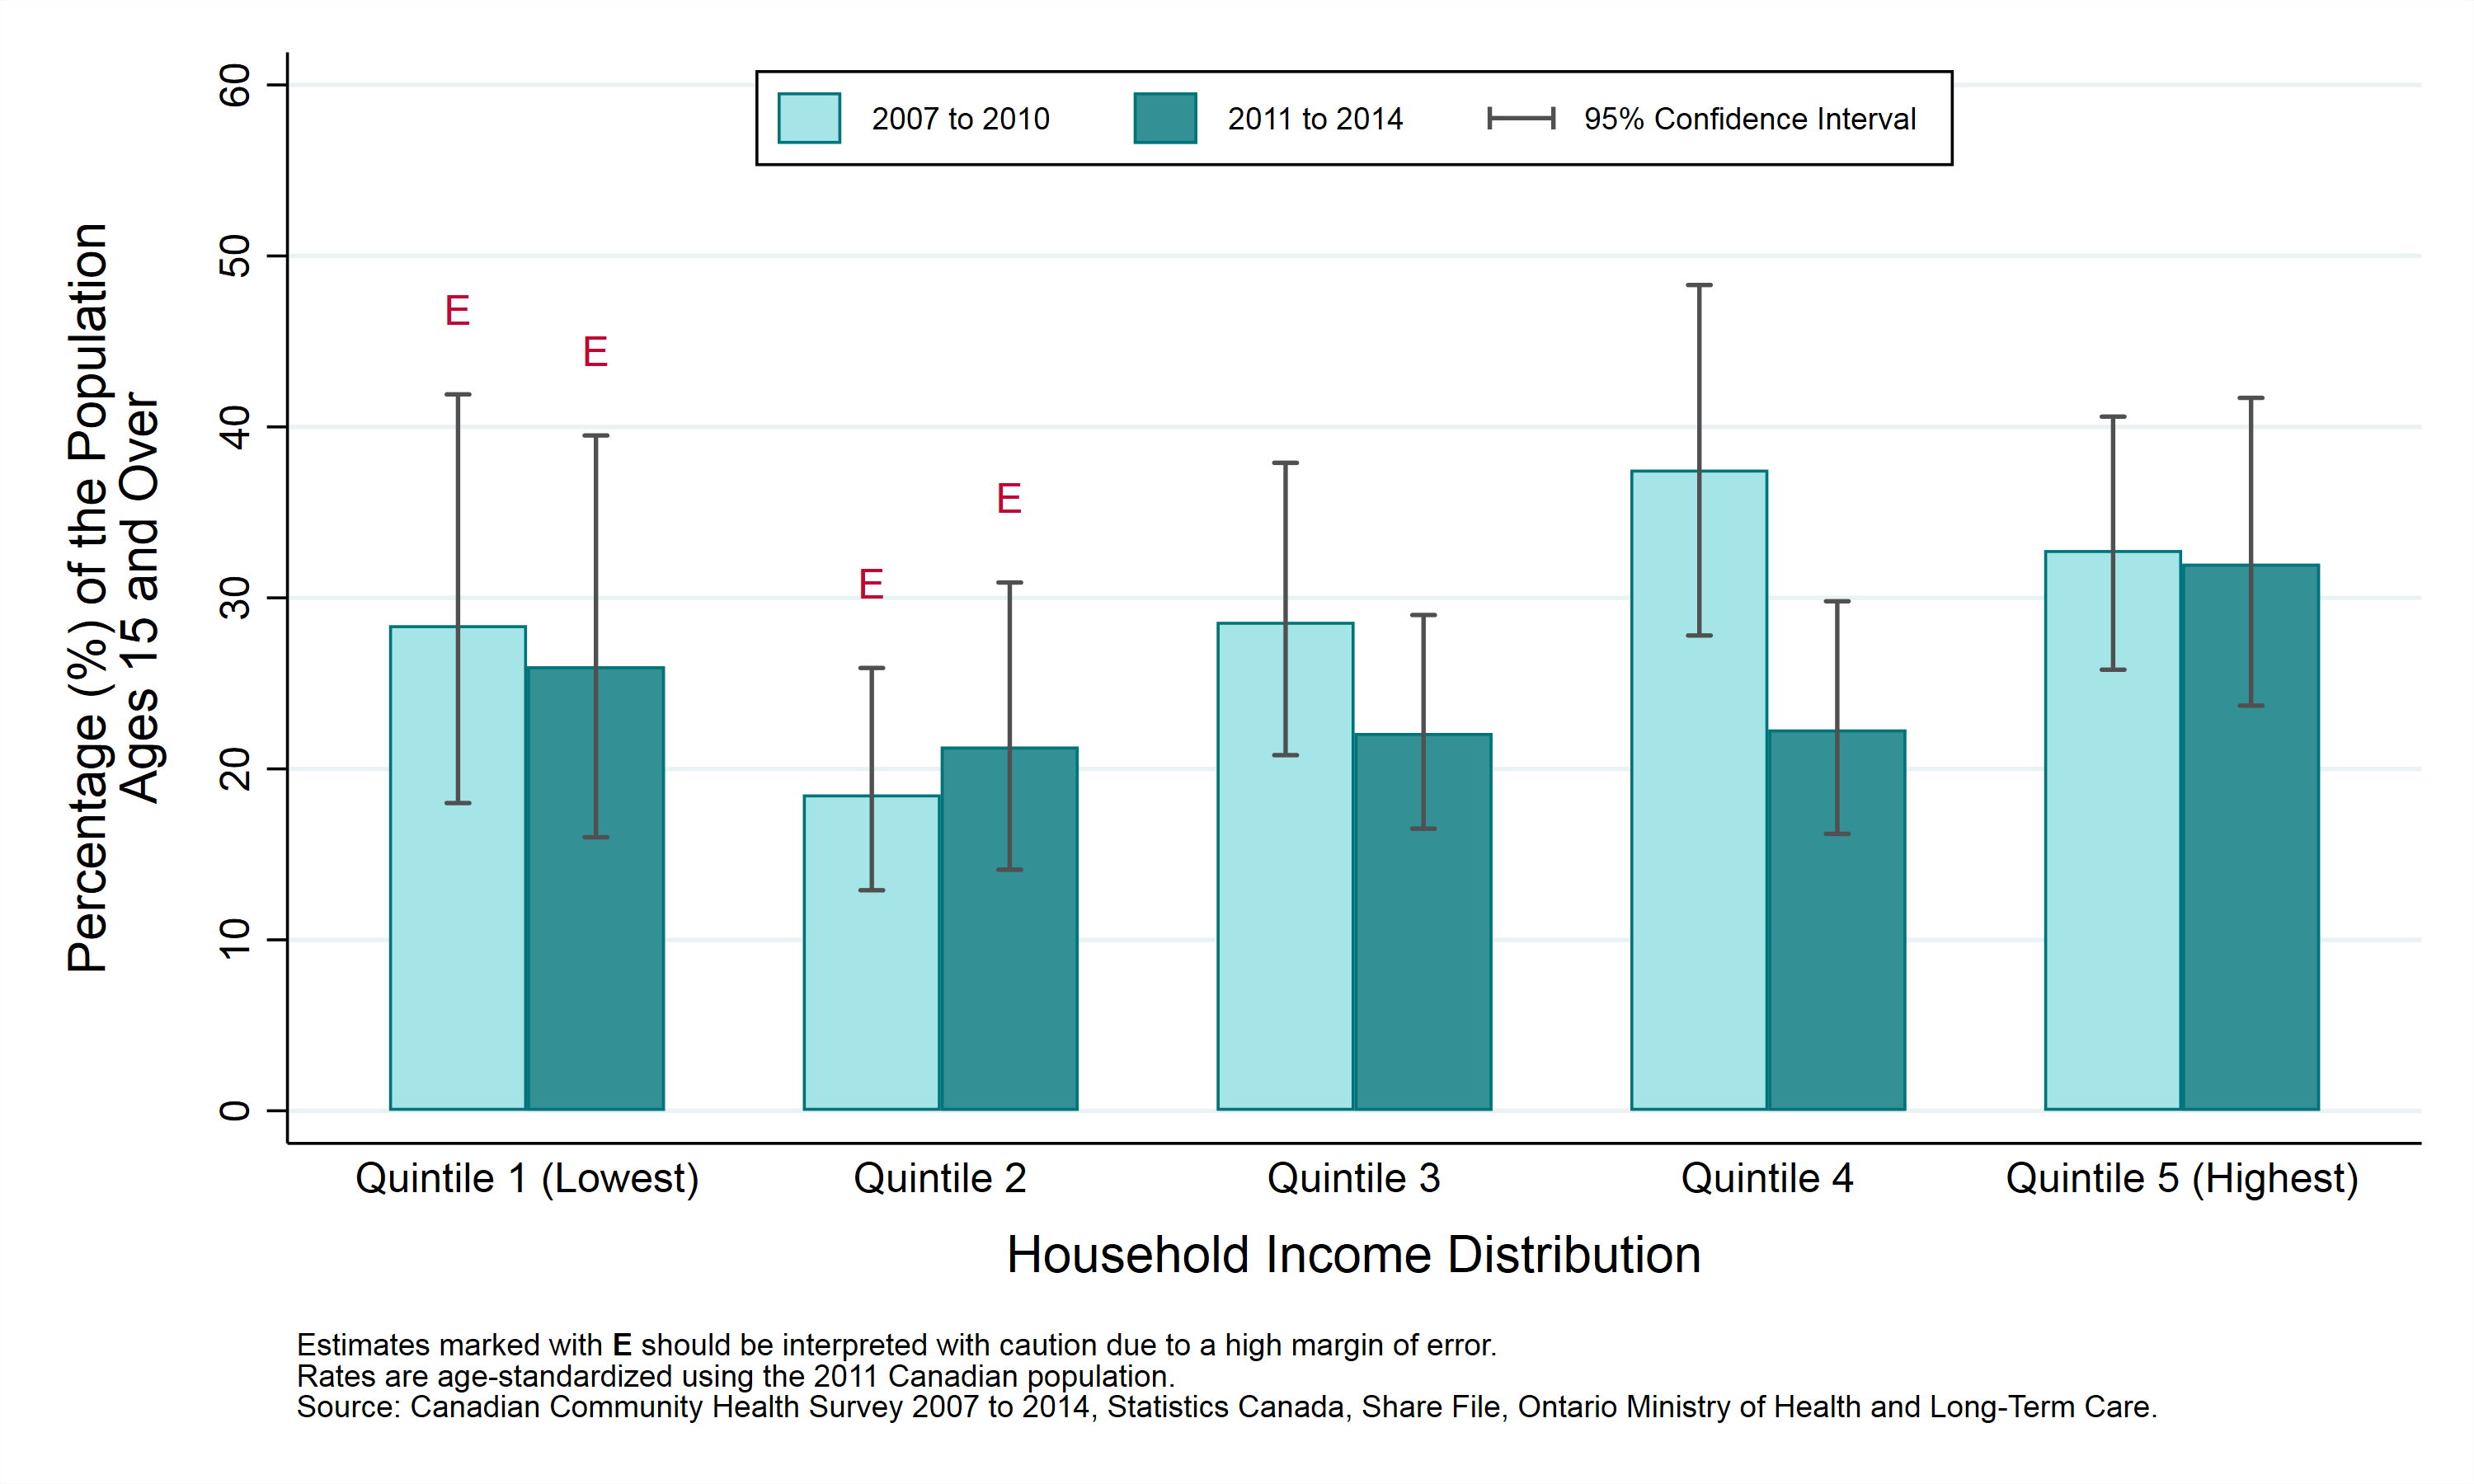
Table: Prevalence rate, work stress (quite or extremely stressful), by year and household income, ages 15+, 2007 to 2010 and 2011 to 2014
Note: Estimates marked with E should be interpreted with caution due to high margin of error.
| Household Income Distribution | Prevalence Rate, 2007 to 2010 | Prevalence Rate, 2011 to 2014 |
|---|---|---|
| Quintile 1 (Lowest) | 28.4% E (CI: 18.0% to 41.9%) | 26.0% E (CI: 16.0% to 39.5%) |
| Quintile 2 | 18.5% E (CI: 12.9% to 25.9%) | 21.3% E (CI: 14.1% to 30.9%) |
| Quintile 3 | 28.6% (CI: 20.8% to 37.9%) | 22.1% (CI: 16.5% to 29.0%) |
| Quintile 4 | 37.5% (CI: 27.8% to 48.3%) | 22.3% (CI: 16.2% to 29.8%) |
| Quintile 5 (Highest) | 32.8% (CI: 25.8% to 40.6%) | 32.0% (CI: 23.7% to 41.7%) |
Work stress (quite or extremely stressful) by education
Key findings:
- Between 2011 and 2014, survey results indicated that the prevalence rate of quite or extremely stressful work stress was not statistically different among education level groups in Sudbury and districts.
- Between 2007 to 2010 and 2011 to 2014, the rate of quite or extremely stressful work stress in Sudbury and districts has not varied significantly in any of the education level groups.
Notes:
- Rates are age-standardized using the 2011 Canadian population.
- Rates are for the population aged 15 years and older.
- Data source: Canadian Community Health Survey (CCHS), 2007 to 2014, Statistics Canada, Share File, Ontario Ministry of Health and Long-Term Care.
Figure: Prevalence rate, work stress (quite or extremely stressful), by year and education levels, ages 15+, 2007 to 2010 and 2011 to 2014
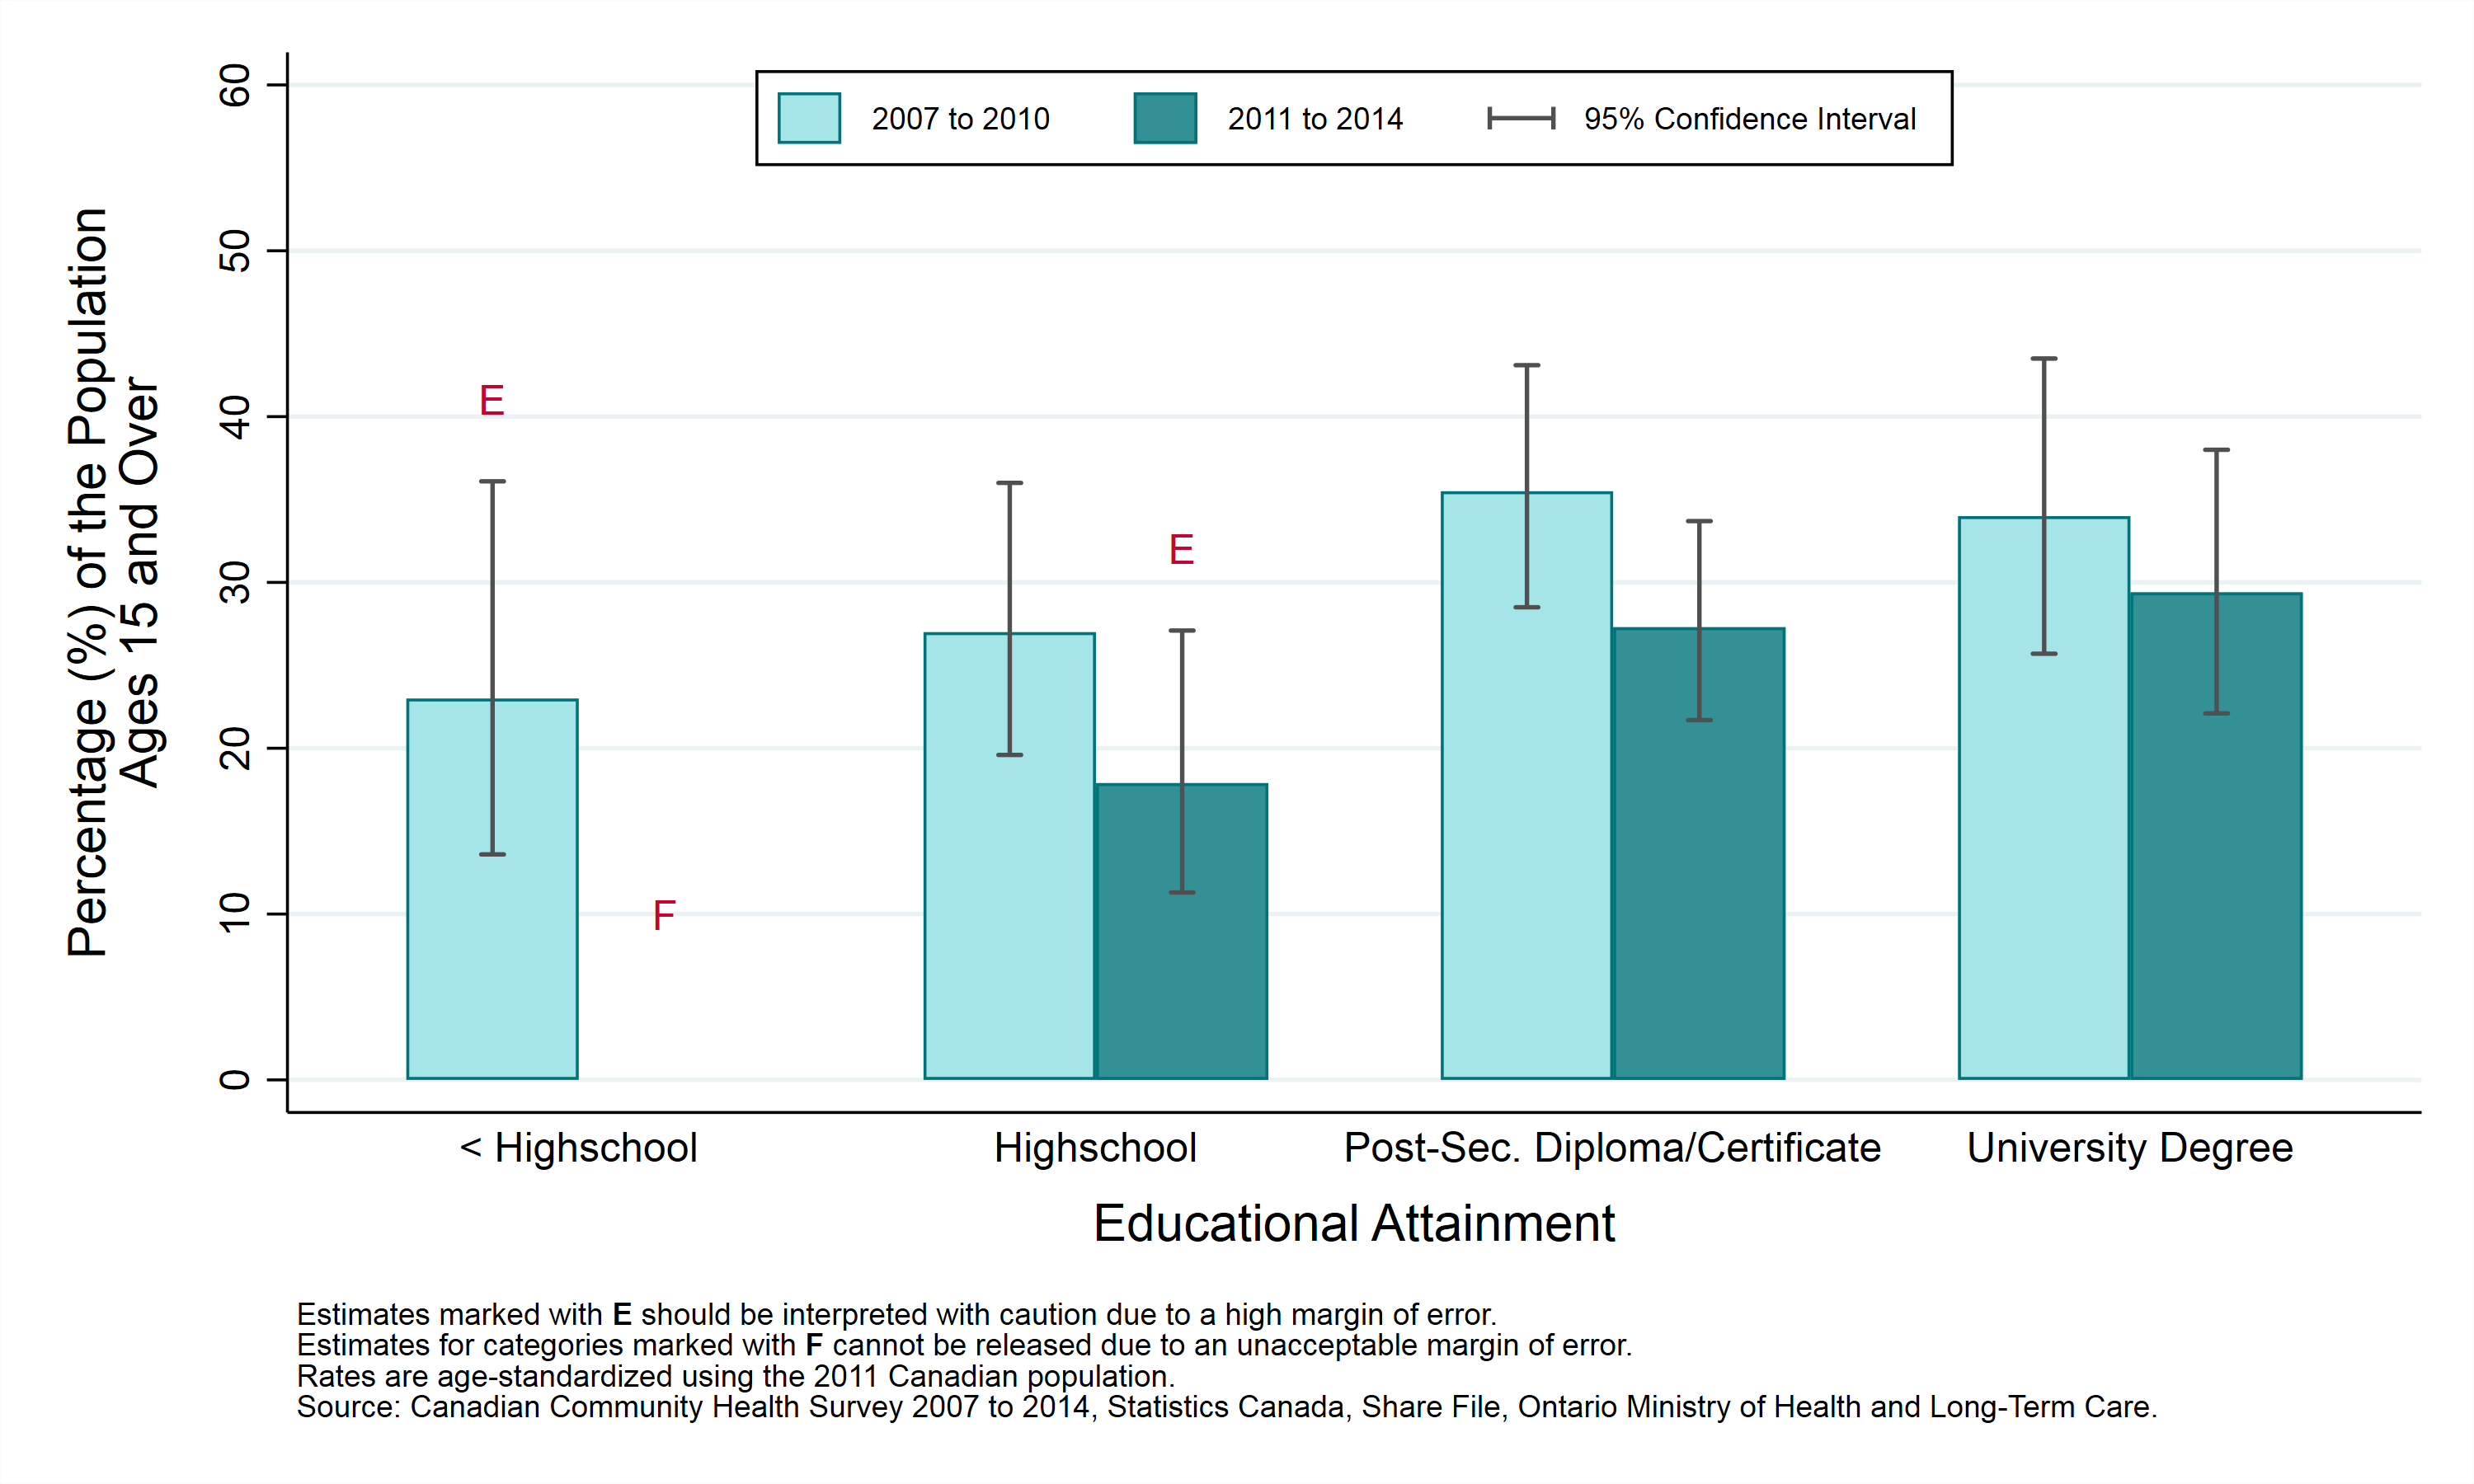
Table: Prevalence rate, work stress (quite or extremely stressful), by year and education, ages 15+, 2007 to 2010 and 2011 to 2014
Note: Estimates marked with E should be interpreted with caution due to high margin of error. Estimates for categories marked with F cannot be released due to an unacceptable margin of error.
| Education | Prevalence Rate, 2007 to 2010 | Prevalence Rate, 2011 to 2014 |
|---|---|---|
| < Highschool Diploma | 23.0% E (CI: 13.6% to 36.1%) | F |
| Highschool Diploma | 27.0% (CI: 19.6% to 36.0%) | 17.9% E (CI: 11.3% to 27.1%) |
| Trade, College or University Diploma or Certificate | 35.5% (CI: 28.5% to 43.1%) | 27.3% (CI: 21.7% to 33.7%) |
| University Degree | 34.0% (CI: 25.7% to 43.5%) | 29.4% (CI: 22.1% to 38.0%) |
Work stress (quite or extremely stressful) by first official language spoken
Key findings:
- Between 2011 and 2014, the prevalence rate of quite or extremely stressful work stress was not statistically different between official language groups in Sudbury and districts.
- Between 2007 to 2010 and 2011 to 2014, the rate of quite or extremely stressful work stress did not vary significantly among either official language group.
Notes:
- Canada’s official languages are French and English. An individual’s “first official language spoken” is determined using their answers to a number of questions about the languages they speak. A small percentage of people are classified as having both French and English as their “first” official language spoken. Such individuals are included here as French. People speaking neither French nor English are excluded from this analysis.
- Rates are age-standardized using the 2011 Canadian population.
- Rates are for the population aged 15 years and older.
- Data source: Canadian Community Health Survey (CCHS), 2007 to 2014, Statistics Canada, Share File, Ontario Ministry of Health and Long-Term Care.
Figure: Prevalence rate, work stress (quite or extremely stressful), by year and first official language spoken, ages 15+, 2007 to 2010 and 2011 to 2014
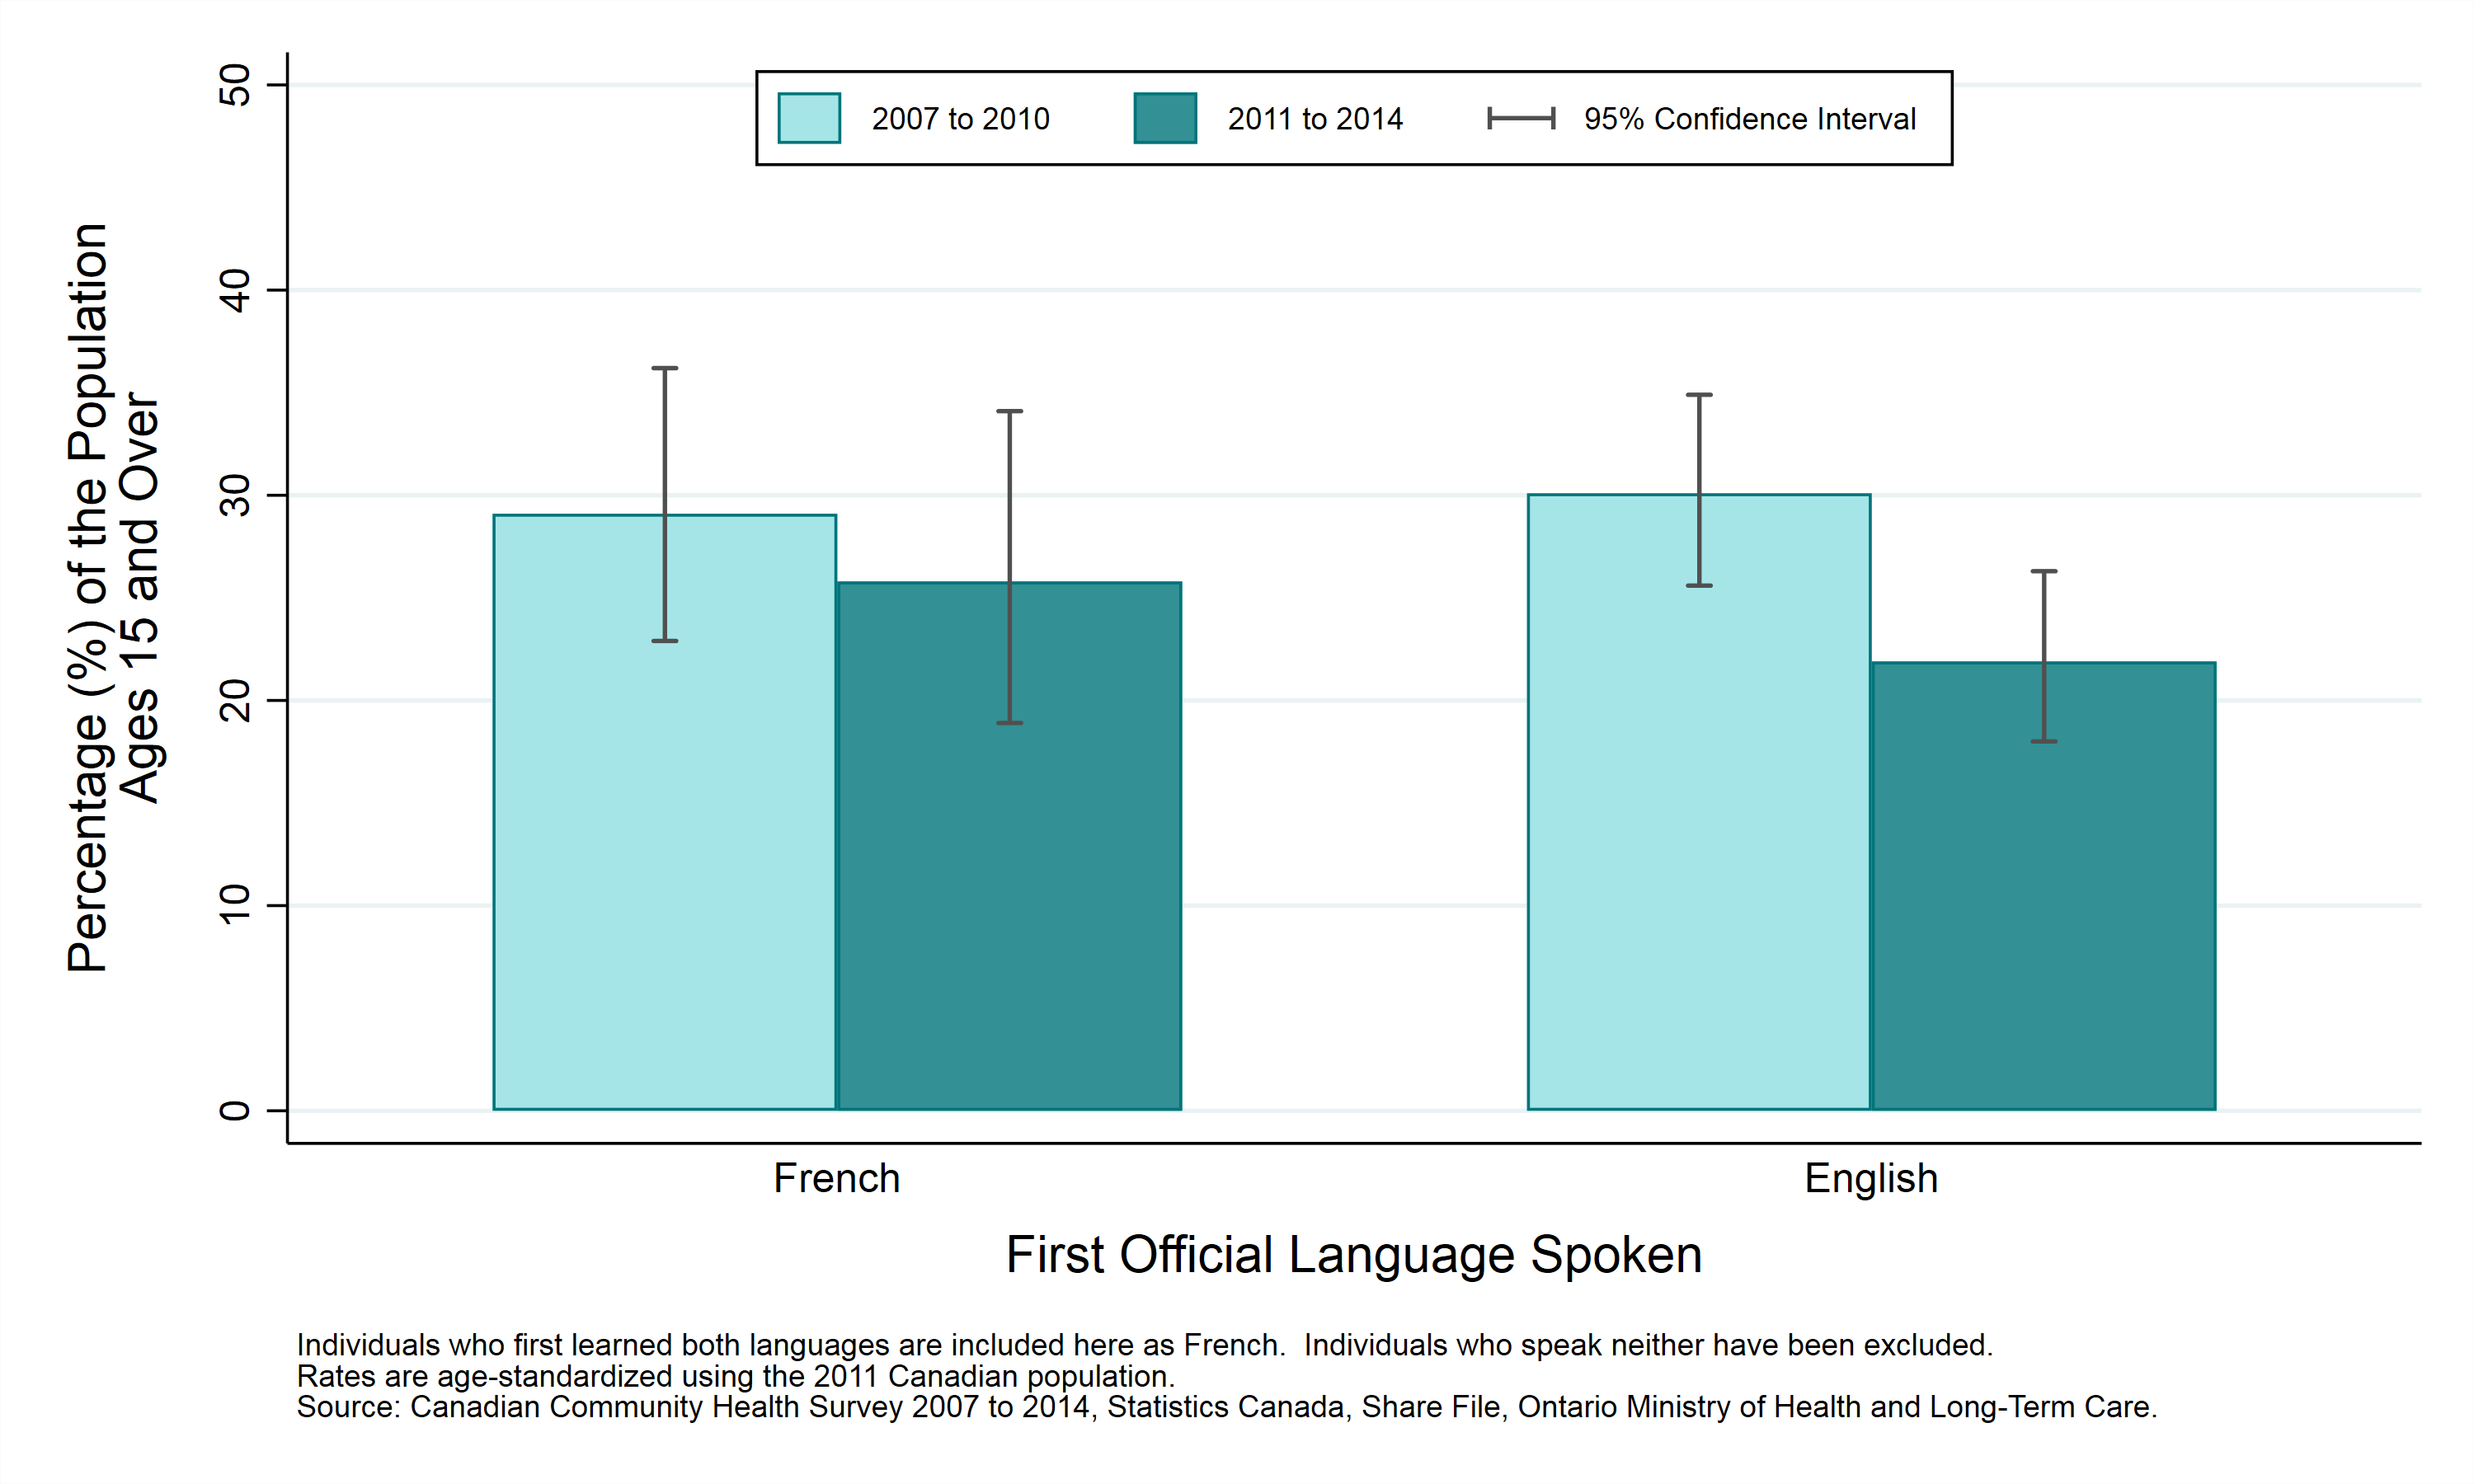
Table: Prevalence rate, work stress (quite or extremely stressful), by year and first official language spoken, ages 15+, 2007 to 2010 and 2011 to 2014
| First Official Language Spoken | Prevalence Rate, 2007 to 2010 | Prevalence Rate, 2011 to 2014 |
|---|---|---|
| French | 29.1% (CI: 22.9% to 36.2%) | 25.8% (CI: 18.9% to 34.1%) |
| English | 30.1% (CI: 25.6% to 34.9%) | 21.9% (CI: 18.0% to 26.3%) |
This item was last modified on July 3, 2019