Self-rated health
One way to measure someone’s health is simply to ask them about it. A person’s self-rated health is typically measured by asking them to describe their health using one of the following categories: excellent, very good, good, fair or poor.
These results are presented for individuals aged 12 years and older.
- overall levels of self-rated health
- by geographic region
- by sex
- by age group
- by income
- by education
- by first official language spoken
Overall findings:
- In 2013 / 2014, survey results indicated that 59% of individuals aged 12 and older in Sudbury and districts rated their health as excellent or very good, 28% rated their health as good, while 13% rated their health as fair or poor.
- Between 2007 / 2008 and 2013 / 2014, the prevalence rate of excellent or very good self-rated health in Sudbury and districts have not varied significantly.
Notes:
- Rates are age-standardized using the 2011 Canadian population.
- Rates are for the population aged 12 years and older.
- Data source: Canadian Community Health Survey (CCHS), 2007 to 2014, Statistics Canada, Share File, Ontario Ministry of Health and Long-Term Care.
Figure: Age-standardized prevalence rate, self-rated health, Sudbury and districts, by year, ages 12+, 2007 / 2008 to 2013 / 2014
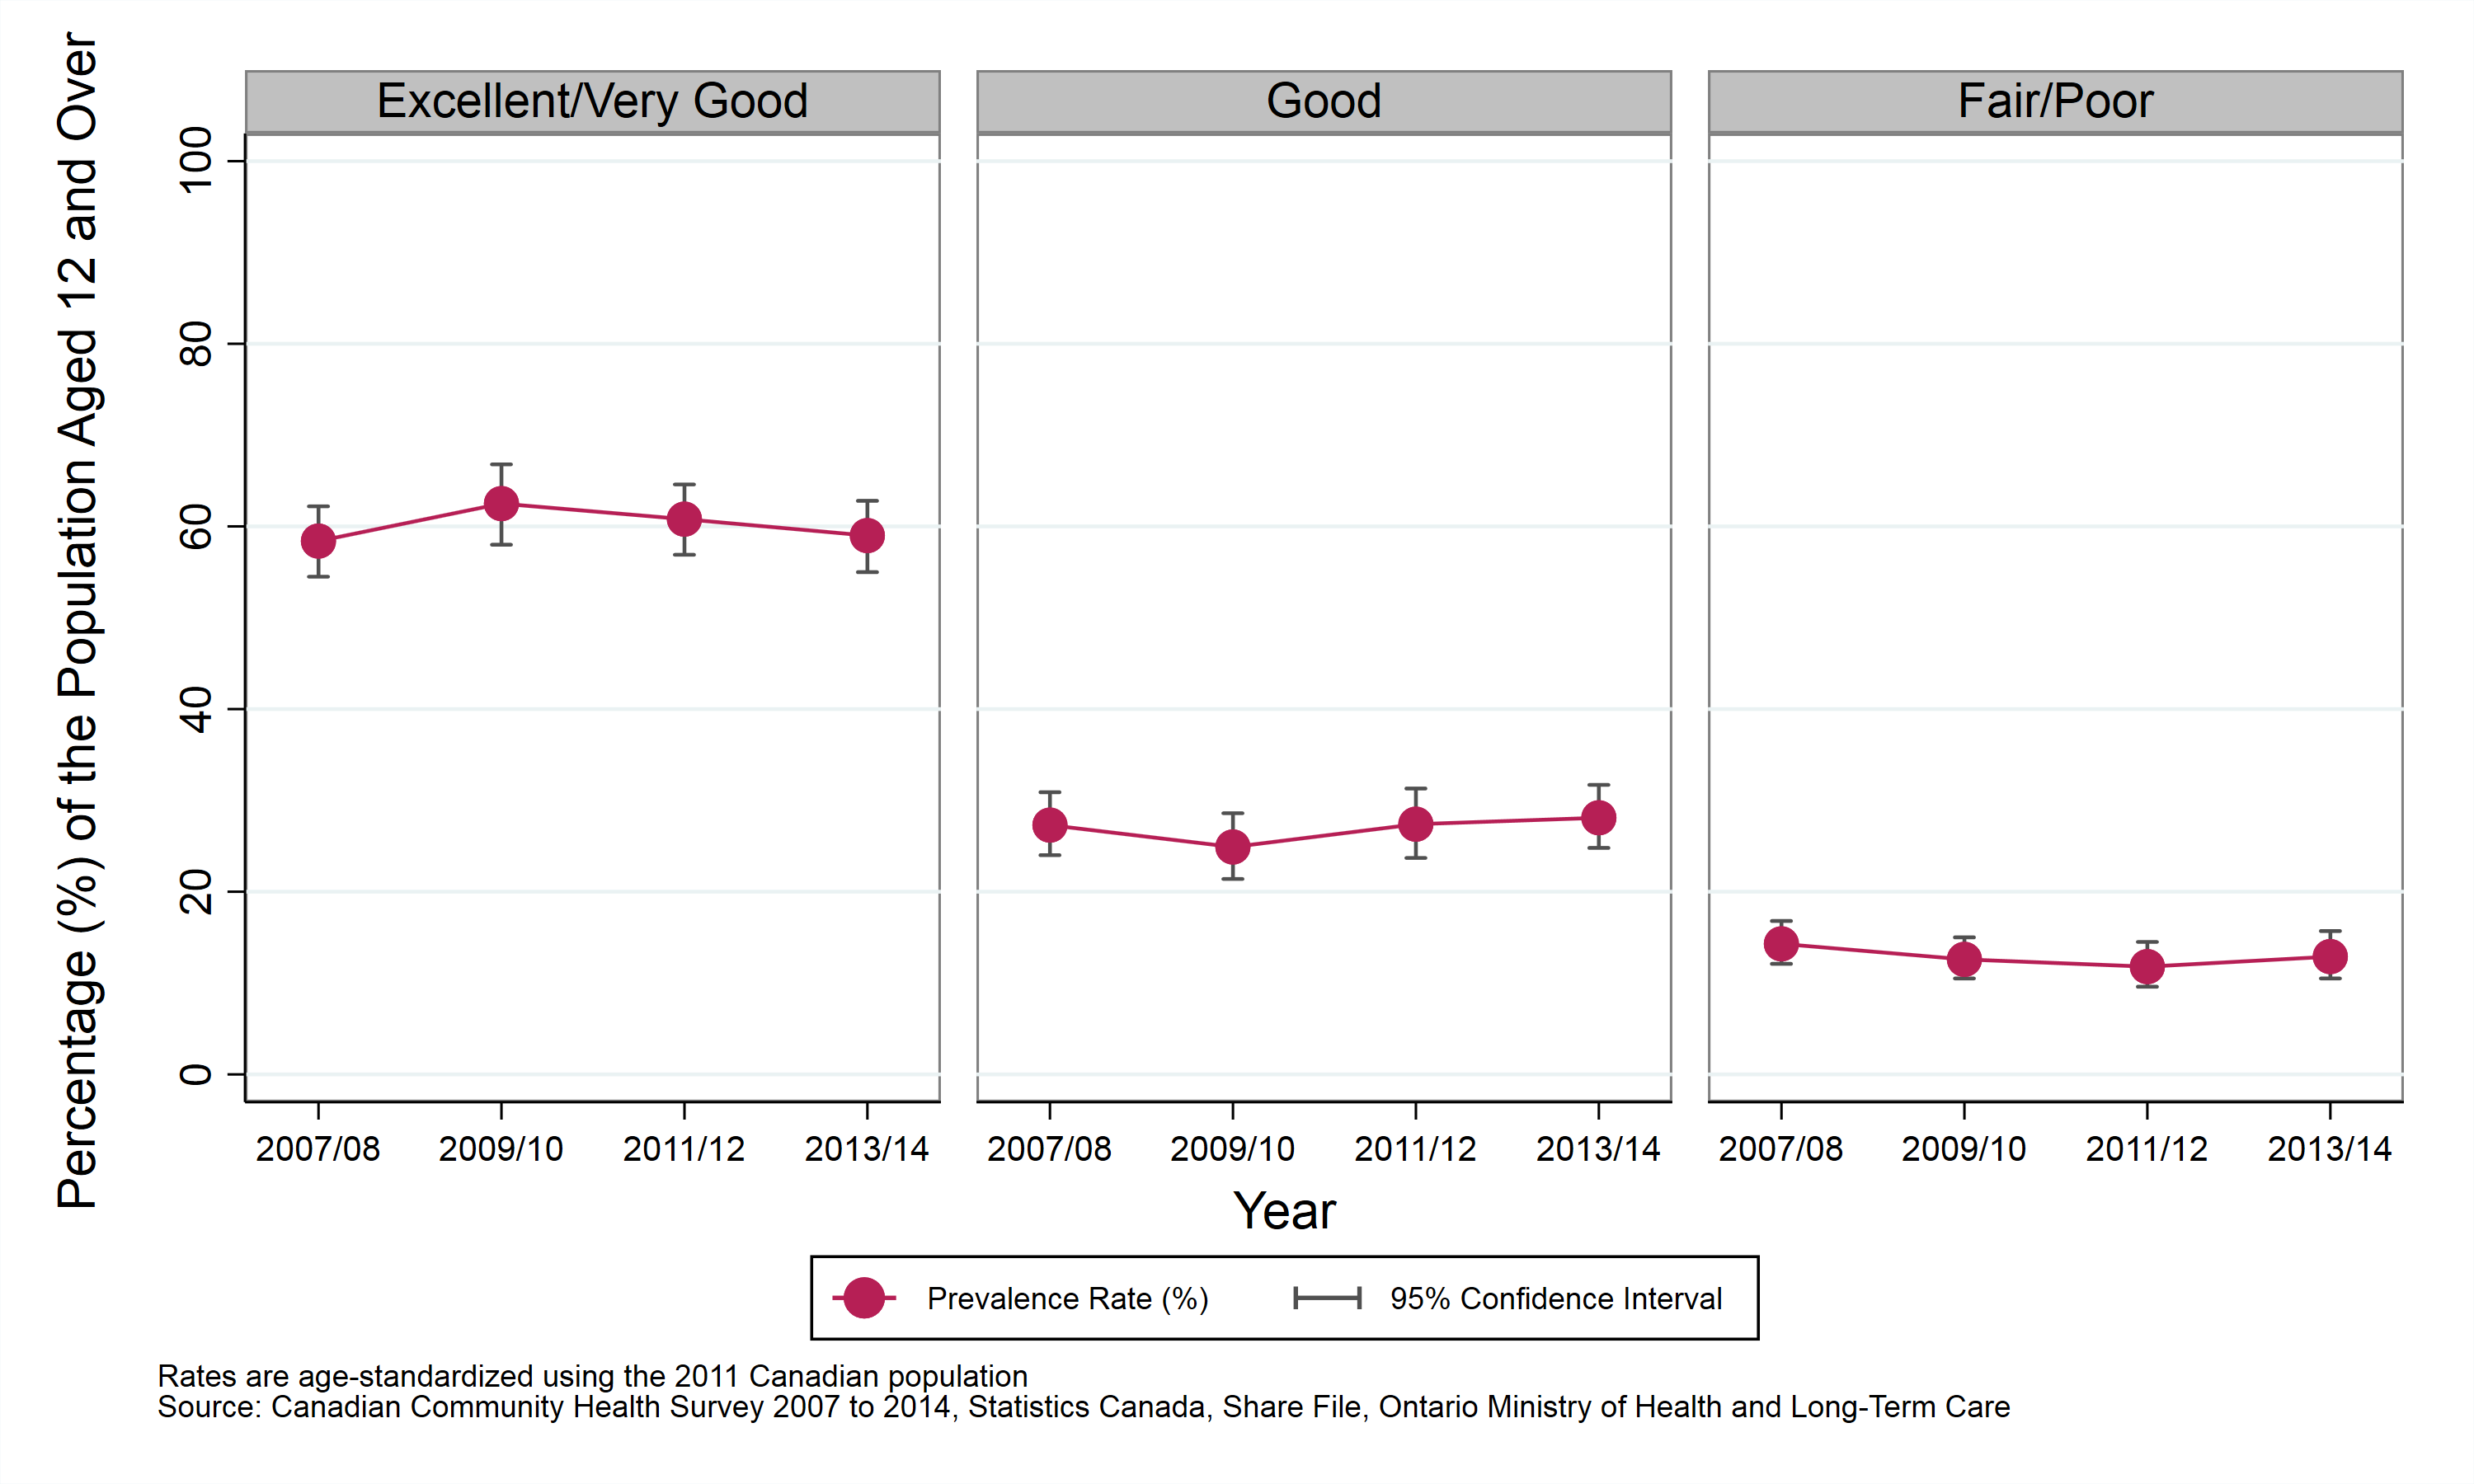
Table: Age-standardized prevalence rate, self-rated health, Sudbury and districts, by year, ages 12+, 2007 / 2008 to 2013 / 2014
| Self-Rated Mental Health | Prevalence Rate, 2007 / 2008 | Prevalence Rate, 2009 / 2010 | Prevalence Rate, 2011 / 2012 | Prevalence Rate, 2013 / 2014 |
|---|---|---|---|---|
| Excellent/Very Good | 58.4% (CI: 54.5% to 62.2%) | 62.5% (CI: 58.0% to 66.8%) | 60.8% (CI: 56.9% to 64.6%) | 59.0% (CI: 55.0% to 62.8%) |
| Good | 27.3% (CI: 24.0% to 30.9%) | 24.9% (CI: 21.4% to 28.6%) | 27.4% (CI: 23.7% to 31.3%) | 28.1% (CI: 24.8% to 31.7%) |
| Fair/Poor | 14.3% (CI: 12.1% to 16.8%) | 12.6% (CI: 10.5% to 15.0%) | 11.8% (CI: 9.6% to 14.5%) | 12.9% (CI: 10.5% to 15.7%) |
Self-rated health by geographic area
Key findings:
- In 2013 / 2014, survey results indicated that 59% of individuals aged 12 and older in Sudbury and districts rated their health as either “excellent” or “very good”.
- The proportion of the population that rated their health as “excellent” or “very good” in Sudbury and districts has been consistently similar to that reported in northeastern Ontario and Ontario overall.
- Between 2007 / 2008 and 2013 / 2014, the proportion of the population that rated their health as “excellent” or “very good” in Sudbury and districts has not varied significantly.
Notes:
- Rates are age-standardized using the 2011 Canadian population.
- Rates are for the population aged 12 years and older.
- Data source: Canadian Community Health Survey (CCHS), 2007 to 2014, Statistics Canada, Share File, Ontario Ministry of Health and Long-Term Care.
Figure: Age-standardized prevalence rate, “excellent” or “very good” self-rated health, by year and geographic area, ages 12+, 2007 / 2008 to 2013 / 2014
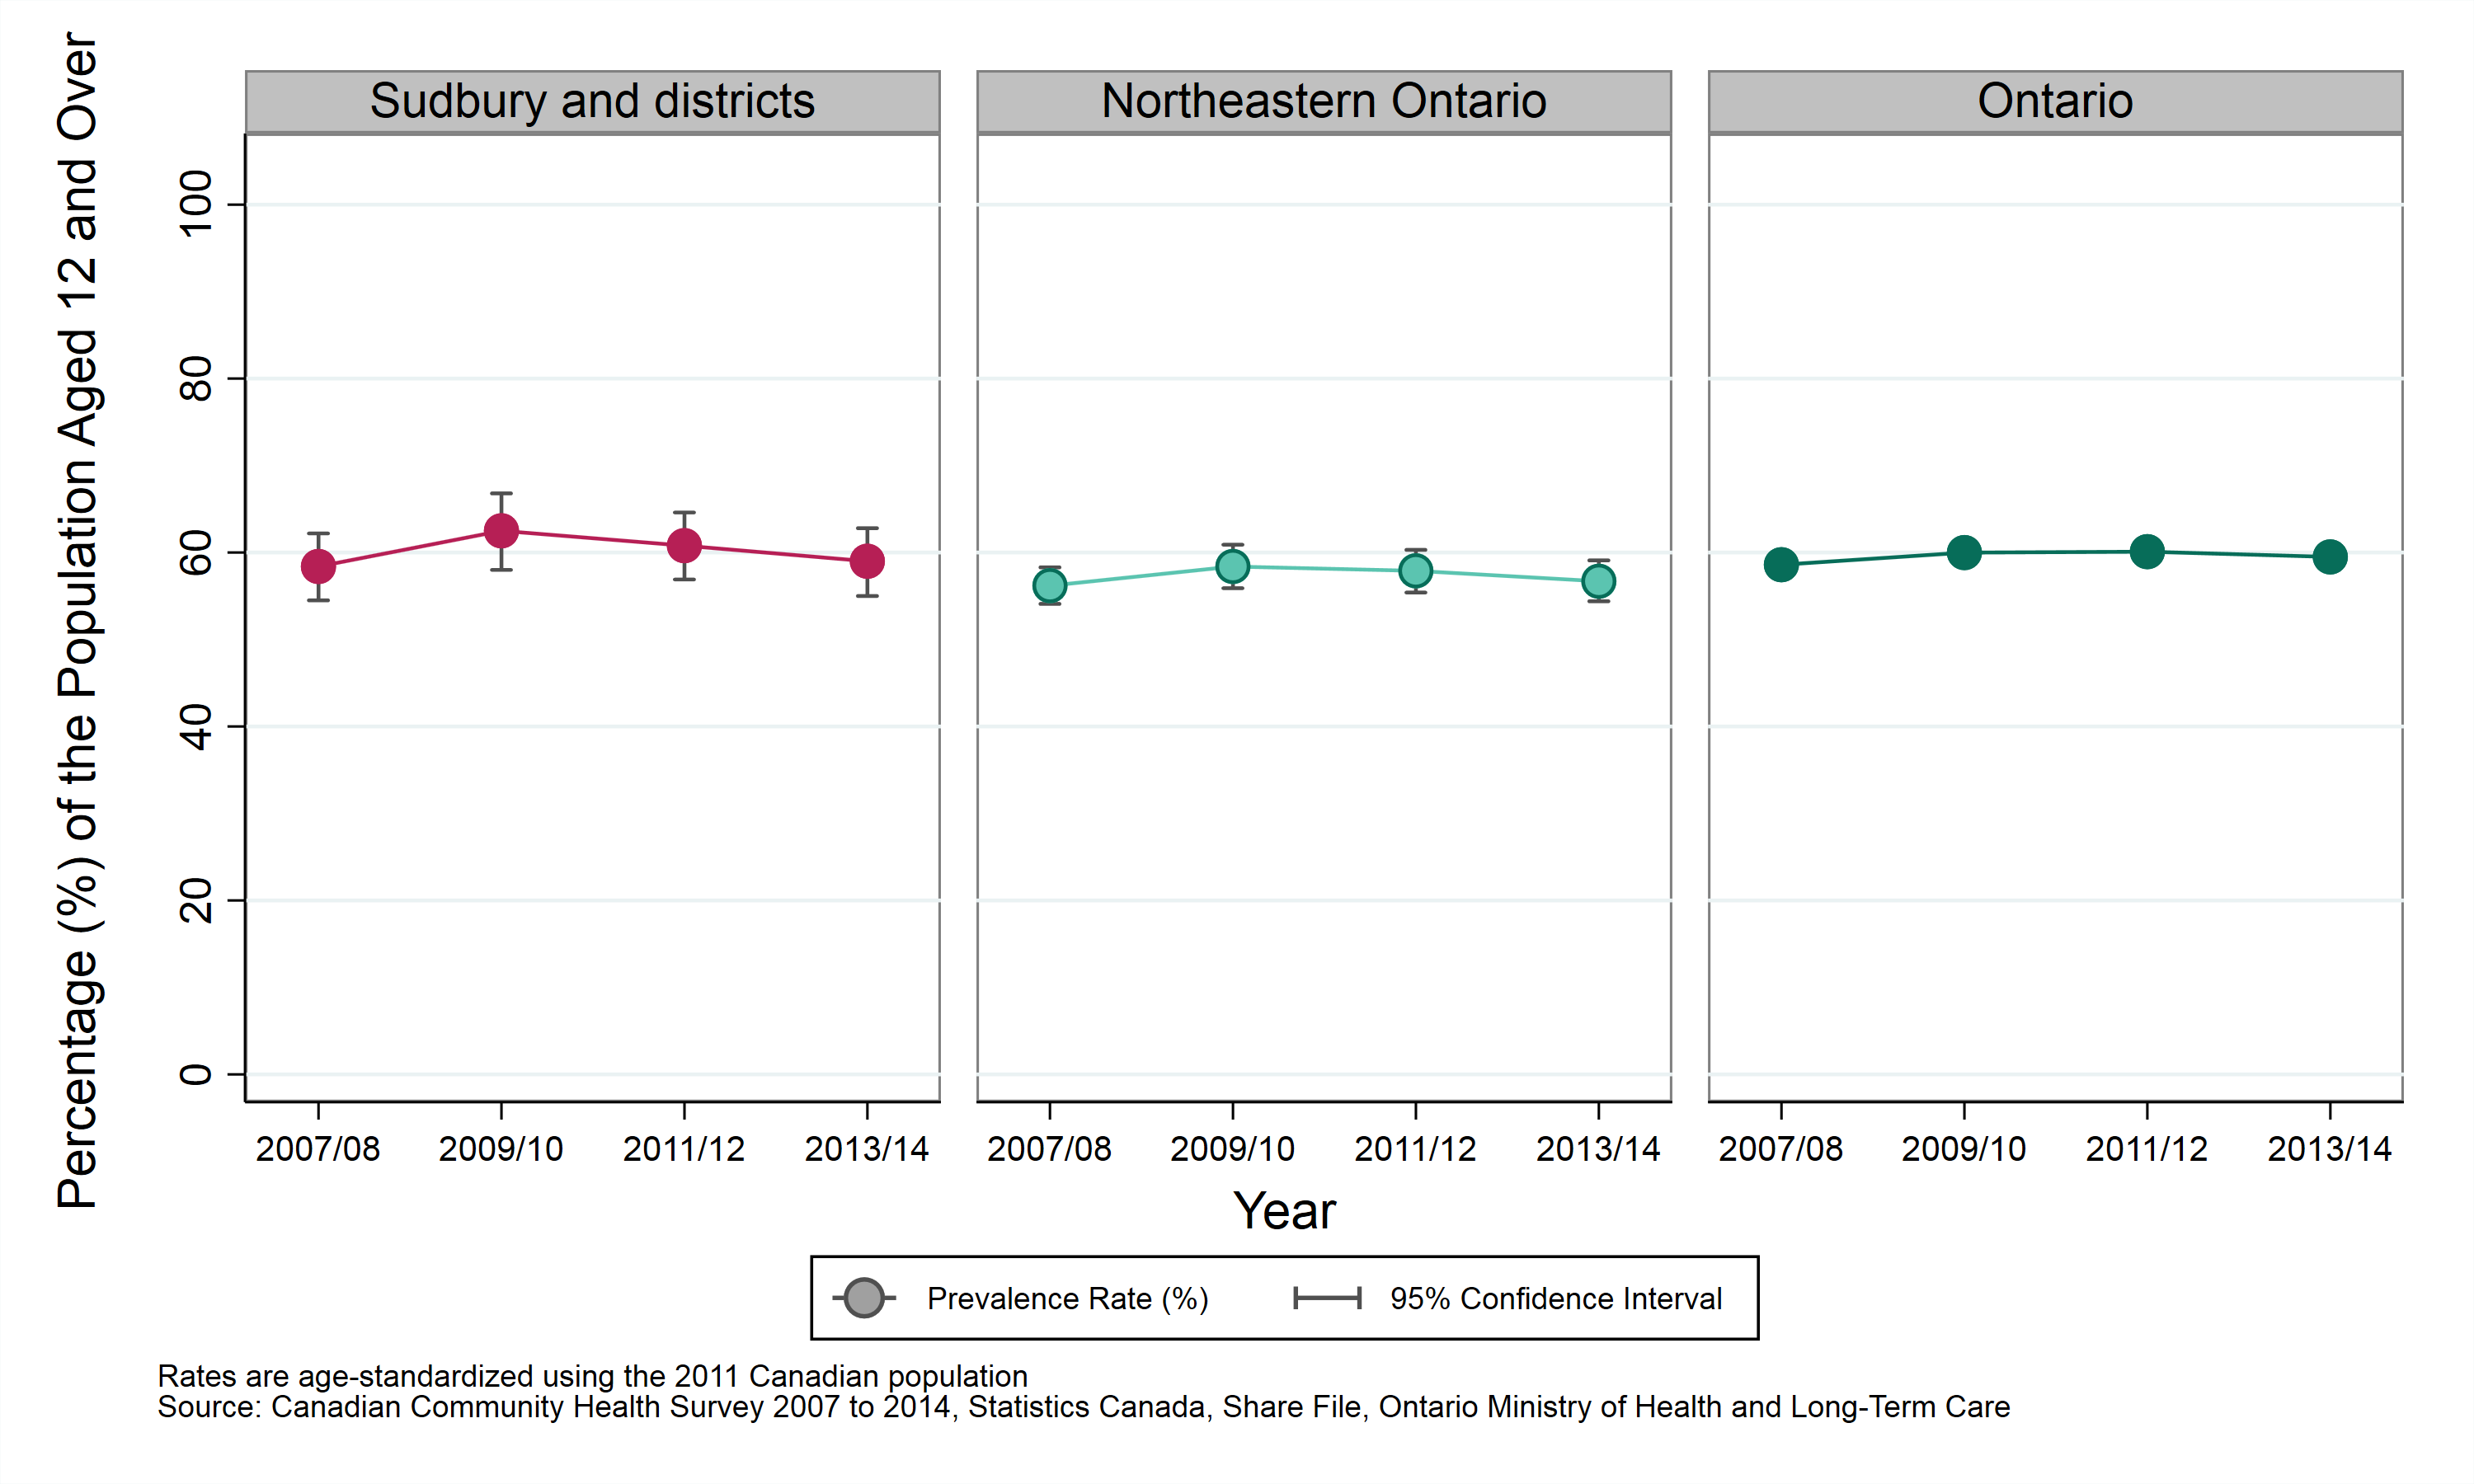
Table: Age-standardized prevalence rate, “excellent” or “very good” self-rated health, by year and geographic area, ages 12+, 2007 / 2008 to 2013 / 2014
| Geographic Region | Prevalence Rate, 2007 / 2008 | Prevalence Rate, 2009 / 2010 | Prevalence Rate, 2011 / 2012 | Prevalence Rate, 2013 / 2014 |
|---|---|---|---|---|
| Sudbury and districts | 58.4% (CI: 54.5% to 62.2%) | 62.5% (CI: 58.0% to 66.8%) | 60.8% (CI: 56.9% to 64.6%) | 59.0% (CI: 55.0% to 62.8%) |
| Northeastern Ontario | 56.2% (CI: 54.1% to 58.3%) | 58.4% (CI: 55.9% to 60.9%) | 57.9% (CI: 55.4% to 60.3%) | 56.7% (CI: 54.4% to 59.1%) |
| Ontario | 58.6% (CI: 57.8% to 59.4%) | 60.0% (CI: 59.2% to 60.8%) | 60.1% (CI: 59.1% to 61.0%) | 59.5% (CI: 58.6% to 60.3%) |
Self-rated health by sex
Key findings:
- Between 2011 and 2014, survey results indicated that the prevalence rate of excellent or very good self-rated health was similar in males and females aged 12 years and older in Sudbury and districts.
- Between 2007–2010 and 2011–2014, the rate of excellent or very good self-rated health has not varied significantly in either males or females in Sudbury and districts.
Notes:
- Rates are age-standardized using the 2011 Canadian population.
- Rates are for the population aged 12 years and older.
- Data source: Canadian Community Health Survey (CCHS), 2007 to 2014, Statistics Canada, Share File, Ontario Ministry of Health and Long-Term Care.
Figure: Age-standardized prevalence rate, “excellent” or “very good” self-rated health, by year and sex, ages 12+, 2007–2010 and 2011–2014
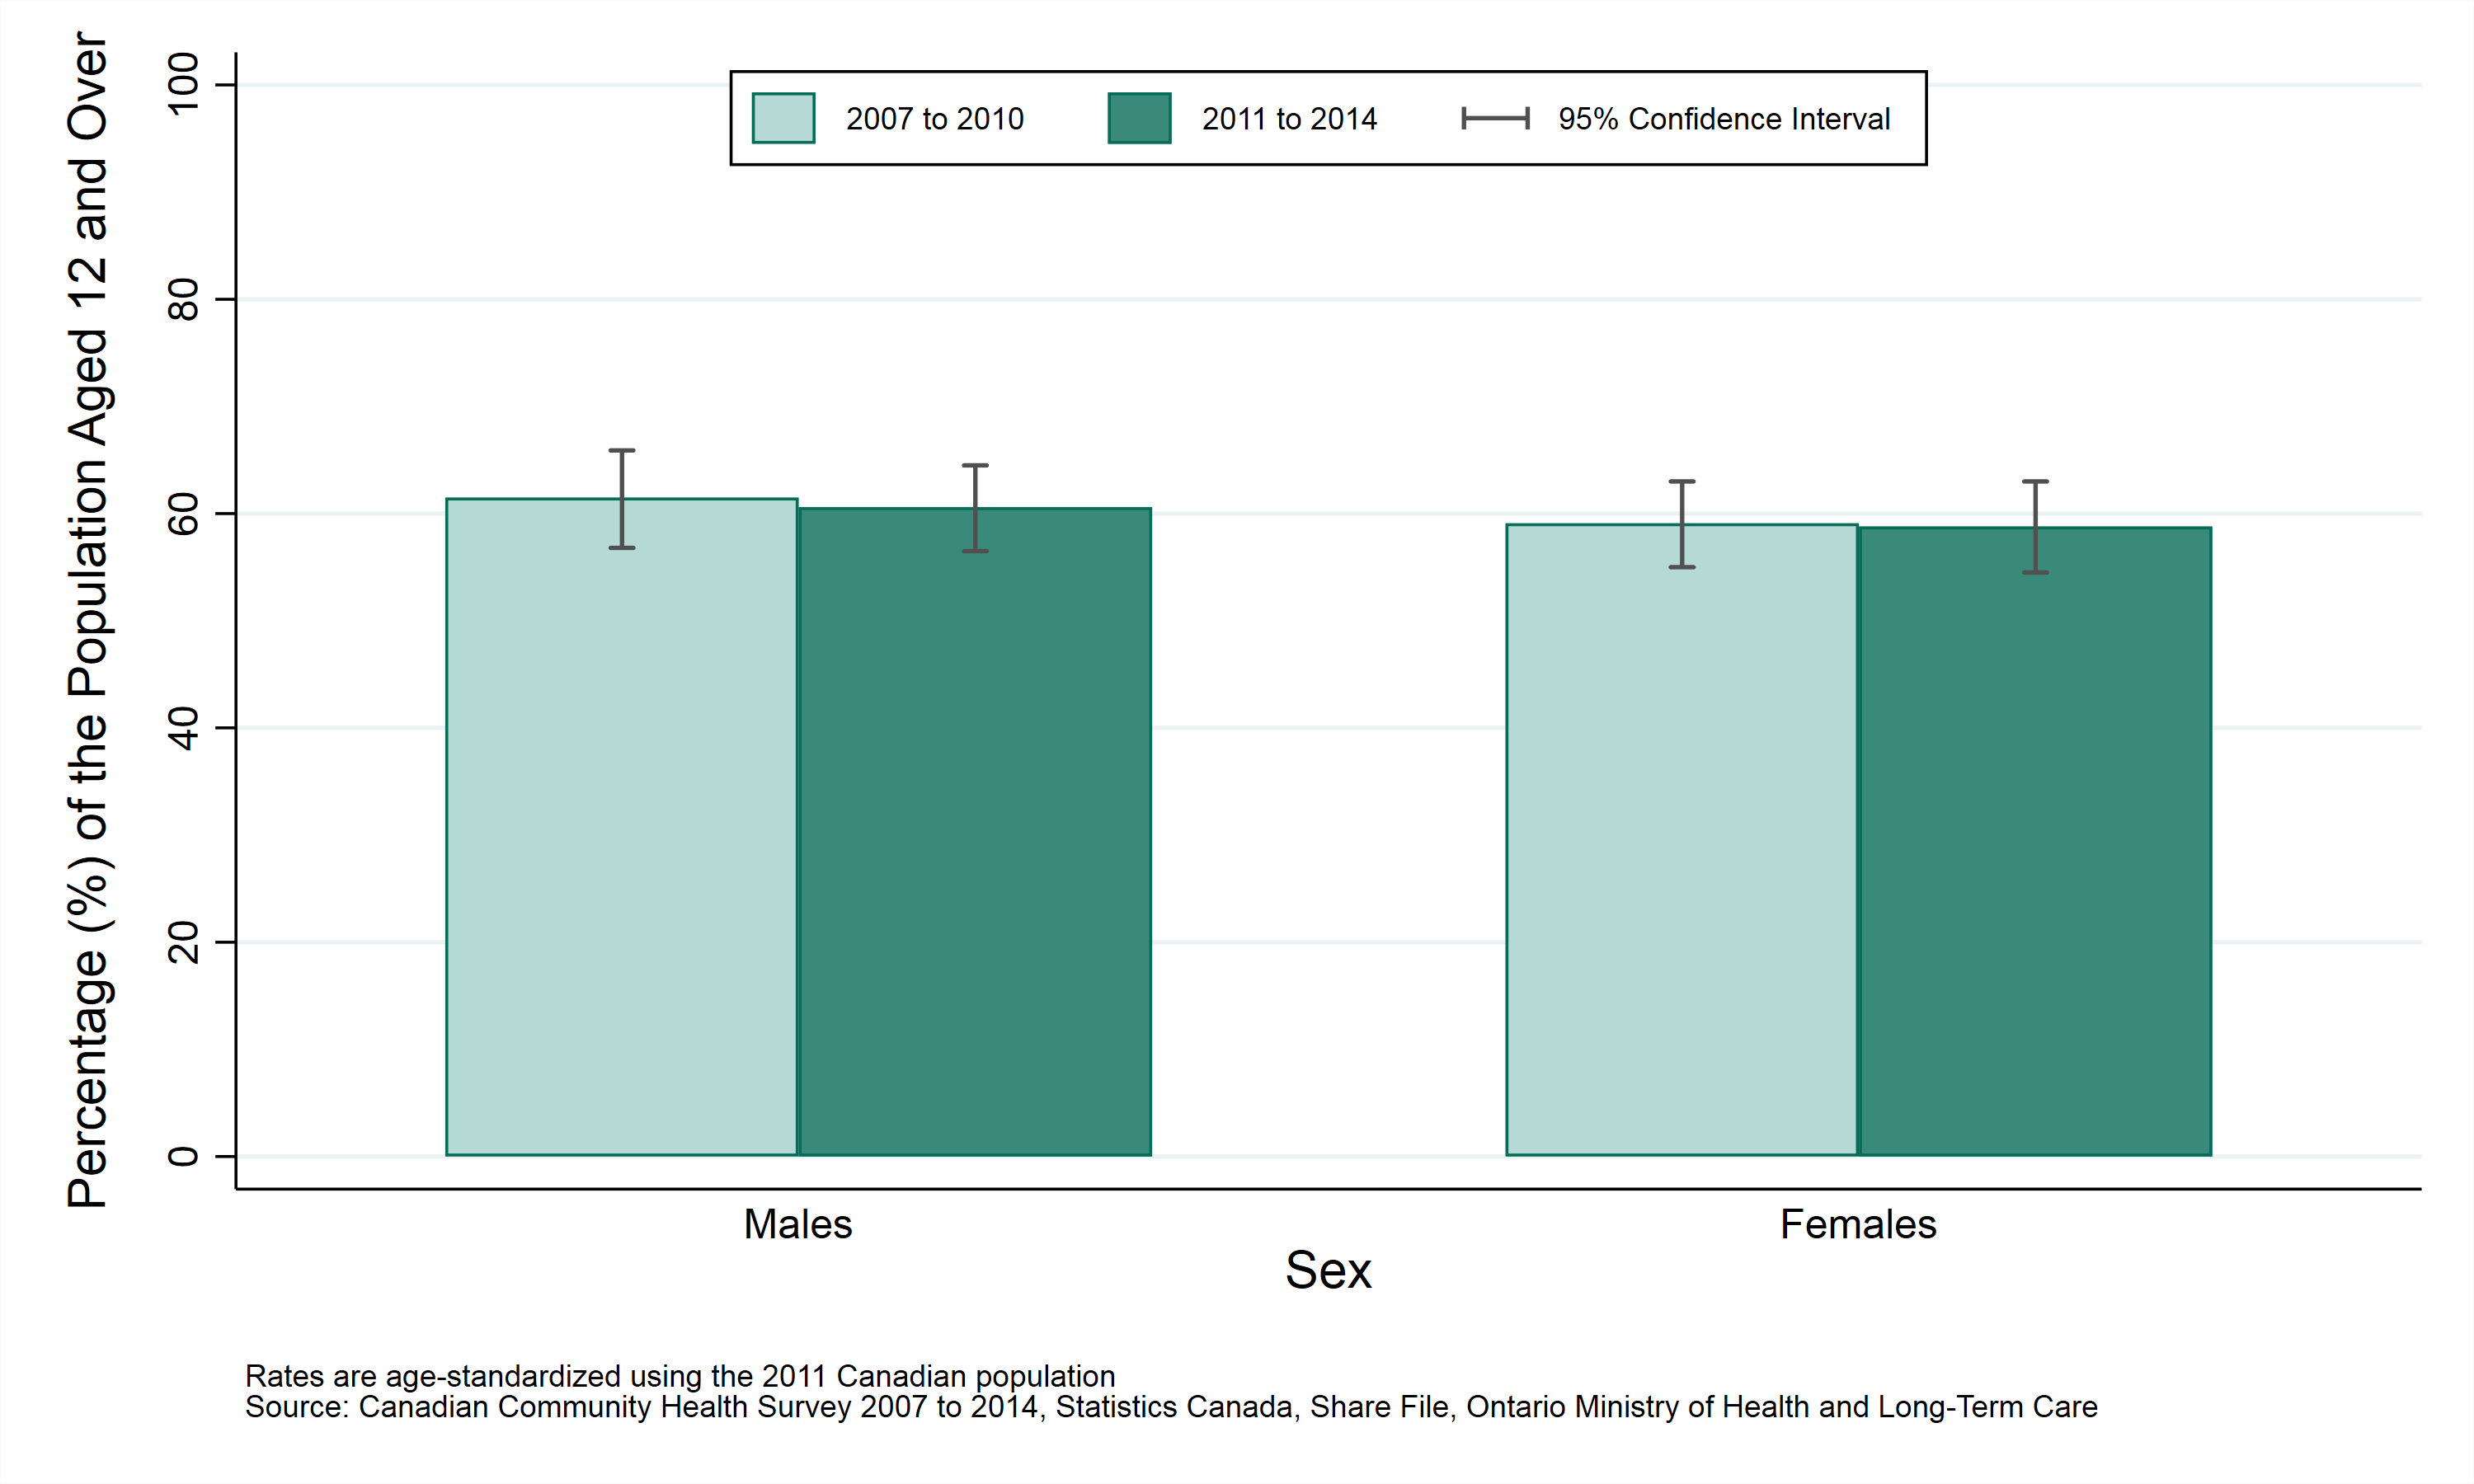
Table: Age-standardized prevalence rate, “excellent” or “very good” self-rated health, by year and sex, ages 12+, 2007–2010 and 2011–2014
| Sex | Prevalence Rate, 2007–2010 | Prevalence Rate, 2011–2014 |
|---|---|---|
| Males | 61.5% (CI: 56.8% to 65.9%) | 60.6% (CI: 56.5% to 64.5%) |
| Females | 59.1% (CI: 55.0% to 63.0%) | 58.8% (CI: 54.5% to 63.0%) |
Self-rated health by age group
Key findings:
- In 2011–2014, survey results indicated that the prevalence rate of excellent or very good self-rated health was similar in the 12–19 year old and 20–44 year old age groups in Sudbury and districts. Rates in older age groups were significantly lower.
- Reported rates of excellent or very good self-rated health did not vary significantly between 2007–2010 and 2011–2014 within any of the age groups.
Notes:
- Rates are for the population aged 12 years and older.
- Data source: Canadian Community Health Survey (CCHS), 2007 to 2014, Statistics Canada, Share File, Ontario Ministry of Health and Long-Term Care.
Figure: Prevalence rate, “excellent” or “very good” self-rated health, by year and age group, ages 12+, 2007–2010 and 2011–2014
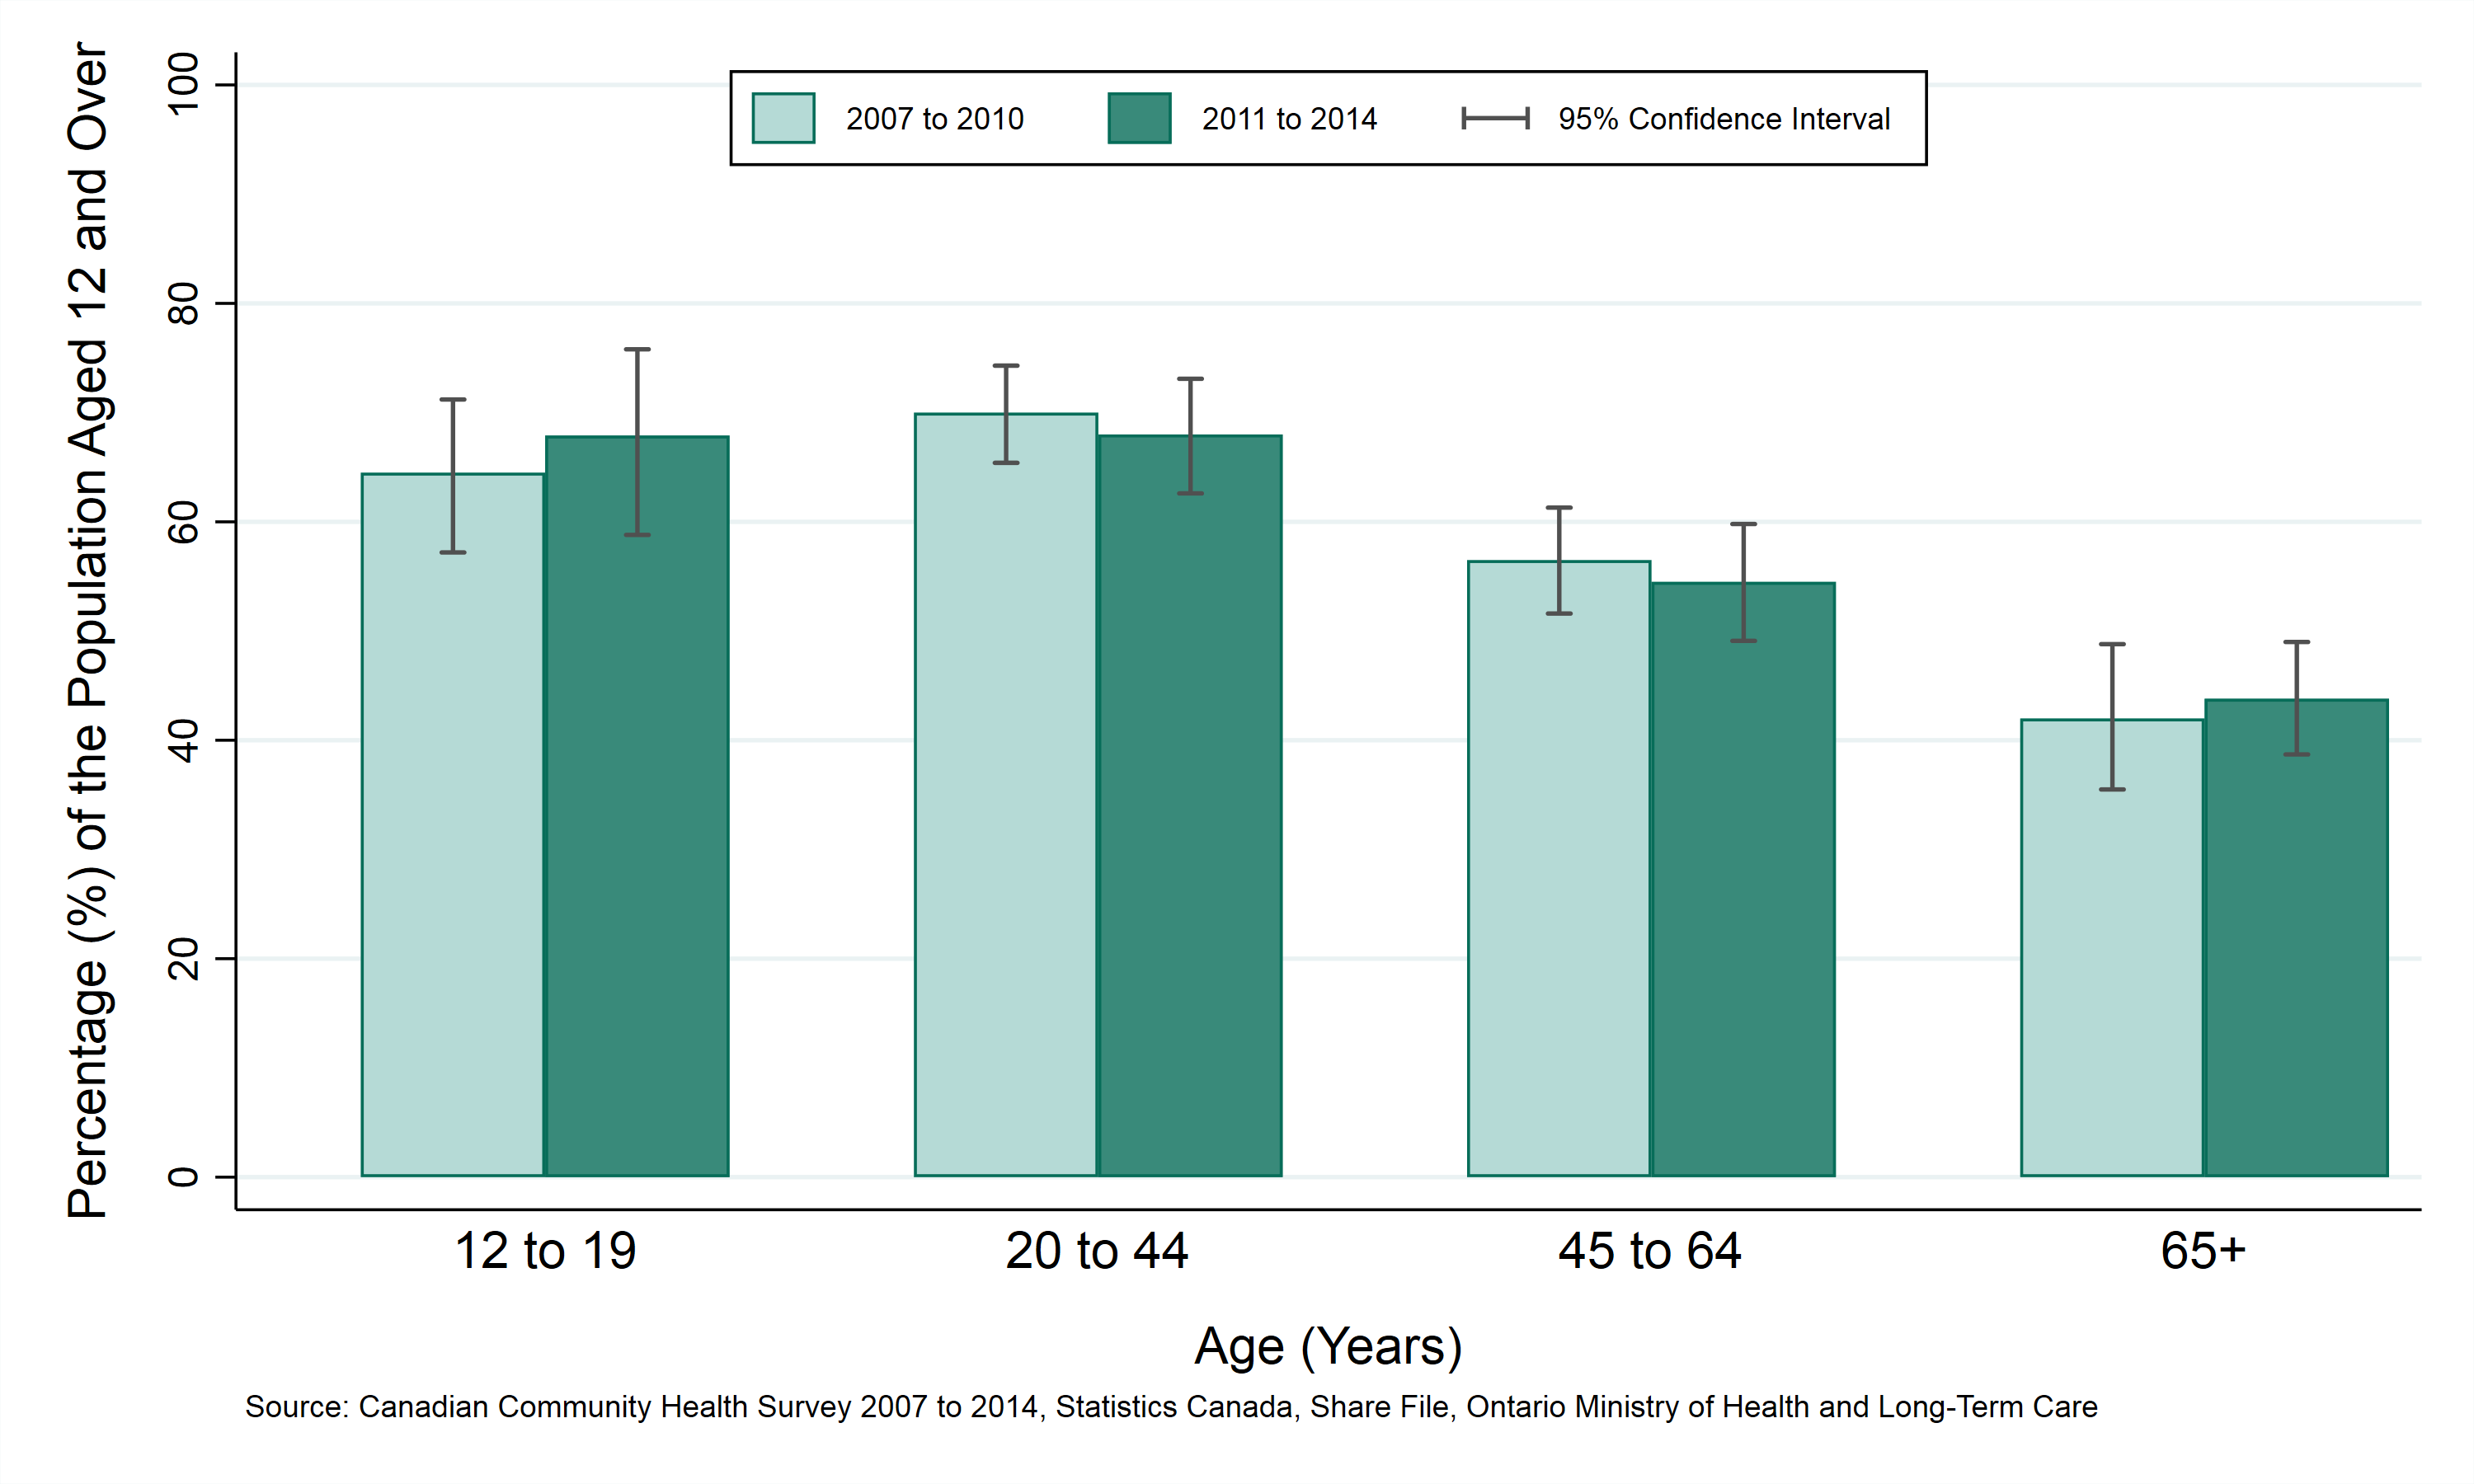
Table: Prevalence rate, “excellent” or “very good” self-rated health, by year and age group, ages 12+, 2007–2010 and 2011–2014
| Age (Years) | Prevalence Rate, 2007–2010 | Prevalence Rate, 2011–2014 |
|---|---|---|
| 12-19 | 64.5% (CI: 57.2% to 71.2%) | 67.9% (CI: 58.8% to 75.8%) |
| 20 to 44 | 70.0% (CI: 65.4% to 74.3%) | 68.0% (CI: 62.6% to 73.1%) |
| 45 to 64 | 56.5% (CI: 51.6% to 61.3%) | 54.5% (CI: 49.1% to 59.8%) |
| 65+ | 42.0% (CI: 35.5% to 48.8%) | 43.8% (CI: 38.7% to 49.0%) |
Self-rated health by household income
Key findings:
- In 2011–2014, survey results indicated that the prevalence rate of excellent or very good self-rated health was highest in the highest household income quintile (72%) and lowest in the lowest household income quintile (41%) in Sudbury and districts.
- Reported rates of excellent or very good self-rated health decreased significantly in the lowest household income quintile between 2007–2010 and 2011–2014, but did not vary significantly within any of the other household income quintiles.
Notes:
- In this analysis, individuals are divided into “income quintiles”, or 5 groups of roughly equal size based on their reported household income. The groups are ranked, so that Quintile 1 represents the 20% of the population with the lowest incomes, and Quintile 5 represents the 20% with the highest incomes.
- Rates are age-standardized using the 2011 Canadian population.
- Rates are for the population aged 12 years and older.
- Data source: Canadian Community Health Survey (CCHS), 2007 to 2014, Statistics Canada, Share File, Ontario Ministry of Health and Long-Term Care.
Figure: Prevalence rate, “excellent” or “very good” self-rated health, by year and household income, ages 12+, 2007–2010 and 2011–2014
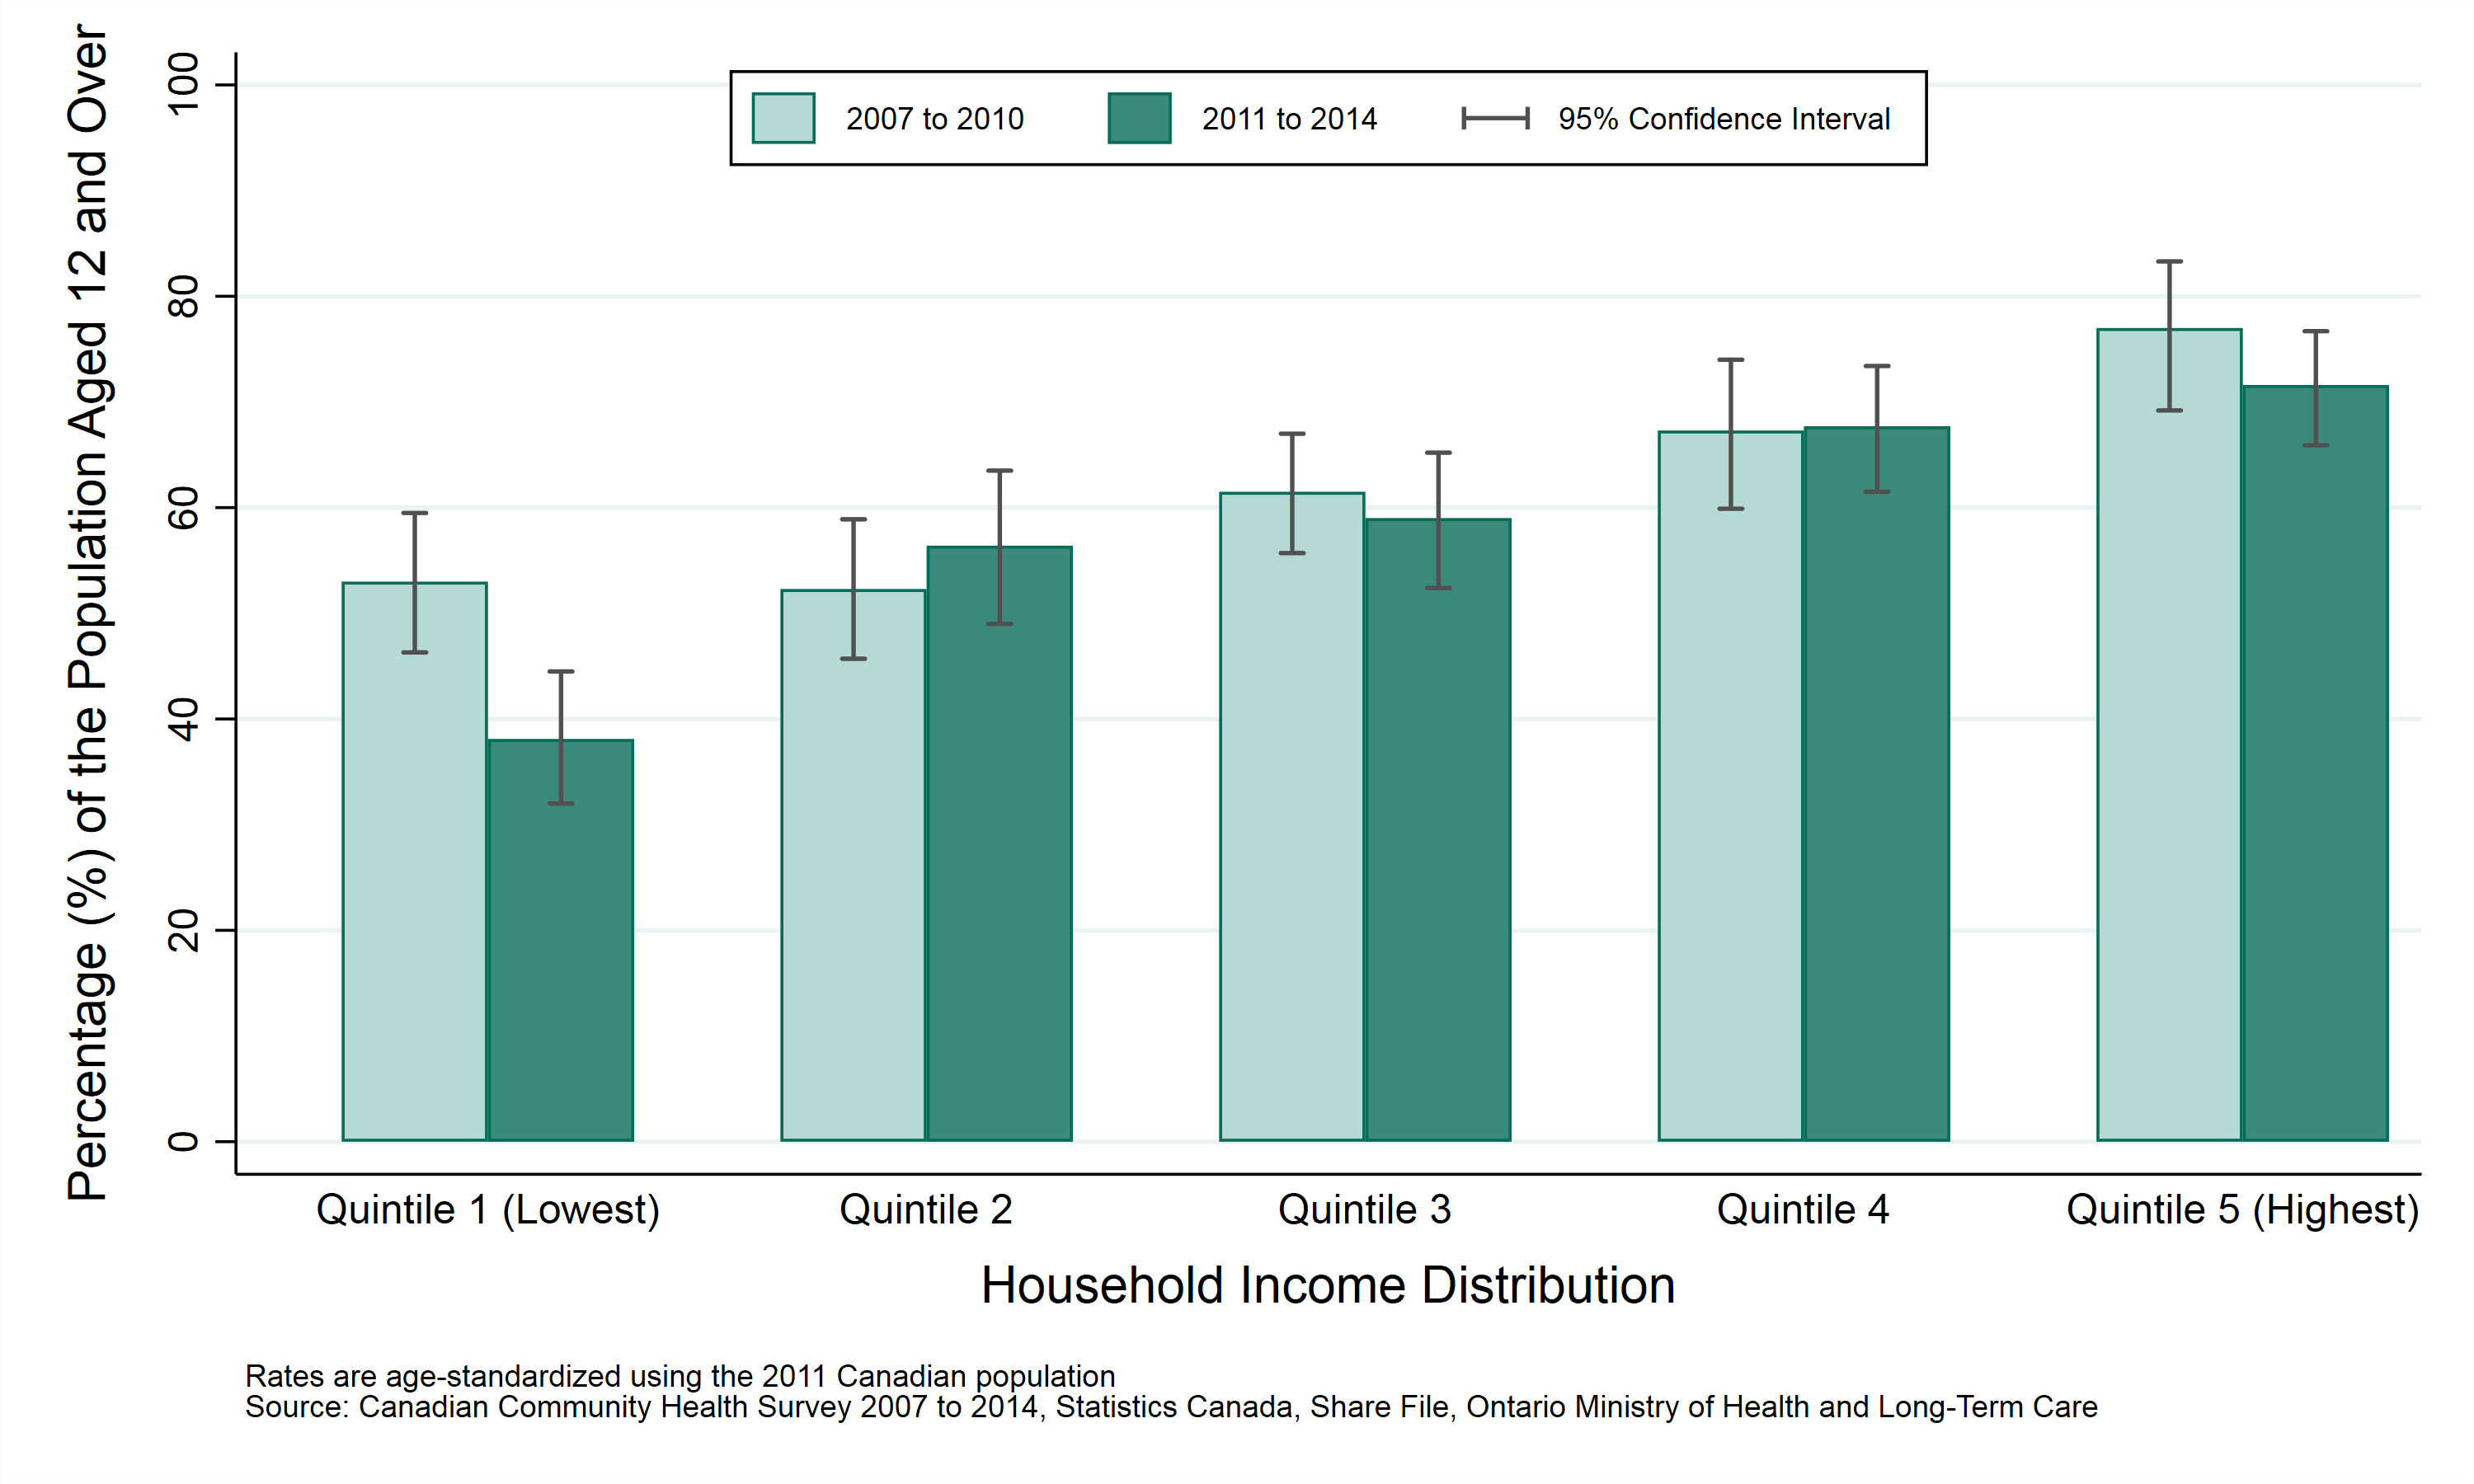
Table: Prevalence rate, “excellent” or “very good” self-rated health, by year and household income, ages 12+, 2007–2010 and 2011–2014
| Household Income Distribution | Prevalence Rate, 2007–2010 | Prevalence Rate, 2011–2014 |
|---|---|---|
| Quintile 1 (Lowest) | 53.0% (CI: 46.3% to 59.5%) | 38.1% (CI: 32.0% to 44.5%) |
| Quintile 2 | 52.3% (CI: 45.7% to 58.9%) | 56.4% (CI: 49.0% to 63.5%) |
| Quintile 3 | 61.5% (CI: 55.7% to 67.0%) | 59.0% (CI: 52.4% to 65.2%) |
| Quintile 4 | 67.3% (CI: 59.9% to 74.0%) | 67.7% (CI: 61.5% to 73.4%) |
| Quintile 5 (Highest) | 77.0% (CI: 69.2% to 83.3%) | 71.6% (CI: 65.9% to 76.7%) |
Self-rated health by education
Key findings:
- In 2011– 2014, survey results indicated that the prevalence rate of excellent or very good self-rated health was highest in people with a university degree (70%) and lowest in the people with less than a high school diploma (30%) in Sudbury and districts.
- Reported rates of excellent or very good self-rated health did not vary significantly between 2007– 2010 and 2011–2014 within any of the education level groups.
Notes:
- Rates are age-standardized using the 2011 Canadian population.
- Rates are for the population aged 12 years and older.
- Data source: Canadian Community Health Survey (CCHS), 2007 to 2014, Statistics Canada, Share File, Ontario Ministry of Health and Long-Term Care.
Figure: Prevalence rate, “excellent” or “very good” self-rated health, by year and education level, ages 12+, 2007–2010 and 2011–2014
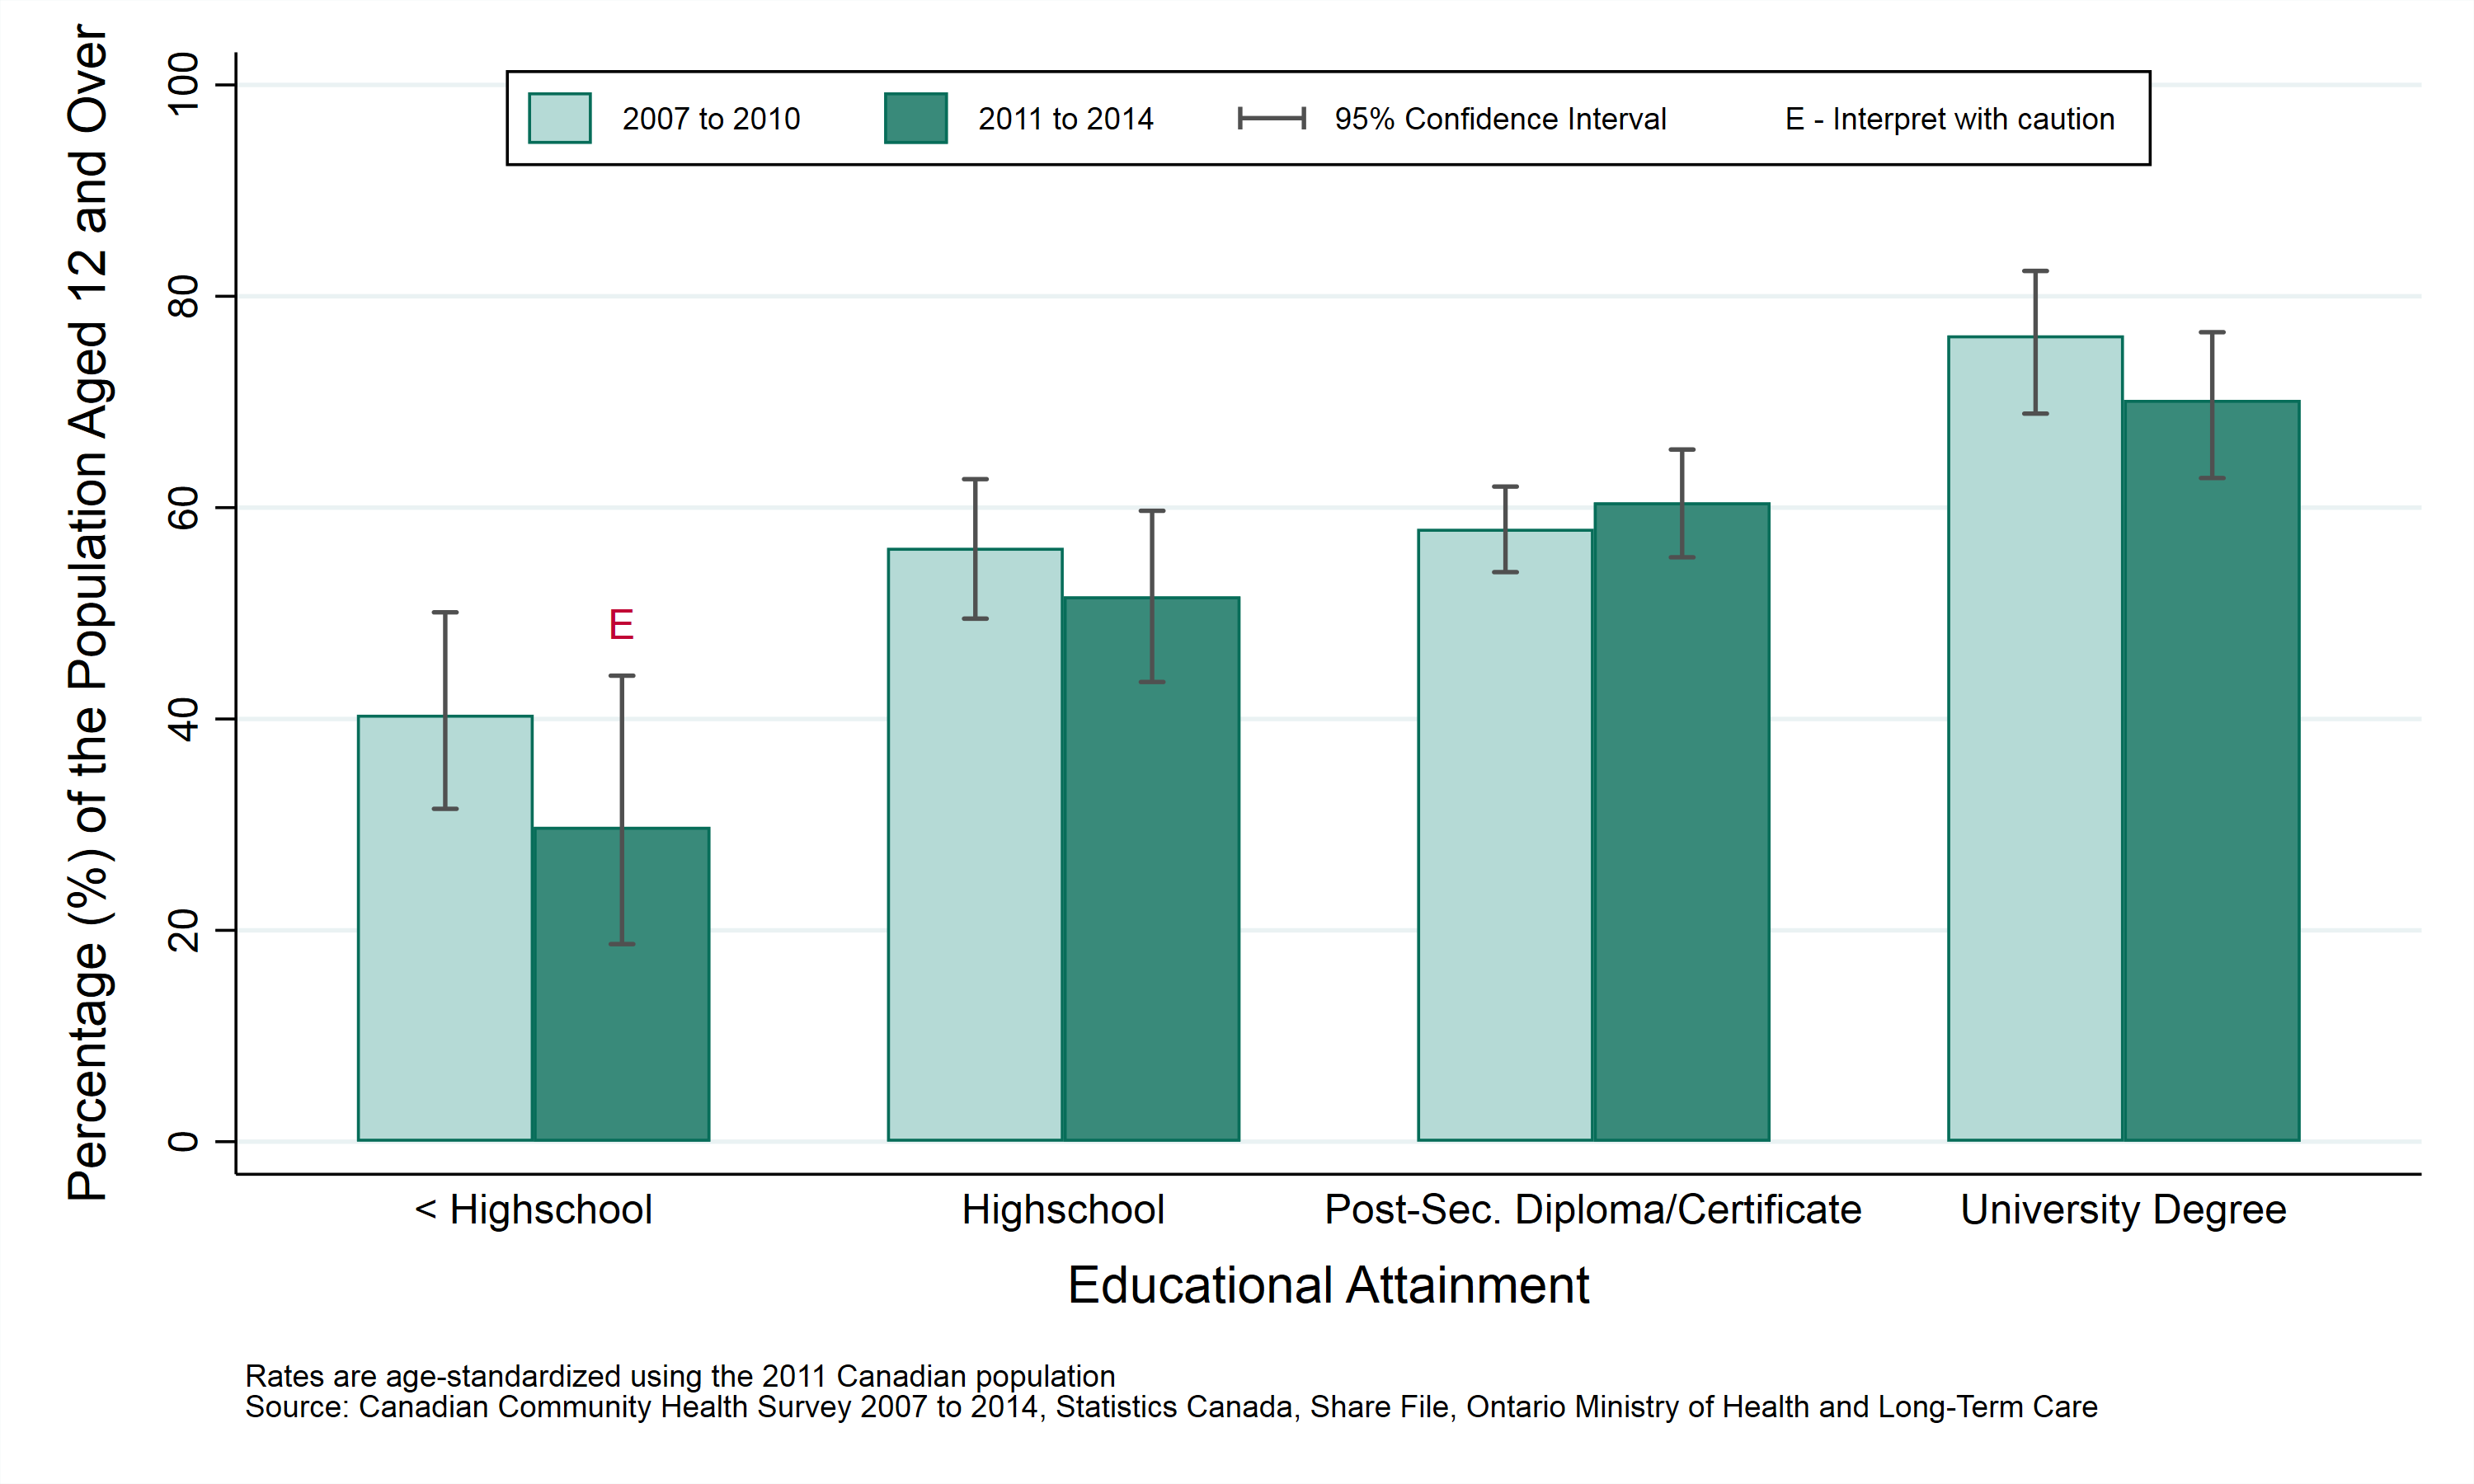
Table: Prevalence rate, “excellent” or “very good” self-rated health, by year and education level, ages 12+, 2007–2010 and 2011–2014
Note: Numbers followed by the letter “E” are to be interpreted with caution due to high sampling variability.
| Education | Prevalence Rate, 2007–2010 | Prevalence Rate, 2011–2014 |
|---|---|---|
| < High school diploma | 40.4% (CI: 31.5% to 50.1%) | 29.8% E (CI: 18.7% to 44.1%) |
| High school diploma | 56.2% (CI: 49.5% to 62.7%) | 51.6% (CI: 43.5% to 59.7%) |
| Trade, college or university diploma or certificate | 58.0% (CI: 53.9% to 62.0%) | 60.5% (CI: 55.3% to 65.5%) |
| University degree | 76.3% (CI: 68.9% to 82.4%) | 70.2% (CI: 62.8% to 76.6%) |
Self-rated health by first official language spoken
Key findings:
- Between 2011– 2014, survey results indicated that the prevalence rate of excellent or very good self-rated health was similar in both official language groups in Sudbury and districts.
- Reported rates of excellent or very good self-rated health did not vary significantly between 2007–2010, and 2011–2014 within either official language group.
Notes:
- Canada’s official languages are French and English. An individual’s “first official language spoken” is determined using their answers to a number of questions about the languages they speak. A small percentage of people are classified as having both French and English as their “first” official language spoken. Such individuals are included here as French. People speaking neither French nor English are excluded from this analysis.
- Rates are age-standardized using the 2011 Canadian population.
- Rates are for the population aged 12 years and older.
- Data source: Canadian Community Health Survey (CCHS), 2007 to 2014, Statistics Canada, Share File, Ontario Ministry of Health and Long-Term Care.
Figure: Prevalence rate, “excellent” or “very good” self-rated health, by year and first official language spoken, ages 12+, 2007–2010 and 2011–2014
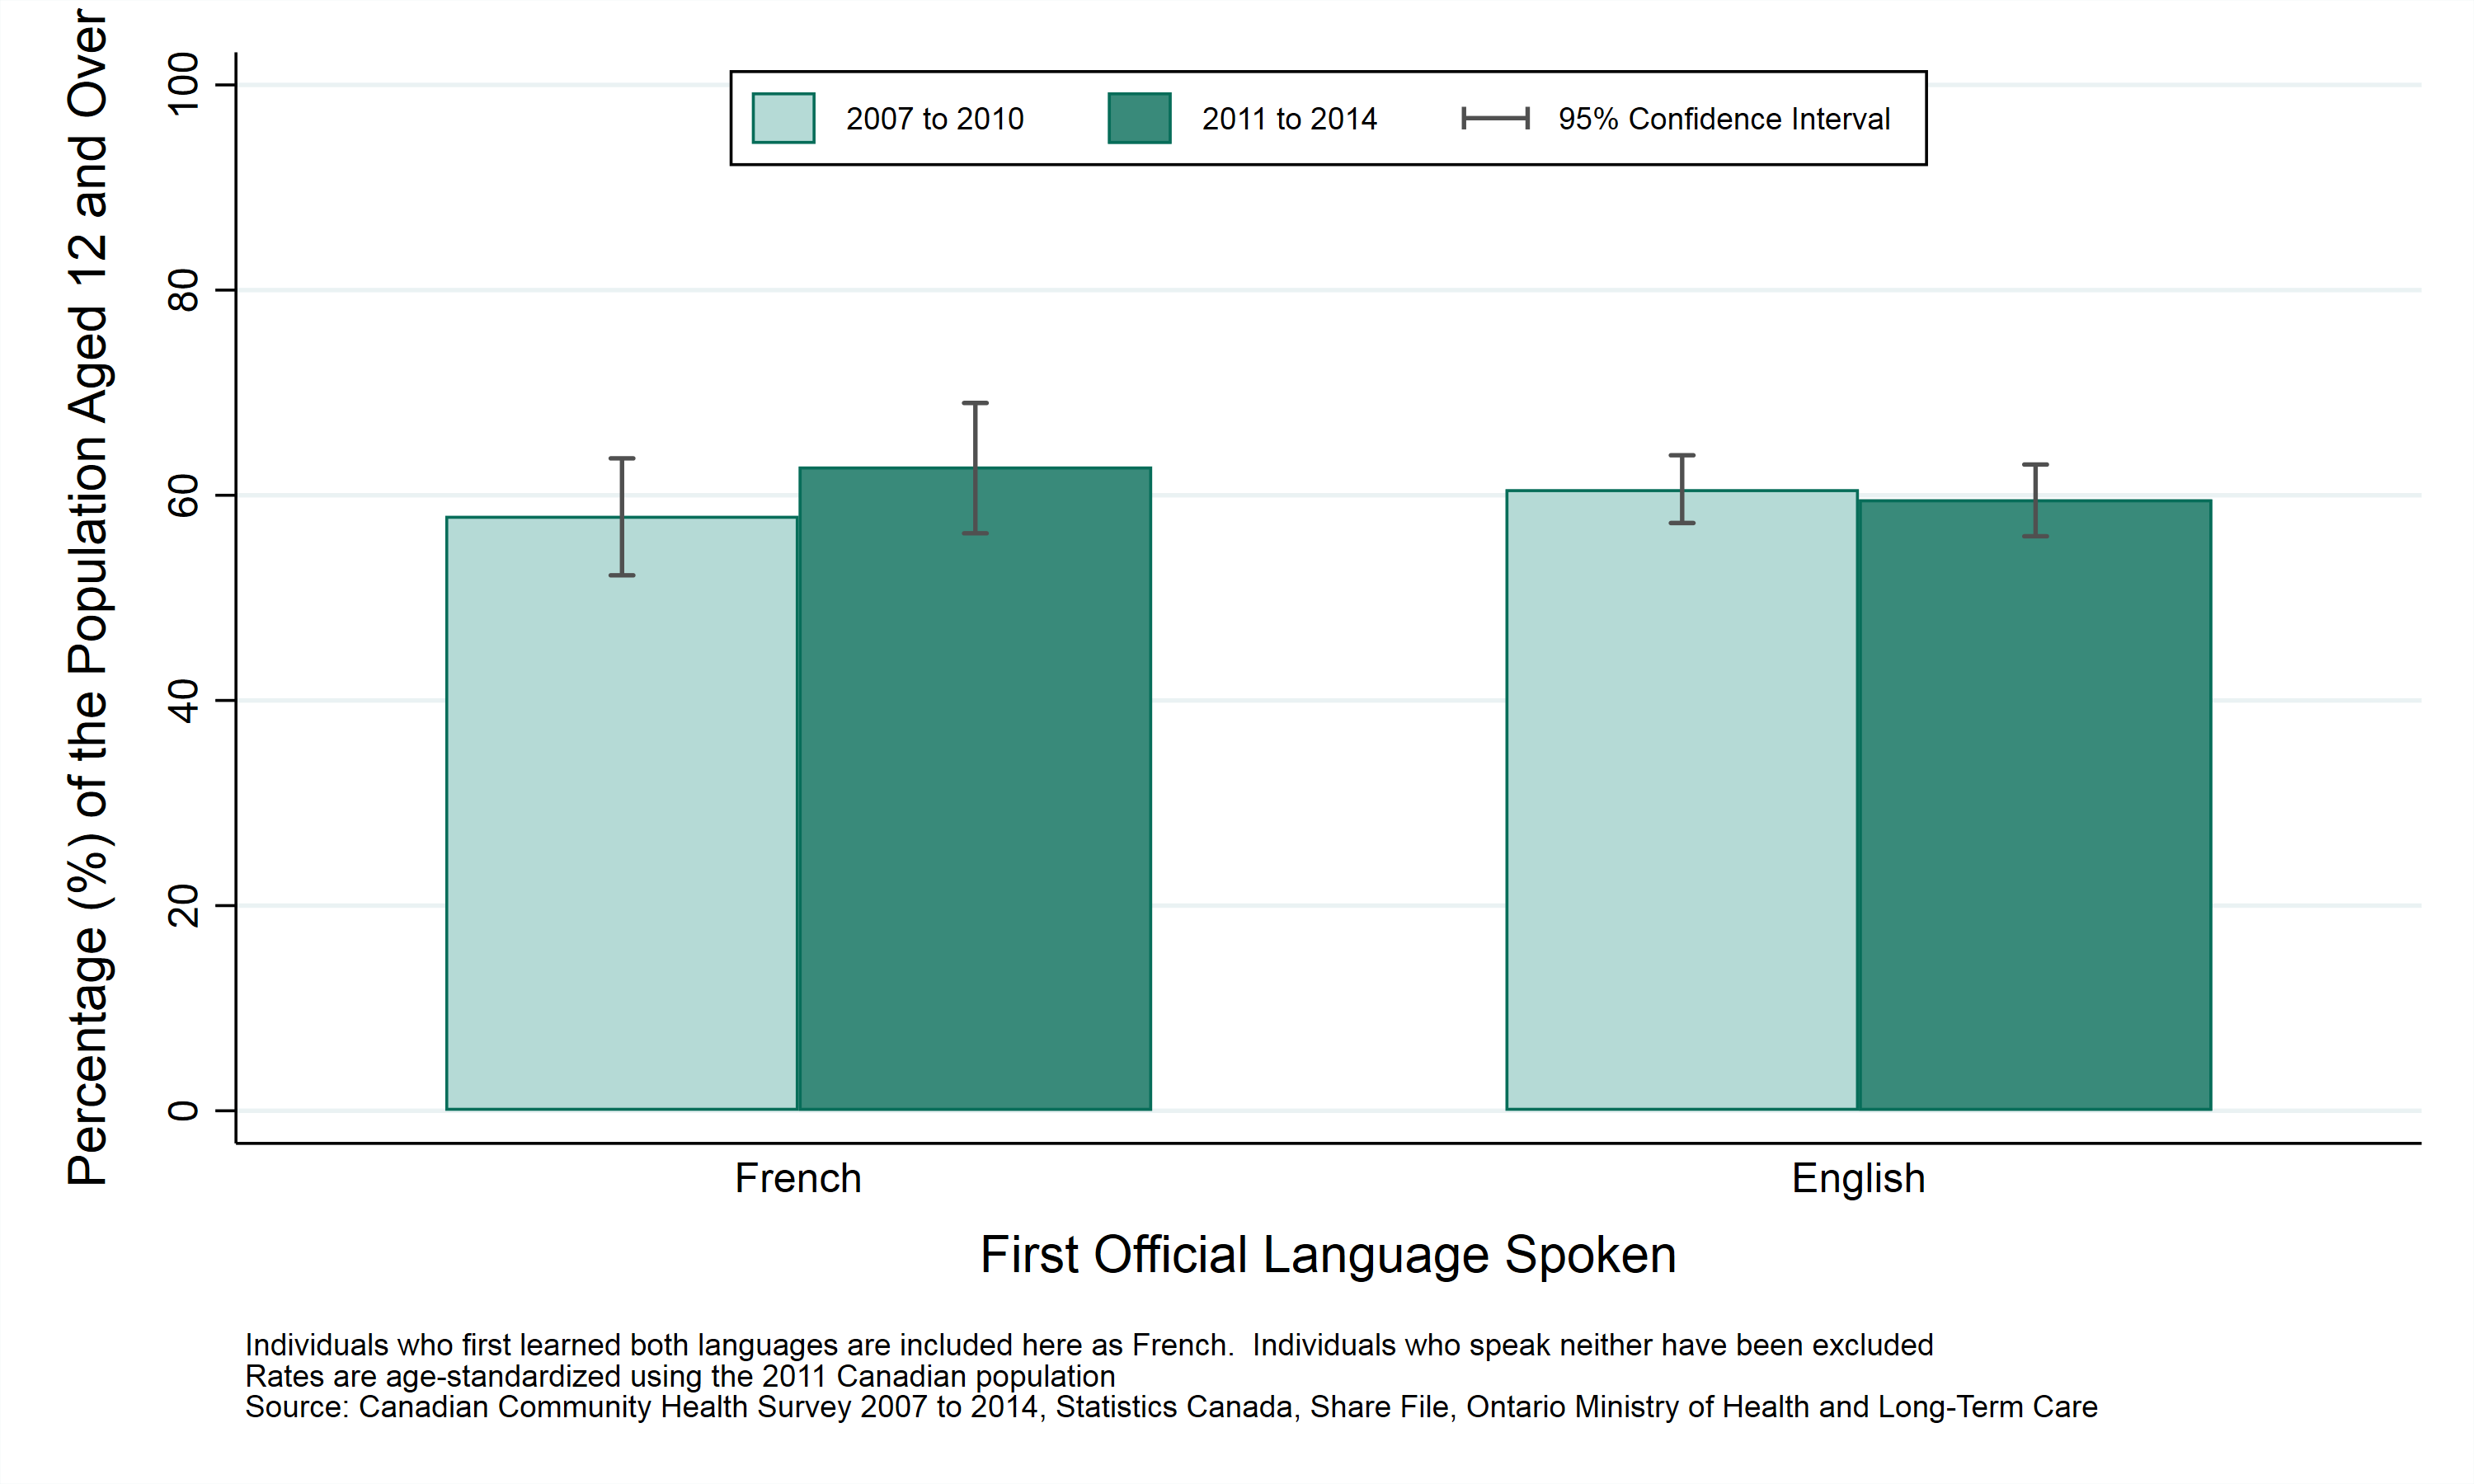
Table: Prevalence rate, “excellent” or “very good” self-rated health, by year and first official language spoken, ages 12+, 2007–2010 and 2011–2014
| First Official Language Spoken | Prevalence Rate, 2007–2010 | Prevalence Rate, 2011–2014 |
|---|---|---|
| French | 58.0% (CI: 52.2% to 63.6%) | 62.8% (CI: 56.3% to 69.0%) |
| English | 60.6% (CI: 57.3% to 63.9%) | 59.6% (CI: 56.0% to 63.0%) |
This item was last modified on December 11, 2025