Infant Feeding Study
- Infant Feeding Study- Summary Report (PDF, 1 MB)
The Sudbury & District Health Unit, the World Health Organization, and the Ontario Ministry of Health and Long-Term Care, fully support exclusive breastfeeding to six months of age, the introduction of solid foods at six months, and continued breastfeeding for the first two years of life and beyond.
Breastfeeding exclusively for the first six months — and continuing some breastfeeding for up to two years or longer with appropriate complementary feeding — is important for the nutrition, immunologic protection, growth and development of infants and toddlers (joint statement by Health Canada, Canadian Paediatric Society, Dietitians of Canada, and Public Health Association of Canada, 2012).
Breastfeeding contributes to women’s health by improving their social and economic equality and reducing health inequity (Breastfeeding Committee of Canada, 2002; Ontario Public Health Association, 2007).
This section presents key results from the Health Unit’s recent research study of infant feeding patterns in our community.
Purpose
The purpose of the SDHU Infant Feeding Study was to increase the Health Unit’s understanding of patterns of infant feeding practices and factors that influence these in the SDHU service area during the period of birth to 12 months. The results will shape program decisions at the SDHU with respect to parent education, breastfeeding promotion, clinical supports for mothers related to infant feeding and community-based supports for mothers and breastfeeding.
Methodology
This study involved a voluntary telephone study of mothers who gave birth between July 2010 and April 2011 in the SDHU area. Data was collected at three separate points in time during the child’s first year of life (at 2 months, 6 months and 12 months after birth). Following the same group of mothers over time allowed the researchers to track changes in infant feeding behaviours and to learn about the factors that influence those changes.
Eligible mothers who agreed to be called by a public health nurse in the Healthy Babies Healthy Children (HBHC) program within 48 hours of being discharged were invited to participate in the study when contacted.
Mothers were eligible to participate if they:
- were residents of Greater Sudbury, Sudbury District or Manitoulin District
- spoke English or French
- gave birth to a single child
- had a live birth (excludes stillbirths, miscarriages and deaths)
- had an infant weighing at least 2500 grams
- had a full-term infant at least 37 weeks gestation
- were discharged home with their infant
- were not living on reserve
- were available by telephone
In total, 1242 mothers gave birth within the SDHU area during the study period. Of these, 905 mothers were eligible to participate in the research study. A total of 690 mothers agreed to participate.
Participant characteristics
Nearly all participants in the SDHU Infant Feeding Study (IFS) gave birth at Health Sciences North/Horizon Santé-Nord (HSN) (98%) and the births were attended by a physician (90%). Most had vaginal births (75%) and stayed in the hospital between 24 and 48 hours (82%). The mothers’ ages ranged from 16 to 46 years, with an average age of 28 years. The majority of participants reported living with a partner/spouse (89%) and with at least one other child, 19 years or younger, besides the newborn infant (87%). The majority indicated that they worked outside the home prior to giving birth (84%), most of them full-time (76%).
The sample of mothers recruited for the IFS was compared to all mothers who gave birth in the SDHU area during the study period to assess the representativeness of the sample. The sample was found to be representative of all SDHU mothers for the majority of the characteristics. However, a smaller proportion of the IFS sample had given birth somewhere other than HSN (1.3% vs. 4.5%), and were attended by a midwife (8% vs. 15%).
Compared to all mothers who gave birth in the SDHU area during the study period, a larger proportion of participants in the IFS were breastfeeding at discharge from the hospital (72% vs. 50%), and had a university degree or above (34% vs. 16%), as did their spouse/partner (29% vs. 12%). Participating mothers were also more likely to have an annual household income of more than $80,000 (29% vs. 12%).
Because of these noted differences, the mothers in the study sample are not necessarily representative of all mothers residing in the SDHU area who gave birth during the study period.
Results
Breastfeeding initiation
A large majority (84%) of participating mothers attempted to breastfeed their infants at least once. Rates of breastfeeding initiation varied significantly between certain groups — for example, a higher proportion of mothers with a university education initiated breastfeeding (95%) compared to mothers with a high school education or less (73%).
Results indicate that the following are important predictors of breastfeeding initiation after other factors are taken into account (see Table 1 and Figure 1).
Table 1. Predictors of Breastfeeding Initiation
| Predictor | Interpretation: Mothers who initiated breastfeeding were more likely to . . . |
| Maternal education | Have a university education |
| Other adult in the household | Be living with other adults in their household |
| Other child in the household | Be living without other children in their household |
| Timing of decision re: feeding | Have considered how they would feed their child before pregnancy |
| Received info on breastfeeding | Have received information on breastfeeding |
| Received info on formula feeding | Have not received information on formula feeding |
| Parkyn score* | Have infants who are less vulnerable |
* Universal screening tool completed with all consenting new mothers in Ontario to identify vulnerable families who may benefit from ongoing support through HBHC or other community services
Figure 1a. Predicted Probability of Breastfeeding Initiation, by Parkyn Score
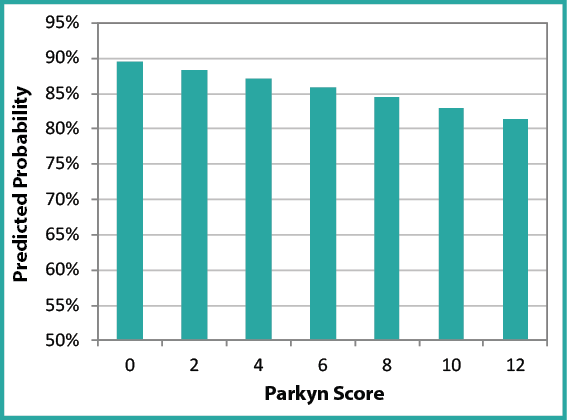
Data Table for Figure 1a. Predicted Probability of Breastfeeding Initiation, by Parkyn Score
| Parkyn Score | Predicted Probability |
|---|---|
| 0 | 89.7% |
| 2 | 88.5% |
| 4 | 87.2% |
| 6 | 86.1% |
| 8 | 84.6% |
| 10 | 83.1% |
| 12 | 81.1% |
Figure 1b. Predicted Probability of Breastfeeding Initiation, by Maternal Education Attainment
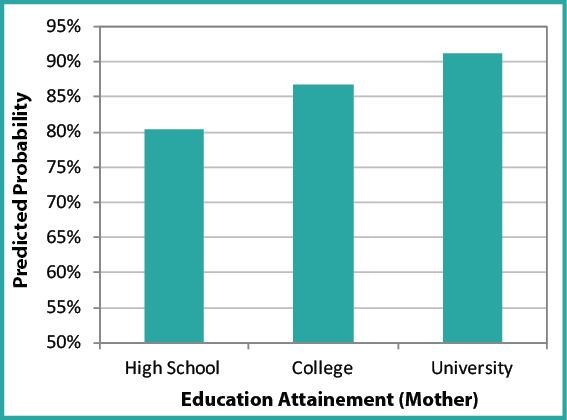
Data Table for Figure 1b. Predicted Probability of Breastfeeding Initiation, by Maternal Education Attainment
| Maternal Education Attainment | Predicted Probability |
|---|---|
| High School | 80.7% |
| College | 86.3% |
| University | 91.0% |
Figure 1c. Predicted Probability of Breastfeeding Initiation, by Timing of Decision
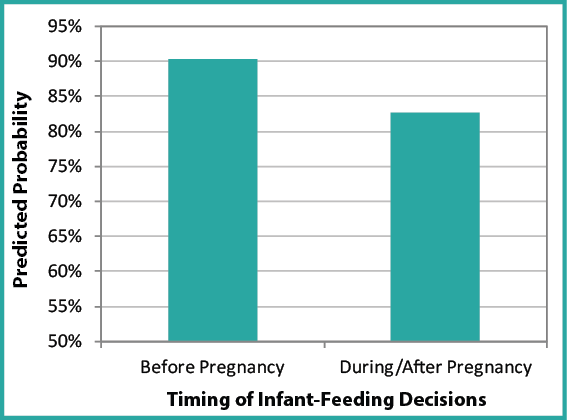
Data Table for Figure 1c. Predicted Probability of Breastfeeding Initiation, by Timing of Decision
| Timing of Decision | Predicted Probability |
|---|---|
| Before Pregnancy | 90.1% |
| During / After Pregnancy | 83.1% |
Figure 1d. Predicted Probability of Breastfeeding Initiation, by Information Received by Mother
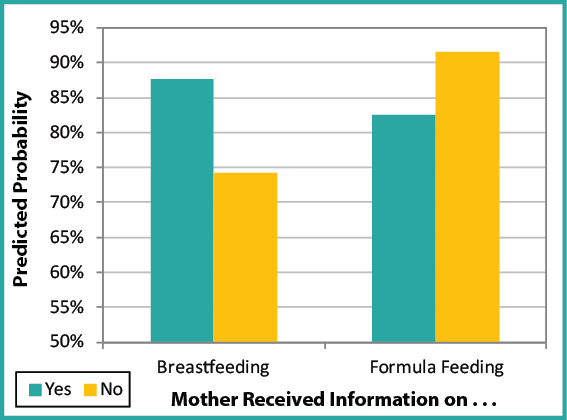
Data Table for Figure 1d. Predicted Probability of Breastfeeding Initiation, by Information Received by Mother
| Information Received by Mother | Predicted Probability, Yes | Predicted Probability, No |
|---|---|---|
| Mother Received Info on Breastfeeding | 87.4% | 74.1% |
| Mother Received Info on Formula Feeding | 82.4% | 91.2% |
Figure 1e. Predicted Probability of Breastfeeding Initiation, by Other Persons Within Mother’s Household
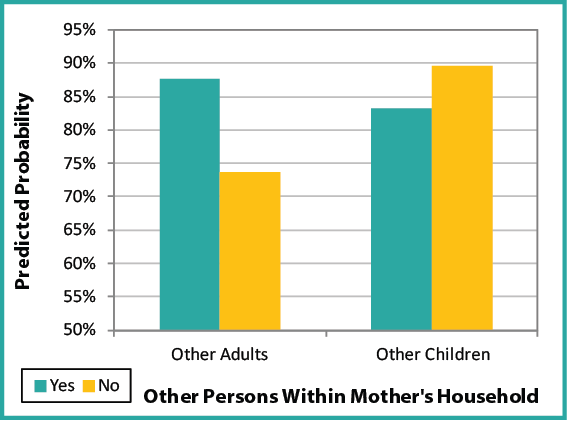
Data Table for Figure 1e. Predicted Probability of Breastfeeding Initiation, by Other Persons Within Mother’s Household
| Other Persons Within Mother's Household | Predicted Probability, Yes | Predicted Probability, No |
|---|---|---|
| Other Adults in the Household | 87.6 | 73.5 |
| Other Children in the Household | 83.1 | 89.6 |
The following factors were found NOT to be predictive of breastfeeding initiation after adjusting for other factors:
- maternal age
- sex (infant)
- birth weight
- length of gestation
- type of delivery
- length of stay in hospital
- household income
- paternal education
- mother tongue
- ethnicity
- attendance at a prenatal class
- received coupons for formula
- employment status
- receiving government assistance
- on maternity leave
Breastfeeding duration
Of those mothers who attempted to breastfeed their child, the proportion who continued to breastfeed their child declined rapidly over the first 10 weeks after birth, from 91% at the end of the first week to 71% at the end of the 10th week (see Figure 2). Afterwards, the rate of decline slowed the proportion still breastfeeding decreased steadily throughout the remainder of the first year after birth. More than half of the mothers (55%) were still breastfeeding at six months (26 weeks) after birth. Almost one-quarter (23%) of mothers continued to breastfeed their child one year (52 weeks) after their birth.
Figure 2. Proportion of Mothers Breastfeeding, by Week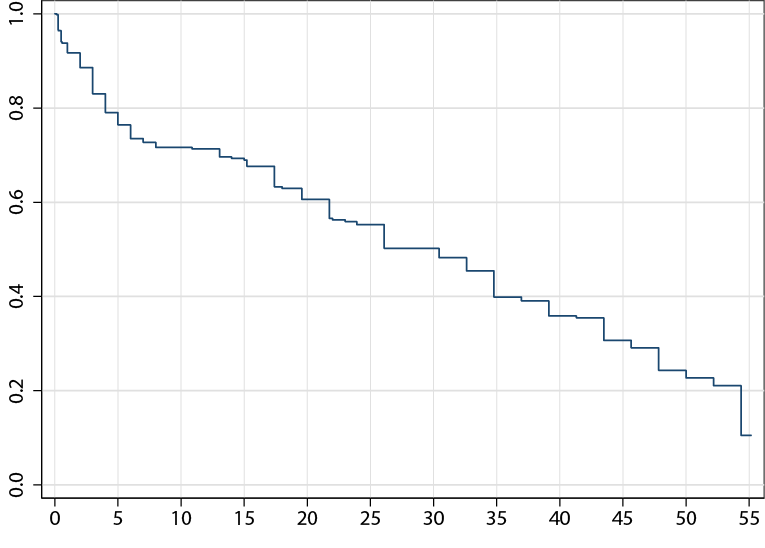
Data Table for Figure 2. Proportion of Mothers Breastfeeding, by Week
| Time (Weeks) | % Breastfeeding |
|---|---|
| 0.00 | 100.00% |
| 0.14 | 99.83% |
| 0.25 | 96.65% |
| 0.29 | 96.40% |
| 0.50 | 94.05% |
| 0.57 | 93.79% |
| 1.00 | 91.70% |
| 2.00 | 88.57% |
| 3.00 | 83.01% |
| 4.00 | 79.05% |
| 5.00 | 76.40% |
| 6.00 | 73.50% |
| 7.00 | 72.70% |
| 8.00 | 71.65% |
| 10.87 | 71.31% |
| 13.04 | 69.64% |
| 14.00 | 69.30% |
| 15.00 | 68.97% |
| 15.22 | 67.63% |
| 17.39 | 63.28% |
| 18.00 | 62.94% |
| 19.57 | 60.60% |
| 21.74 | 56.58% |
| 22.00 | 56.25% |
| 23.00 | 55.91% |
| 23.91 | 55.24% |
| 26.09 | 50.22% |
| 30.44 | 48.23% |
| 32.61 | 45.44% |
| 34.78 | 39.86% |
| 36.96 | 39.06% |
| 39.13 | 35.87% |
| 41.31 | 35.47% |
| 43.48 | 30.69% |
| 45.66 | 29.10% |
| 47.83 | 24.31% |
| 50.00 | 22.72% |
| 52.18 | 21.06% |
| 54.35 | 10.53% |
Mothers who continued to breastfeed for at least two months after their infants were born were asked why they chose to feed this way. The main reasons given were that they felt it was better for their baby (64%), for their baby’s physical health (62%), for financial reasons (29%), out of convenience (25%), or to help with infant bonding/closeness (17%). Similar reasons were given by the mothers who were still breastfeeding when their infants were six months and one year old. As with breastfeeding initiation, certain groups of women breastfed for a longer time on average. After adjusting for multiple factors, certain characteristics were found to be important predictors of prolonged breastfeeding duration (see Table 2 and Figure 3).
Table 2. Predictors of Prolonged Breastfeeding Duration
| Predictor | Interpretation: Mothers who breastfed for a longer time were more likely to . . . |
| Mothers’ age | Be older |
| Maternal education | Have a university education |
| Breastfeeding in public | Report having breastfed in public |
| Timing of decision re: feeding | Have considered how they would feed their child before pregnancy |
| Attendance at prenatal class | Had attended a prenatal class in the past (ever) |
| Parkyn score* | Have infants who are less vulnerable |
* Universal screening tool completed with all consenting new mothers in Ontario to identify vulnerable families who may benefit from ongoing support through HBHC or other community services
Figure 3a. Proportion of Mothers Breastfeeding, by Week and Maternal Age
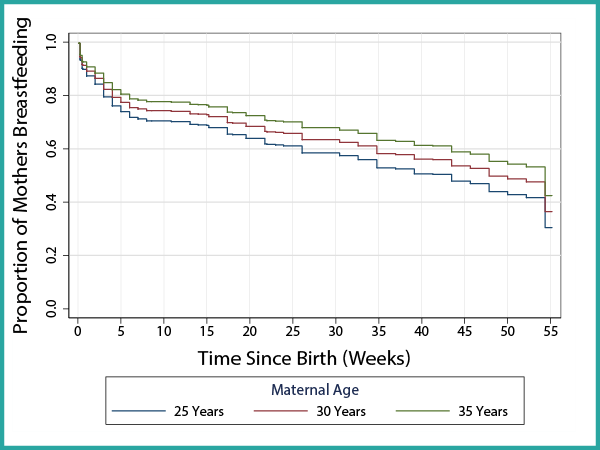
Data Table for Figure 3a. Proportion of Mothers Breastfeeding, by Week and Maternal Age
| Time (Weeks) | Maternal Age 25 Years | Maternal Age 30 Years | Maternal Age 35 Years |
|---|---|---|---|
| 0.00 | 100.00% | 100.00% | 100.00% |
| 0.14 | 99.76% | 99.80% | 99.82% |
| 0.25 | 96.61% | 97.07% | 97.46% |
| 0.29 | 96.36% | 96.85% | 97.27% |
| 0.50 | 94.41% | 95.16% | 95.80% |
| 0.57 | 94.17% | 94.94% | 95.62% |
| 1.00 | 92.27% | 93.29% | 94.18% |
| 2.00 | 89.56% | 90.92% | 92.11% |
| 3.00 | 85.03% | 86.93% | 88.61% |
| 4.00 | 81.52% | 83.83% | 85.87% |
| 5.00 | 79.20% | 81.77% | 84.04% |
| 6.00 | 76.71% | 79.54% | 82.07% |
| 7.00 | 76.05% | 78.95% | 81.54% |
| 8.00 | 75.17% | 78.16% | 80.84% |
| 10.87 | 74.90% | 77.91% | 80.61% |
| 13.04 | 73.57% | 76.72% | 79.55% |
| 14.00 | 73.31% | 76.48% | 79.34% |
| 15.00 | 72.02% | 75.32% | 78.29% |
| 15.22 | 68.68% | 72.29% | 75.57% |
| 17.39 | 68.41% | 72.05% | 75.35% |
| 18.00 | 66.57% | 70.38% | 73.83% |
| 19.57 | 63.71% | 67.76% | 71.45% |
| 21.74 | 63.45% | 67.51% | 71.23% |
| 22.00 | 63.19% | 67.27% | 71.01% |
| 23.00 | 62.67% | 66.80% | 70.58% |
| 23.91 | 59.07% | 63.48% | 67.54% |
| 26.09 | 57.60% | 62.11% | 66.28% |
| 30.44 | 55.55% | 60.19% | 64.51% |
| 32.61 | 51.30% | 56.20% | 60.80% |
| 34.78 | 50.69% | 55.61% | 60.25% |
| 36.96 | 48.19% | 53.24% | 58.03% |
| 39.13 | 47.88% | 52.95% | 57.75% |
| 41.31 | 44.43% | 49.64% | 54.62% |
| 43.48 | 43.14% | 48.39% | 53.43% |
| 45.66 | 39.01% | 44.36% | 49.56% |
| 47.83 | 37.55% | 42.92% | 48.18% |
| 50.00 | 36.05% | 41.44% | 46.74% |
| 52.18 | 23.40% | 28.53% | 33.86% |
| 54.35 | 36.05% | 41.44% | 46.74% |
Figure 3b. Proportion of Mothers Breastfeeding, by Week and Parkyn Score
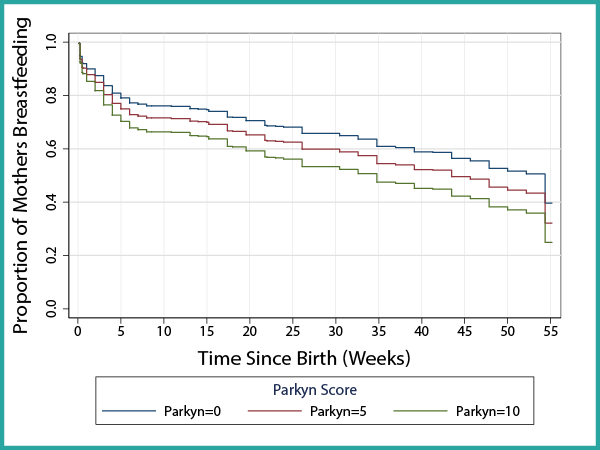
Data Table for Figure 3b. Proportion of Mothers Breastfeeding, by Week and Parkyn Score
| Time (Weeks) | Parkyn=0 | Parkyn=5 | Parkyn=10 |
|---|---|---|---|
| 0.00 | 100.00% | 100.00% | 100.00% |
| 0.14 | 99.81% | 99.77% | 99.72% |
| 0.25 | 97.31% | 96.71% | 95.98% |
| 0.29 | 97.11% | 96.47% | 95.68% |
| 0.50 | 95.56% | 94.57% | 93.38% |
| 0.57 | 95.36% | 94.34% | 93.09% |
| 1.00 | 93.84% | 92.49% | 90.87% |
| 2.00 | 91.65% | 89.86% | 87.69% |
| 3.00 | 87.97% | 85.44% | 82.43% |
| 4.00 | 85.09% | 82.02% | 78.40% |
| 5.00 | 83.17% | 79.75% | 75.75% |
| 6.00 | 81.10% | 77.32% | 72.92% |
| 7.00 | 80.54% | 76.67% | 72.17% |
| 8.00 | 79.81% | 75.81% | 71.18% |
| 10.87 | 79.57% | 75.54% | 70.87% |
| 13.04 | 78.46% | 74.24% | 69.38% |
| 14.00 | 78.24% | 73.99% | 69.09% |
| 15.00 | 78.02% | 73.74% | 68.80% |
| 15.22 | 77.15% | 72.73% | 67.64% |
| 17.39 | 74.30% | 69.45% | 63.92% |
| 18.00 | 74.08% | 69.19% | 63.62% |
| 19.57 | 72.50% | 67.38% | 61.59% |
| 21.74 | 70.02% | 64.57% | 58.45% |
| 22.00 | 69.79% | 64.31% | 58.16% |
| 23.00 | 69.57% | 64.05% | 57.88% |
| 23.91 | 69.12% | 63.55% | 57.32% |
| 26.09 | 65.96% | 60.00% | 53.42% |
| 30.44 | 64.66% | 58.55% | 51.84% |
| 32.61 | 62.83% | 56.52% | 49.64% |
| 34.78 | 59.00% | 52.33% | 45.16% |
| 36.96 | 58.44% | 51.72% | 44.51% |
| 39.13 | 56.16% | 49.25% | 41.92% |
| 41.31 | 55.87% | 48.94% | 41.59% |
| 43.48 | 52.66% | 45.51% | 38.05% |
| 45.66 | 51.45% | 44.23% | 36.74% |
| 47.83 | 47.51% | 40.11% | 32.58% |
| 50.00 | 46.10% | 38.66% | 31.14% |
| 52.18 | 44.65% | 37.16% | 29.67% |
| 54.35 | 31.72% | 24.43% | 17.73% |
Figure 3c. Proportion of Mothers Breastfeeding, by Week and Timing of Decision on How to Feed Baby
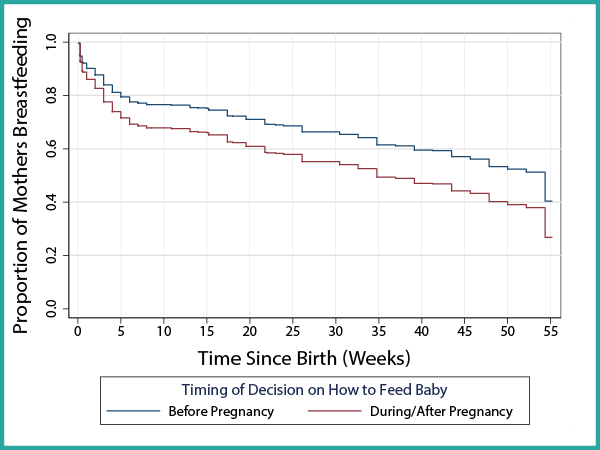
Data Table for Figure 3c. Proportion of Mothers Breastfeeding, by Week and Timing of Decision on How to Feed Baby
| Time (Weeks) | Decided to Breastfeed Before Pregnancy | Decided to Breastfeed During/After Pregnancy |
|---|---|---|
| 0.00 | 100.00% | 100.00% |
| 0.14 | 99.81% | 99.74% |
| 0.25 | 97.34% | 96.27% |
| 0.29 | 97.14% | 95.99% |
| 0.50 | 95.60% | 93.84% |
| 0.57 | 95.41% | 93.58% |
| 1.00 | 93.90% | 91.50% |
| 2.00 | 91.74% | 88.53% |
| 3.00 | 88.08% | 83.59% |
| 4.00 | 85.23% | 79.80% |
| 5.00 | 83.33% | 77.29% |
| 6.00 | 81.27% | 74.61% |
| 7.00 | 80.72% | 73.90% |
| 8.00 | 79.99% | 72.96% |
| 10.87 | 79.76% | 72.66% |
| 13.04 | 78.65% | 71.24% |
| 14.00 | 78.43% | 70.96% |
| 15.00 | 78.22% | 70.69% |
| 15.22 | 77.35% | 69.59% |
| 17.39 | 74.53% | 66.03% |
| 18.00 | 74.31% | 65.75% |
| 19.57 | 72.74% | 63.80% |
| 21.74 | 70.28% | 60.77% |
| 22.00 | 70.05% | 60.49% |
| 23.00 | 69.83% | 60.22% |
| 23.91 | 69.38% | 59.68% |
| 26.09 | 66.25% | 55.91% |
| 30.44 | 64.95% | 54.37% |
| 32.61 | 63.13% | 52.23% |
| 34.78 | 59.32% | 47.84% |
| 36.96 | 58.76% | 47.20% |
| 39.13 | 56.49% | 44.65% |
| 41.31 | 56.21% | 44.33% |
| 43.48 | 53.01% | 40.81% |
| 45.66 | 51.80% | 39.51% |
| 47.83 | 47.88% | 35.34% |
| 50.00 | 46.47% | 33.89% |
| 52.18 | 45.02% | 32.40% |
| 54.35 | 32.10% | 20.10% |
Figure 3d. Proportion of Mothers Breastfeeding, by Week and Mother’s Attendance at Prenatal Classes
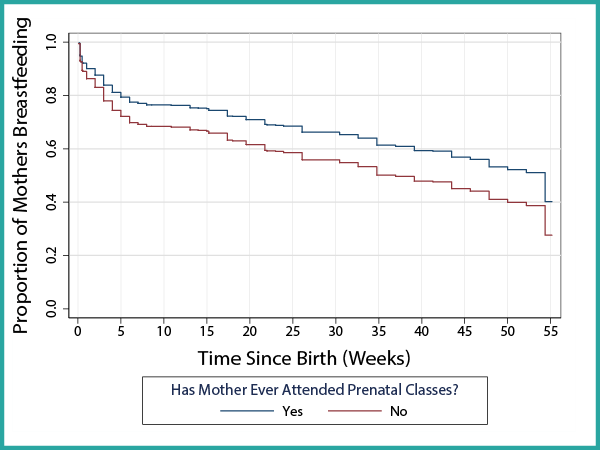
Data Table for Figure 3d. Proportion of Mothers Breastfeeding, by Week and Mother’s Attendance at Prenatal Classes
| Time (Weeks) | Mother attended prenatal classes | Mother did not attend prenatal classes |
|---|---|---|
| 0.00 | 100.00% | 100.00% |
| 0.14 | 99.81% | 99.75% |
| 0.25 | 97.32% | 96.37% |
| 0.29 | 97.12% | 96.10% |
| 0.50 | 95.57% | 94.01% |
| 0.57 | 95.37% | 93.75% |
| 1.00 | 93.86% | 91.72% |
| 2.00 | 91.67% | 88.83% |
| 3.00 | 87.99% | 84.01% |
| 4.00 | 85.12% | 80.30% |
| 5.00 | 83.21% | 77.85% |
| 6.00 | 81.14% | 75.22% |
| 7.00 | 80.58% | 74.52% |
| 8.00 | 79.85% | 73.60% |
| 10.87 | 79.62% | 73.31% |
| 13.04 | 78.50% | 71.91% |
| 14.00 | 78.28% | 71.64% |
| 15.00 | 78.07% | 71.37% |
| 15.22 | 77.20% | 70.29% |
| 17.39 | 74.36% | 66.79% |
| 18.00 | 74.13% | 66.51% |
| 19.57 | 72.56% | 64.59% |
| 21.74 | 70.08% | 61.61% |
| 22.00 | 69.85% | 61.34% |
| 23.00 | 69.63% | 61.07% |
| 23.91 | 69.18% | 60.54% |
| 26.09 | 66.03% | 56.81% |
| 30.44 | 64.73% | 55.29% |
| 32.61 | 62.90% | 53.17% |
| 34.78 | 59.08% | 48.82% |
| 36.96 | 58.52% | 48.19% |
| 39.13 | 56.24% | 45.65% |
| 41.31 | 55.95% | 45.33% |
| 43.48 | 52.75% | 41.83% |
| 45.66 | 51.53% | 40.53% |
| 47.83 | 47.60% | 36.37% |
| 50.00 | 46.19% | 34.92% |
| 52.18 | 44.73% | 33.42% |
| 54.35 | 31.81% | 21.01% |
Figure 3e. Proportion of Mothers Breastfeeding, by Week and Breastfeeding in Public
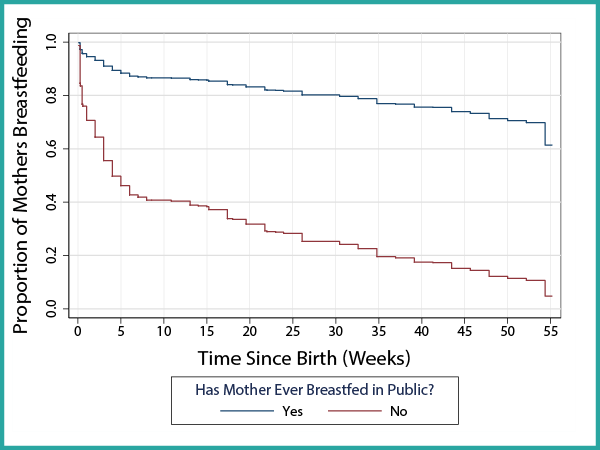
Data Table for Figure 3e. Proportion of Mothers Breastfeeding, by Week and Breastfeeding in Public
| Time (Weeks) | Has Breastfed in Public | Has Not Breastfed in Public |
|---|---|---|
| 0.00 | 100.00% | 100.00% |
| 0.14 | 99.90% | 99.38% |
| 0.25 | 98.59% | 91.30% |
| 0.29 | 98.48% | 90.67% |
| 0.50 | 97.65% | 85.90% |
| 0.57 | 97.55% | 85.32% |
| 1.00 | 96.74% | 80.86% |
| 2.00 | 95.55% | 74.73% |
| 3.00 | 93.53% | 65.14% |
| 4.00 | 91.92% | 58.28% |
| 5.00 | 90.83% | 54.00% |
| 6.00 | 89.64% | 49.63% |
| 7.00 | 89.32% | 48.50% |
| 8.00 | 88.89% | 47.04% |
| 10.87 | 88.76% | 46.59% |
| 13.04 | 88.10% | 44.44% |
| 14.00 | 87.97% | 44.02% |
| 15.00 | 87.85% | 43.62% |
| 15.22 | 87.33% | 42.01% |
| 17.39 | 85.64% | 37.05% |
| 18.00 | 85.50% | 36.67% |
| 19.57 | 84.54% | 34.12% |
| 21.74 | 83.02% | 30.38% |
| 22.00 | 82.88% | 30.05% |
| 23.00 | 82.74% | 29.72% |
| 23.91 | 82.46% | 29.09% |
| 26.09 | 80.48% | 24.88% |
| 30.44 | 79.64% | 23.28% |
| 32.61 | 78.46% | 21.14% |
| 34.78 | 75.93% | 17.14% |
| 36.96 | 75.55% | 16.60% |
| 39.13 | 73.99% | 14.53% |
| 41.31 | 73.79% | 14.28% |
| 43.48 | 71.55% | 11.72% |
| 45.66 | 70.69% | 10.84% |
| 47.83 | 67.81% | 8.31% |
| 50.00 | 66.75% | 7.51% |
| 52.18 | 65.64% | 6.75% |
| 54.35 | 54.91% | 2.15% |
Figure 3f. Proportion of Mothers Breastfeeding, by Week and Maternal Education
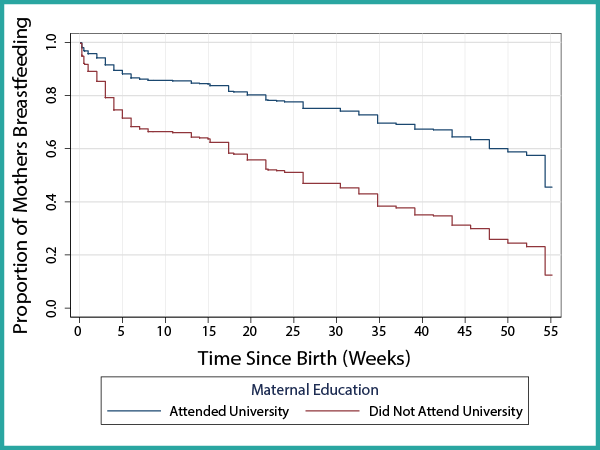
Data Table for Figure 3f. Proportion of Mothers Breastfeeding, by Week and Maternal Education
| Time (Weeks) | Attended University | Did Not Attend University |
|---|---|---|
| 0.00 | 100.00% | 100.00% |
| 0.14 | 99.87% | 99.66% |
| 0.25 | 98.15% | 95.17% |
| 0.29 | 98.01% | 94.82% |
| 0.50 | 96.93% | 92.08% |
| 0.57 | 96.80% | 91.73% |
| 1.00 | 95.74% | 89.10% |
| 2.00 | 94.20% | 85.36% |
| 3.00 | 91.59% | 79.22% |
| 4.00 | 89.52% | 74.58% |
| 5.00 | 88.13% | 71.55% |
| 6.00 | 86.62% | 68.35% |
| 7.00 | 86.21% | 67.50% |
| 8.00 | 85.67% | 66.39% |
| 10.87 | 85.50% | 66.04% |
| 13.04 | 84.68% | 64.36% |
| 14.00 | 84.52% | 64.03% |
| 15.00 | 84.36% | 63.71% |
| 15.22 | 83.71% | 62.43% |
| 17.39 | 81.58% | 58.31% |
| 18.00 | 81.41% | 57.98% |
| 19.57 | 80.21% | 55.76% |
| 21.74 | 78.33% | 52.35% |
| 22.00 | 78.15% | 52.04% |
| 23.00 | 77.98% | 51.73% |
| 23.91 | 77.63% | 51.13% |
| 26.09 | 75.18% | 46.97% |
| 30.44 | 74.16% | 45.30% |
| 32.61 | 72.72% | 42.99% |
| 34.78 | 69.65% | 38.36% |
| 36.96 | 69.20% | 37.70% |
| 39.13 | 67.33% | 35.07% |
| 41.31 | 67.10% | 34.74% |
| 43.48 | 64.43% | 31.20% |
| 45.66 | 63.41% | 29.91% |
| 47.83 | 60.04% | 25.88% |
| 50.00 | 58.82% | 24.51% |
| 52.18 | 57.53% | 23.12% |
| 54.35 | 45.52% | 12.43% |
Formula feeding
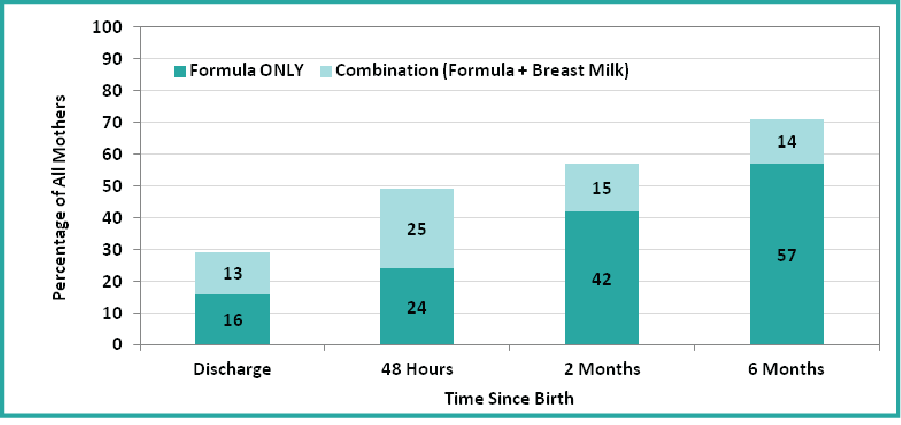
At discharge from hospital, just over one-quarter (29%) of all mothers were feeding their infants formula (i.e., breast milk substitute), either alone or in combination with breast milk. This percentage increased dramatically to nearly half (49%) at 48 hours after discharge and gradually increased over the subsequent six months. See Figure 4 below.
Figure 4. Formula Feeding Method at Discharge, 48 Hours, 2 Months, and 6 Months
Data Table for Figure 4. Formula Feeding Method at Discharge, 48 Hours, 2 Months, and 6 Months
| Feeding Method | Discharge | 48 Hours | 2 Months | 6 Months |
|---|---|---|---|---|
| Formula Only | 16% | 24% | 42% | 57% |
| Combination (Formula + Breast Milk) | 13% | 25% | 15% | 14% |
Introduction of other foods
Mothers who participated in the study were asked questions about feeding other foods to their babies. Most of these mothers (72%) had fed solid foods to their infants before the recommended age of six months. Nearly all mothers (98%) had introduced solids to their infants by six months of age. Ninety-nine per cent of all mothers introduced infant cereal as their infant’s first solid food.
Only 2% of mothers reported introducing cow’s milk to their infant before 12 months. Other foods introduced to infants included grain products, meat and fish products, meat alternatives, fruit, vegetables and dairy products.
Nearly all mothers (99%) reported that their infants were at times feeding themselves, and many (88%) allowed their infant to decide for him or herself when to stop eating. The majority (89%) of mothers fed their infant as part of family meal time, and 94% were feeding their infant iron-rich foods at most meal times.
Conclusion
These findings will support SDHU program teams as they work with our communities to improve infant nutrition and support the best possible start in life.
For more information, contact us at 705.522.9200 or toll free at 1.866.522.9200.
This item was last modified on April 8, 2016