Mental Health, Substance Use & Injury Prevention Survey Results
PDF version (PDF, 645 KB)
Public Health Sudbury & Districts conducted an online bilingual community survey to understand how COVID-19 is affecting and impacting mental health, substance use and injury prevention. The survey was open and advertised on social media over 11 days from July 2 to July 13, 2020. The results will be used to inform public health planning and service coordination.
Sample
- 564 surveys were completed
- 84% reported residency in Greater Sudbury*
- 16% reported residency in the districts**
- 7% completed the online survey in French
- 83% of the sample identified as female
- 70% of respondents were between the ages of 25 and 54
- 34% responded that they have children living in their household between the ages of 4 and 15
- 68% reported being employed at the time of the survey
- 12% reported living alone
- 5% identified as a member of the 2SLGBTQ+ community
- 6% reported living in poverty and/or experiencing food insecurity
- 18% reported having a chronic (long-term) illness (e.g. asthma, diabetes, cancer, arthritis)
- 3% reported living with a physical, developmental or sensory disability
- 26% reported living with a mental health disorder (e.g. anxiety, depression)
* Greater Sudbury includes Capreol, Coniston, Falconbridge, Garson, Skead, Wahnapitae, Walden, Lively, Azilda, Chelmsford, Valley East, Onaping Falls and Copper Cliff
**The districts include the Espanola area, Chapleau area, Sudbury East area and Manitoulin Island
Overall mental health
Key Finding:
- 71% of respondents reported their mental health as excellent, very good or good
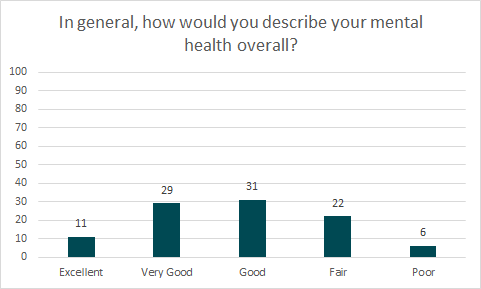
| Overall Mental Health | % |
| Excellent | 11 |
| Very Good | 29 |
| Good | 31 |
| Fair | 22 |
| Poor | 6 |
COVID-19 impact on mental health
Key Findings:
- 56% of respondents reported their mental health as ‘somewhat worse’ or ‘much worse’ because of the pandemic.
- 37% of the sample reported their mental health as ‘much better’ or ‘somewhat better’ because of the pandemic.
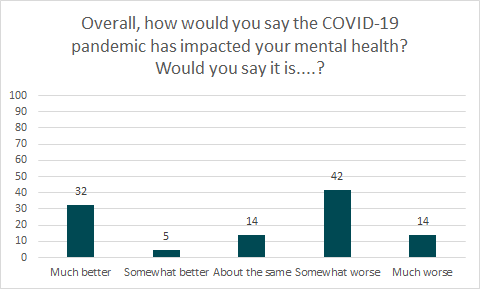
| COVID-19 Impact on Mental Health | % |
| Much better | 32 |
| Somewhat better | 5 |
| About the same | 14 |
| Somewhat worse | 42 |
| Much worse | 14 |
COVID-19 impact on mental health by age
Key Findings:
- No respondents aged 16-24 identified their mental health as better because of the pandemic.
- 70% of respondents aged 16-39 reported their mental health as worse because of the pandemic.
- 50% of respondents aged 55-64 and 60% aged 65+ reported their mental health was not impacted by the pandemic.
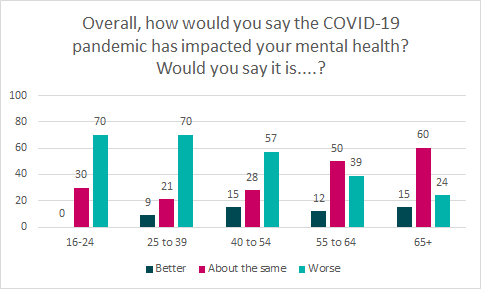
| Age group | COVID-19 impact on mental health | % |
| 16-24 years | Better | 0 |
| About the same | 30 |
| Worse | 70 |
| 25 to 39 | Better | 9 |
| About the same | 21 |
| Worse | 70 |
| 40 to 54 | Better | 15 |
| About the same | 28 |
| Worse | 57 |
| 55 to 64 | Better | 12 |
| About the same | 50 |
| Worse | 39 |
| 65+ | Better | 15 |
| About the same | 60 |
| Worse | 24 |
Factors with a major impact on mental health during the COVID-19 pandemic
Key Findings:
- The top three factors identified as having a major impact on mental health during the pandemic included the possibility of a family member catching COVID-19 (42%), social isolation (37%) and daily news about COVID-19 (26%).
- The factor having the least major impact on mental health during the pandemic was communication with family and/or friends outside of the household (9%).
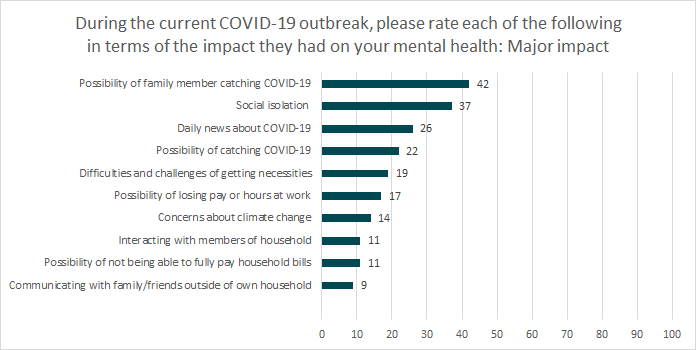
| Factors with a major impact on mental health during the pandemic | % |
| Possibility of family member catching COVID-19 | 42 |
| Social isolation | 37 |
| Daily news about COVID-19 | 26 |
| Possibility of catching COVID-19 | 22 |
| Difficulties and challenges of getting necessities | 19 |
| Possibility of losing pay or hours at work | 17 |
| Concerns about climate change | 14 |
| Possibility of not being able to fully pay household bills | 11 |
| Interacting with members of household | 11 |
| Communicating with family/friends outside of own household | 9 |
Access to mental health supports
Key Findings:
- Prior to the COVID-19 pandemic, 83% of respondents knew where to find information for mental health challenges and 83% reported having access to resources for support with mental health challenges.
- During the COVID-19 pandemic, 78% of respondents knew where to find information for mental health challenges and 70% reported having access to resources for support with mental health challenges.
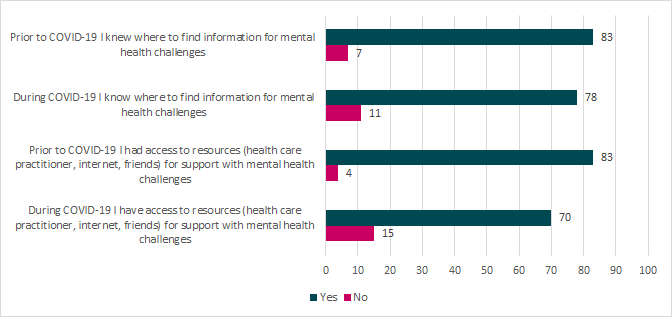
| Access to mental health supports | % Yes | % No |
| Prior to COVID-19 I knew where to find information for mental health challenges | 83 | 7 |
| During COVID-19 I know where to find information for mental health challenges | 78 | 11 |
| Prior to COVID-19 I had access to resources (health care practitioner, internet, friends) for support with mental health challenges | 83 | 4 |
| During COVID-19 I have access to resources (health care practitioner, internet, friends) for support with mental health challenges | 70 | 15 |
Types of resources accessed to support or improve mental health
Key Findings:
- The primary type of resource accessed by respondents to support or improve mental health was support from friends and/or family (51%), followed by online resources or information from a website (24%).
- The least reported types of resources accessed by respondents to support or improve mental health included calling or texting a helpline (3%) and hospital care (2%).
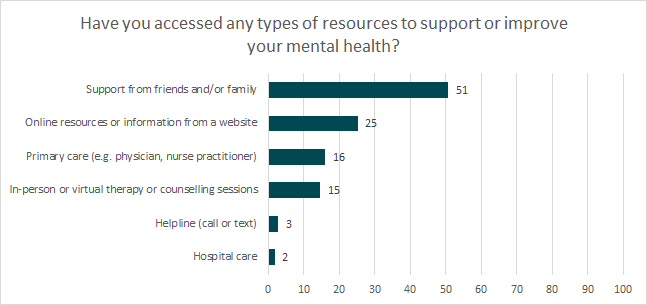
| Resources accessed to support or improve mental health | % |
| Support from friends and/or family | 51 |
| Online resources or information from a website | 25 |
| Primary care (e.g. physician, nurse practitioner) | 16 |
| In-person or virtual therapy or counselling sessions | 15 |
| Helpline (call or text) | 3 |
| Hospital care | 2 |
Challenges, difficulties or concerns accessing resources or supports
Key Finding:
- 18% of respondents reported they had challenges, difficulties or concerns with accessing resources or supports.
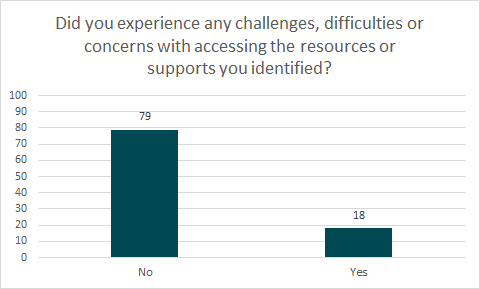
| Challenges, difficulties, concerns with accessing resources or supports | % |
| No | 79 |
| Yes | 18 |
Changes experienced since the start of the COVID-19 pandemic
Key Findings:
- 64% of respondents reported increased amounts of daily recreational screen time and/or online gaming and 64% also reported increased feelings of loneliness or isolation since the start of the pandemic.
- 34% of respondents reported increased physical activity and 32% also reported increased participation in hobbies and activities since the start of the pandemic.
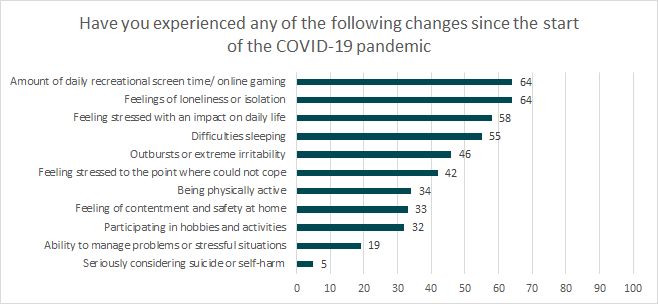
| Changes since the start of the COVID-19 pandemic: More often | % |
| Feelings of loneliness or isolation | 64 |
| Amount of daily recreational screen time/ online gaming | 64 |
| Feeling stressed with an impact on daily life | 58 |
| Difficulties sleeping | 55 |
| Outbursts or extreme irritability | 46 |
| Feeling stressed to the point where could not cope | 42 |
| Being physically active | 34 |
| Feeling of contentment and safety at home | 33 |
| Participating in hobbies and activities | 32 |
| Ability to manage problems or stressful situations | 19 |
| Seriously considering suicide or self-harm | 5 |
Substance use and addictions since the COVID-19 pandemic
Alcohol
Key Findings:
- 27% of respondents identified that their alcohol consumption increased since the pandemic; conversely, 6% identified that their alcohol consumption decreased since the pandemic.
- The primary reasons for increased alcohol consumption since the pandemic were reported by participants to include stress (57%), lack of regular schedule (50%) and boredom (48%).
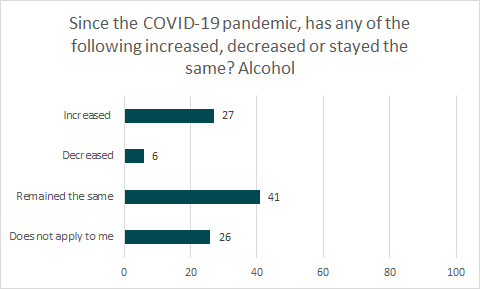
| Alcohol consumption since the pandemic | % |
| Increased | 27 |
| Decreased | 6 |
| Remained the same | 41 |
| Does not apply to me | 26 |
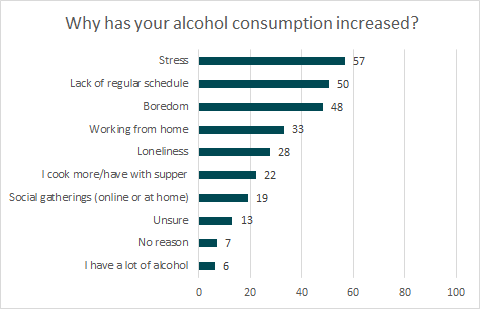
| Reasons for increased alcohol consumption | % |
| Stress | 57 |
| Lack of regular schedule | 50 |
| Boredom | 48 |
| Working from home | 33 |
| Loneliness | 28 |
| I cook more/have with supper | 22 |
| Social gatherings (online or at home) | 19 |
| Unsure | 13 |
| No reason | 7 |
| I have a lot of alcohol | 6 |
Nicotine
Key Findings:
- 7% of respondents identified that their nicotine consumption increased since the pandemic; conversely, 1% identified that their nicotine consumption decreased since the pandemic.
- The primary reasons for increased nicotine consumption since the pandemic are the same as those reported for increased alcohol consumption: stress (83%), boredom (60%) and lack of regular schedule (46%).
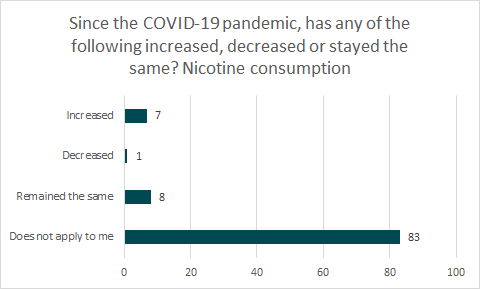
| Nicotine consumption since the pandemic | % |
| Increased | 7 |
| Decreased | 1 |
| Remained the same | 8 |
| Does not apply to me | 83 |
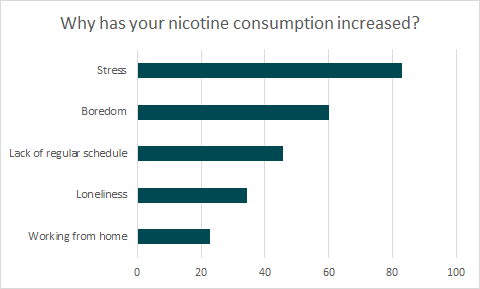
| Reasons for increased nicotine consumption | % |
| Stress | 83 |
| Boredom | 60 |
| Lack of regular schedule | 46 |
| Loneliness | 34 |
| Working from home | 23 |
Cannabis
Key Findings:
- 10% of respondents identified that their cannabis consumption increased since the pandemic; conversely, 1% identified that their cannabis consumption decreased since the pandemic.
- The primary reason for increased cannabis consumption since the pandemic was pain relief (69%), followed by the same as those reported for increased alcohol and nicotine consumption: boredom (63%), stress (60%) and lack of regular schedule (50%).
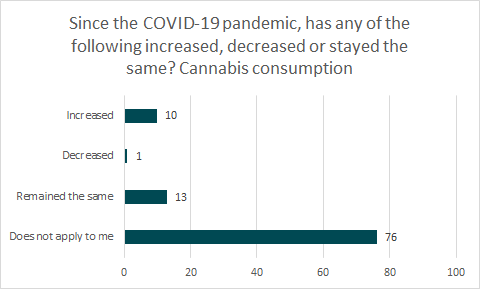
| Cannabis consumption since the pandemic | % |
| Increased | 10 |
| Decreased | 1 |
| Remained the same | 13 |
| Does not apply to me | 76 |
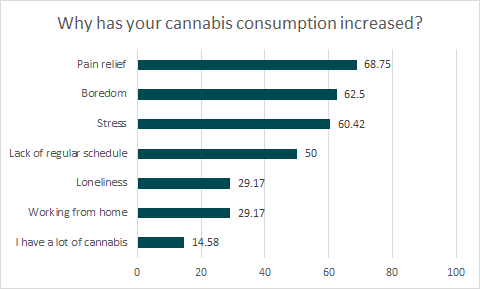
| Reasons for increased cannabis consumption | % |
| Pain relief | 69 |
| Boredom | 63 |
| Stress | 60 |
| Lack of regular schedule | 50 |
| Working from home | 29 |
| Loneliness | 29 |
| I have a lot of cannabis | 15 |
Gambling
Key Findings:
- 3% of respondents identified that their gambling increased since the pandemic; conversely, 1% identified that their gambling decreased since the pandemic.
- The two primary reasons for increased gambling since the pandemic was having a lot of time (58%) and boredom (58%).
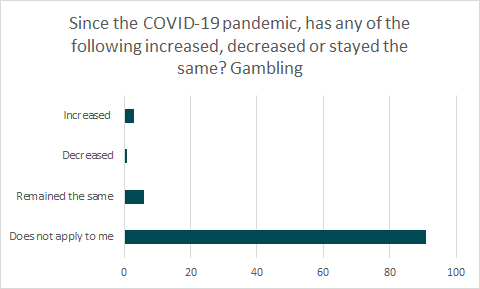
| Gambling since the pandemic | % |
| Increased | 3 |
| Decreased | 1 |
| Remained the same | 6 |
| Does not apply to me | 91 |
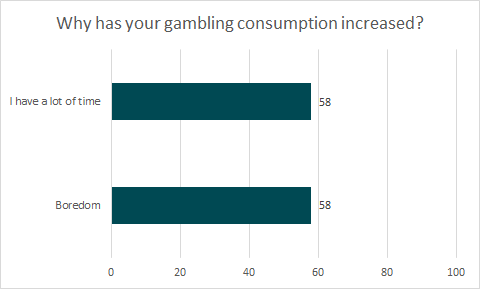
| Reasons for increased gambling | % |
| I have a lot of time | 58 |
| Boredom | 58 |
Mental health support from employers during the COVID-19 pandemic
Key Findings:
- 73% of respondents identified that their employer keeps them informed about new and upcoming changes as much as possible.
- 68% of the sample reported that their employer is considerate and supportive of their mental health and associated mental health needs since the start of the pandemic.
- 24% of respondents disagreed that their employer kept them informed about new and upcoming changes as much as possible.
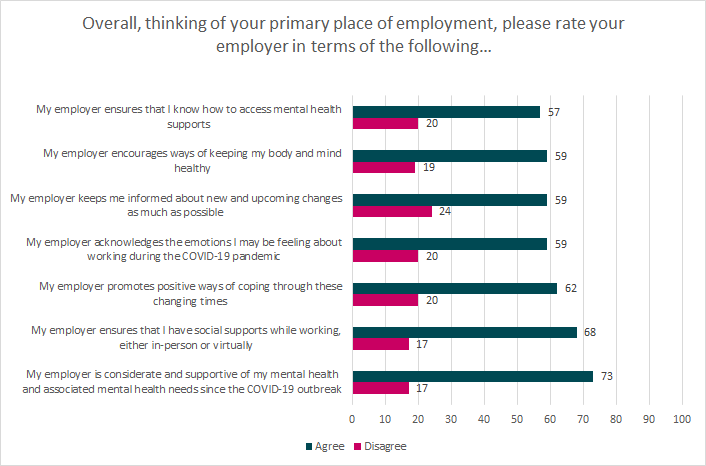
| Mental health support from employers during the pandemic | Agree | Disagree |
| My employer ensures that I know how to access mental health supports | 57 | 20 |
| My employer encourages ways of keeping my body and mind healthy | 59 | 19 |
| My employer keeps me informed about new and upcoming changes as much as possible | 59 | 24 |
| My employer acknowledges the emotions I may be feeling about working during the COVID-19 pandemic | 59 | 20 |
| My employer promotes positive ways of coping through these changing times | 62 | 20 |
| My employer ensures that I have social supports while working, either in-person or virtually | 68 | 17 |
| My employer is considerate and supportive of my mental health and associated mental health needs since the COVID-19 outbreak | 73 | 17 |
Impact of the COVID-19 pandemic on children
Key Findings:
- 89% of respondents reported that social isolation was impacting their child(ren)’s mental health, with 52% reporting it as having a ‘major impact’.
- The second highest concern reported by respondents as having a ‘major impact’ on child mental health was communication with family and/or friends outside of the household (22%).
- Concerns about climate change was reported as having the least impact (30%) on child mental health during the pandemic.
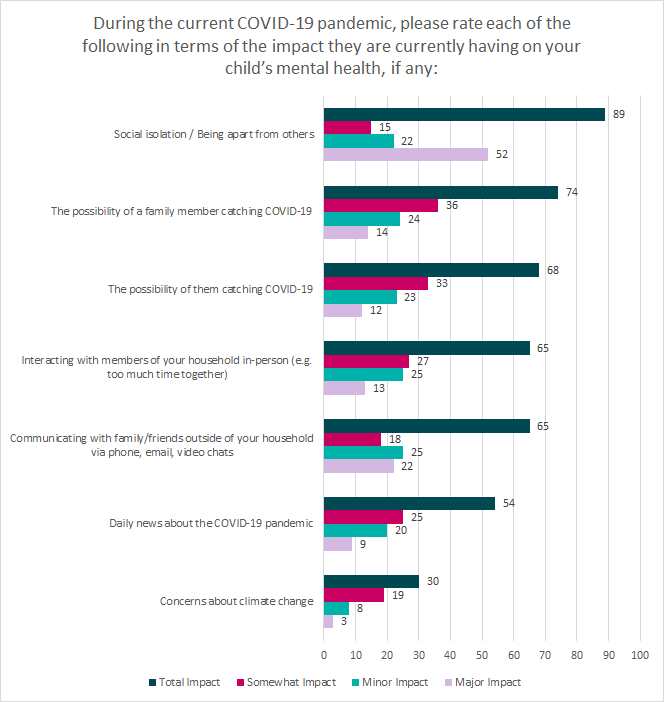
| Factors impacting child mental health | Major Impact | Minor Impact | Somewhat Impact | Total Impact |
| Social isolation / Being apart from others | 52 | 22 | 15 | 89 |
| The possibility of a family member catching COVID-19 | 14 | 24 | 36 | 74 |
| The possibility of them catching COVID-19 | 12 | 23 | 33 | 68 |
| Communicating with family/friends outside of your household via phone, email, video chats | 22 | 25 | 18 | 65 |
| Interacting with members of your household in-person (e.g. too much time together) | 13 | 25 | 27 | 65 |
| Daily news about the COVID-19 pandemic | 9 | 20 | 25 | 54 |
| Concerns about climate change | 3 | 8 | 19 | 30 |
Access to child mental health supports
Key Findings:
- Prior to the pandemic, 80% of respondents knew where to find information and 76% had access to resources to support their child(ren)’s mental health challenges.
- During the pandemic, 72% of respondents knew where to find information and 64% had access to resources to support their child(ren)’s mental health challenges.
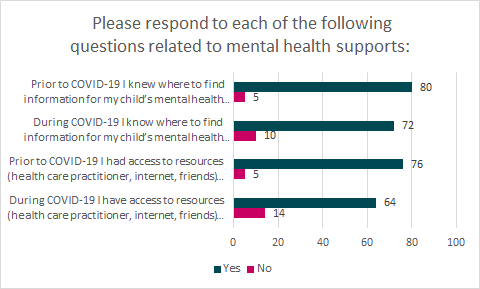
| Access to child mental health supports | Yes | No |
| Prior to COVID-19 I knew where to find information for my child’s mental health challenges | 80 | 5 |
| During COVID-19 I know where to find information for my child’s mental health challenges | 72 | 10 |
| Prior to COVID-19 I had access to resources (health care practitioner, internet, friends) for support with my child’s mental health challenges | 76 | 5 |
| During COVID-19 I have access to resources (health care practitioner, internet, friends) for support with my child’s mental health challenges | 64 | 14 |
Resources accessed to support or improve concerns or behaviours of children
Key Findings:
- The most reported support accessed by respondents to support or improve their child(ren)’s concerns or behaviours was support from friends and/or family (46%).
- The least reported supports accessed by respondents to support or improve their child(ren)’s concerns or behaviours were helplines (3%).
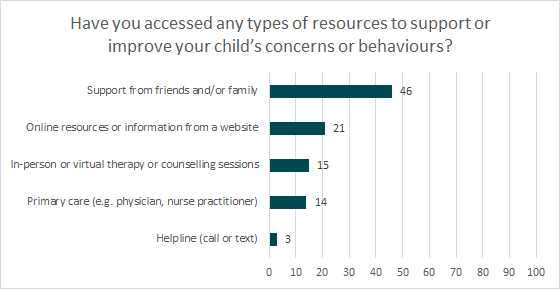
| Resources accessed to support or improve concerns or behaviours | % |
| Support from friends and/or family | 46 |
| Online resources or information from a website | 21 |
| In-person or virtual therapy or counselling sessions | 15 |
| Primary care (e.g. physician, nurse practitioner) | 14 |
| Helpline (call or text) | 3 |
Changes in child behaviour since the start of the COVID-19 pandemic
Key Findings:
- 88% of respondents reported their child(ren) increased recreational daily screen time and/or online gaming and 75% had increased feelings of loneliness or isolation since the start of the pandemic.
- 36% of children were reported to have increased their physical activity and 28% were reported to have increased their participation in hobbies and activities since the start of the pandemic.
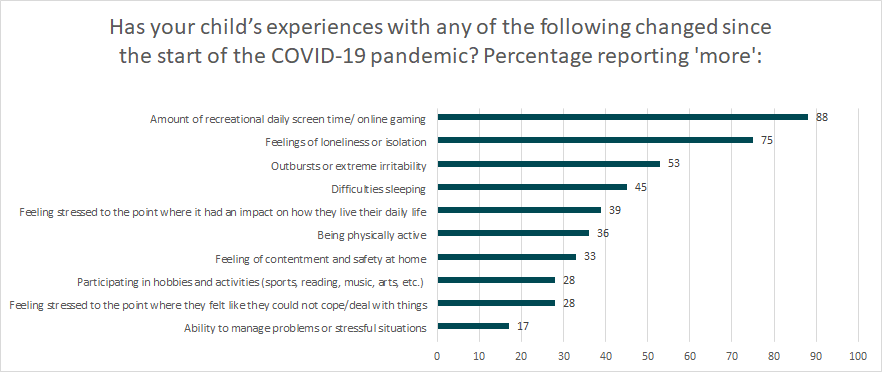
| Changes in child behaviour since the start of the pandemic | % More |
| Amount of recreational daily screen time/ online gaming | 88 |
| Feelings of loneliness or isolation | 75 |
| Outbursts or extreme irritability | 53 |
| Difficulties sleeping | 45 |
| Feeling stressed to the point where it had an impact on how they live their daily life | 39 |
| Being physically active | 36 |
| Feeling of contentment and safety at home | 33 |
| Feeling stressed to the point where they felt like they could not cope/deal with things | 28 |
| Participating in hobbies and activities (sports, reading, music, arts, etc.) | 28 |
| Ability to manage problems or stressful situations | 17 |
This item was last modified on December 3, 2020