Opportunity for All: The Path to Health Equity (report)
Opportunity for All describes the link between health and social and economic environments in the City of Greater Sudbury. Building on a growing evidence base about the relationship between health and socio-economic factors, this report presents an analysis of 15 health indicators by area deprivation in the City of Greater Sudbury and finds that health inequities exist. Opportunity for All assesses the impact of these inequities in the City of Greater Sudbury and highlights some key considerations for the City’s path to health equity.
Opportunity for All includes definitions and concepts of health equity and deprivation that have been explored in the academic literature, the methodological approach and an analysis of the results. The report ends with discussion and conclusions. Detailed explanation of the methodology is provided in appendices.
Fifteen health indicators demonstrated a significant relationship with area level deprivation in the City of Greater Sudbury. People in the most deprived areas have the worst health. People in the least deprived areas have the best health. Some of the most dramatic differences include:
- The infant mortality rate in Greater Sudbury’s most deprived areas was 139% (or 2.4 times) higher than that for infants in the City’s least deprived areas.
- The annual rate of emergency department visits for mental health episodes in Greater Sudbury’s most deprived areas was 341% (or 4.4 times) higher than that for residents in the least deprived areas.
- The prevalence rate of obesity in residents of the City of Greater Sudbury’s most deprived areas was 102% (or 2 times) higher than that for residents of the City’s least deprived areas.
The report reveals implications for untapped health potential in Greater Sudbury. Using this report’s analytical approach, if everyone in the City of Greater Sudbury experienced the same opportunities for health as those in the least deprived areas, each year there would be:
- 14,077 fewer emergency department visits for all causes in the City
- 1,783 fewer hospitalizations for all causes in the City
- 9,706 more people in the City who rate their health as excellent or very good
- 1 less infant death
There is still much work to be done to understand the path to health equity and reduce the health disparities described for Greater Sudbury. Opportunity for All provides local data to help inform the necessary community dialogue to do this work. Greater Sudbury has many assets and a long history of mobilizing its strengths to recognize and respond to inequities such as those revealed here. With informed, creative and concerted action to improve health equity, no one in our community needs to be at risk of poor health solely due to the social and economic environments in which they live. The health inequities described in this report are not inevitable—together, we can build a community in which there is opportunity for all.
aThe rate of emergency department visits for mental health episodes and prevalence rate of obesity in the City of Greater Sudbury are age standardized.
- Introduction
- Methodological overview
Health outcomes
Social and economic environments
Data format
Consultation - Results
Community socio-economic profile
Health inequities in the City of Greater Sudbury
General health
Maternal and child health
Chronic disease and injuries
Health service utilization
Mental health - Discussion
Overall results
Interpreting the results
Limitations - Conclusions
- Endnotes
- References
- Appendix A
Health outcomes and risk factors examined by deprivation level - Appendix B
Data sources
Overview - Appendix C
Socio-economic status of neighbourhoods — the deprivation index - Appendix D
Calculation of rates, confidence intervals and statistical significance
Calculation of rates
Incidence rates
Prevalence rates
Age standardization of rates
Rates and measures related to infant health
Calculation of “health potential”
Calculation of confidence intervals and statistical significance - Appendix E
Limitations
Limitations of deprivation indices
Heterogeneity within City of Greater Sudbury dissemination areas
Missing deprivation data
Data source-specific limitations
Sample size
Variability in estimated rates - Appendix F
Consultation participants
Opportunities for Wellbeing consultation event – December 5, 2012
Participating agencies and organizations
Introduction
Health is influenced by a broad range of factors — genetics, individual lifestyles and behaviours and the physical, social and economic environments in which we live. These factors contribute to health experienced by individuals and to the overall level of health in the community.
Factors beyond an individual’s biology and behaviours — those that form the conditions in which people are born, grow up, live, and work — are known as the social determinants of health.1 Any differences or variations in health status between groups are known as health inequalities. When health inequalities have the potential to be changed or decreased by social action, they are labelled as health inequities.2
“Three distinguishing features, when combined, turn mere variations or differences in health into a social inequity in health. They are systematic, socially produced (and therefore modifiable) and unfair.”3
Inequities in health outcomes and their social determinants have been identified in research and population health assessments across Canada and around the world. In 2008, the World Health Organization Commission on Social Determinants of Health released a seminal report on the evidence of what can be done to improve health equity within and between countries.4 In 2009, the Canadian Senate Subcommittee on Population Health documented the national impact of the social determinants of health and the role of all levels of government in responding to them.5
Across Canada, local public health agencies such as in Toronto, Saskatoon, Winnipeg and the Region of Peel, have assessed and reported on health inequities in their areas.6 In her report, Health, Not Health Care – Changing the Conversation (2011), Ontario’s Chief Medical Officer of Health, Dr. Arlene King, drew attention to the social and economic conditions that impact health. All sectors were called upon to focus on efforts that promote health and prevent disease, improving health outcomes and reducing health inequities.7
As national and international recognition of the social determinants of health and health inequities has grown, the Sudbury & District Health Unit has refined its approaches, structures and processes to have a positive influence on the determinants of health in its communities. Given the importance of the social determinants of health and health inequities to the well-being of all citizens living in its service area, the Health Unit is committed to achieving its Health Equity Vision — 2020.
Health Equity Vision—2020
The Sudbury & District Health Unit will work to improve the overall health and health equity of area citizens so that:
- systemic and avoidable health disparities are steadily reduced and the gap in health between the best and worst off is narrowed
- all citizens have equal opportunities for good health and well-being
- all citizens have equitable access to a full range of high-quality public health programs and services
Aligned with this health equity vision, its mandate to promote and protect health and the essential public health functions of population health assessment and surveillance, the Sudbury & District Health Unit is committed to understanding the local link between health outcomes and the social and economic environments in Greater Sudbury. Opportunity for All explores and analyzes this relationship, with the aim of informing future public health and partner action to reduce health inequities in the City of Greater Sudbury.
This report is organized into four sections:
- Methodological overview
- Results
- Discussion
- Conclusions
Methodological overview
Health outcomes
Forty-two health indicators were studied for their relationship to social and economic environments. They were selected as measures of health outcomes for the City of Greater Sudbury because they have been examined in similar analyses (for example, by the Canadian Institute for Health Information, Institut national de santé publique du Québec, or other local health agencies). Another factor in indicator selection was their availability for analysis by Dissemination Area.
The data sources included the Canadian Community Health Survey, the Canadian Census and IntelliHEALTH ONTARIO. Data sources are described further in Appendix B. Many of the health outcomes considered in this report are rare. In such cases, there might be insufficient data to detect statistically significant differences between groups at the local level, even if they exist. Multiple years of data were combined in this report in an effort to overcome this limitation. Further technological detail about the methodology is provided in Appendices A-D.
Social and economic environments
The Deprivation Index was used in this report as the measure of local social and economic environments. Rates of health outcomes or health risk factors were measured among residents of geographic areas that are grouped by levels of the Deprivation Index. The Deprivation Index is a composite measure of neighbourhood-level socio-economic status developed by the Institut national de santé publique du Québec (INSPQ).8 The Index contains a material and social component; each component is derived from three variables in the 2006 Canadian Census. A more detailed explanation of the Deprivation Index is found in Appendix C.
Geographic areas were assigned a material deprivation score using a principal components analysis (PCA) based on:
- the percentage of residents without a high school diploma
- the percentage of residents who are employed
- the average (mean) income (in 2005) of residents
Similarly, the areas were assigned a social deprivation score using PCA based on:
- the percentage of families that are single-parent families
- the percentage of residents who are living alone
- the percentage of residents who are separated, divorced or widowed
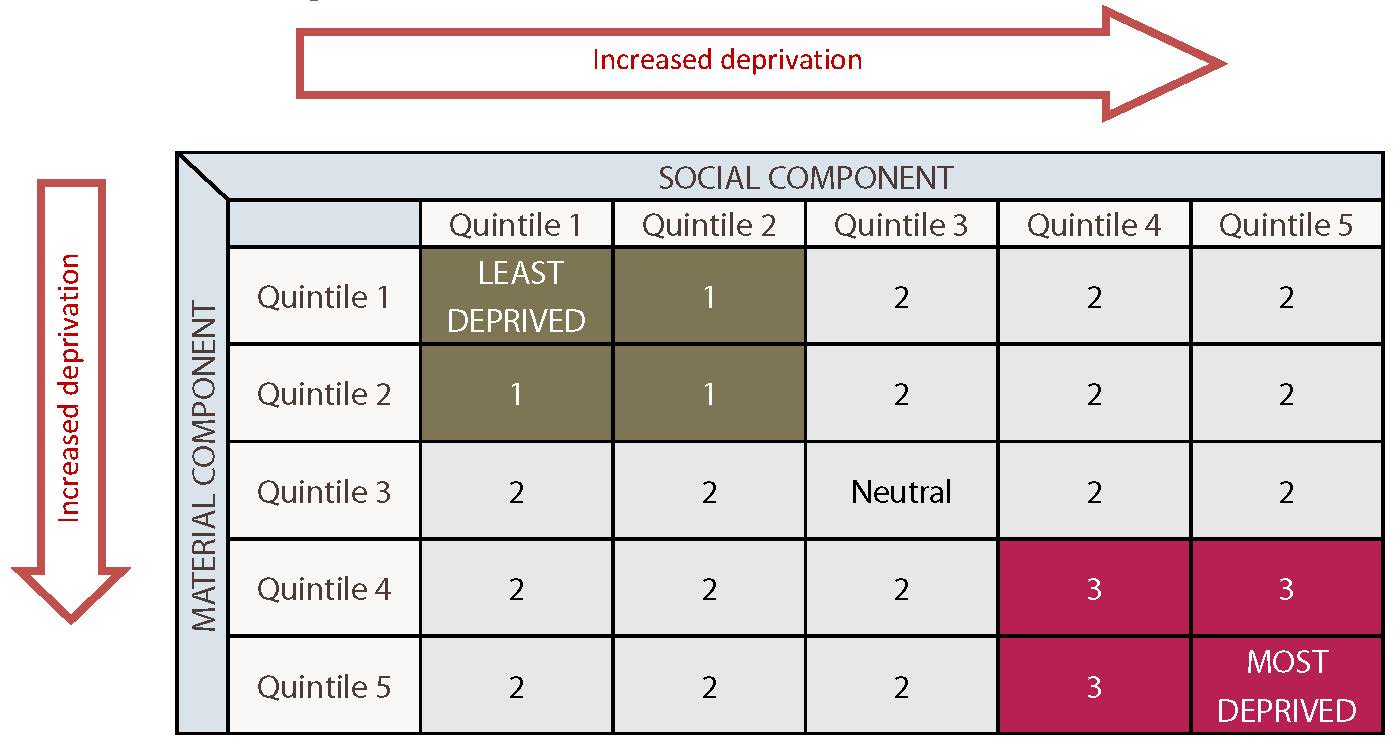
Defined geographic areas (Census Dissemination Areas [DAs]) were categorized based on the measures of material and social well-being. Geographic areas with high scores on both measures (least deprived areas) were grouped together, as were areas with low scores for both measures (most deprived areas). The remaining locations were grouped together as neutral areas, as illustrated in Figure 1. The 42 health indicators were then studied in relation to the deprivation categories to identify any differences between the least and most deprived groups.
Figure 1. Combining Material and Social Components into a Three-Category Deprivation Index
Data format
The report presents the findings of the analysis in a common format. Each indicator of health is introduced with a brief description of its importance to health and relationship to the social determinants of health as revealed in academic literature. The indicator and its calculation are explained. The analysis includes the following components:
- a graphical display of the indicator in the three deprivation groups (most, neutral and least deprived)
- the absolute result (the value of the indicator for each of the three deprivation groups)
- the relative results between the most and least deprived areas (a comparison of the differences between the groups)
- a measure of “health opportunity”: a quantitative estimate of the potential for increased health if all City of Greater Sudbury residents experienced the same conditions as those in the least deprived areas of the City
Consultation
To prepare this report, the Health Unit consulted with representatives from many sectors, including education, health care, social services and policing, to gain perspectives on what contributes to health in the City of Greater Sudbury.
In December 2012, a preliminary compilation of this report’s findings were shared at a community event hosted by the Sudbury & District Health Unit in partnership with the Greater Sudbury Police Service, the Social Planning Council of Sudbury and the City of Greater Sudbury. Participants were asked questions about the meaning of the results, what could be contributing to the health outcomes and which strengths in the City of Greater Sudbury could be protective of health. In addition, complementary community information, including analyses of local Early Development Instrument data and crime patterns, was shared by partner agencies to help broaden the understanding of what influences well-being in our area.
A list of participants of the December 2012 consultation is found in Appendix F.
Results
Community socio-economic profile
An initial analysis was conducted to compare the socio-economic profile of the least deprived areas of Greater Sudbury with the most deprived areas. The analysis assisted in assessing the appropriateness of the INSPQ Deprivation Index tool for the Greater Sudbury context.
Analyses of Statistics Canada 2006 Census data revealed that compared to the least deprived areas, the City’s most deprived areas have a:
- 726% higher proportion of residents who are living in povertyb
- 336% higher proportion of residents who are living alone
- 249% higher proportion of lone-parent families
- 86% higher proportion of residents without a high school certificate
- 26% lower proportion of residents who are employed
Compared to the least deprived areas, the City’s most deprived areas include:
- more residents who identify as Indigenous individuals (230% more)
- more residents who immigrated to Canada within the last five years (100% more)
- more residents who identify as francophone (40% more)
- more residents who are aged 65 and over (37% more)
- more female residents (5% more)
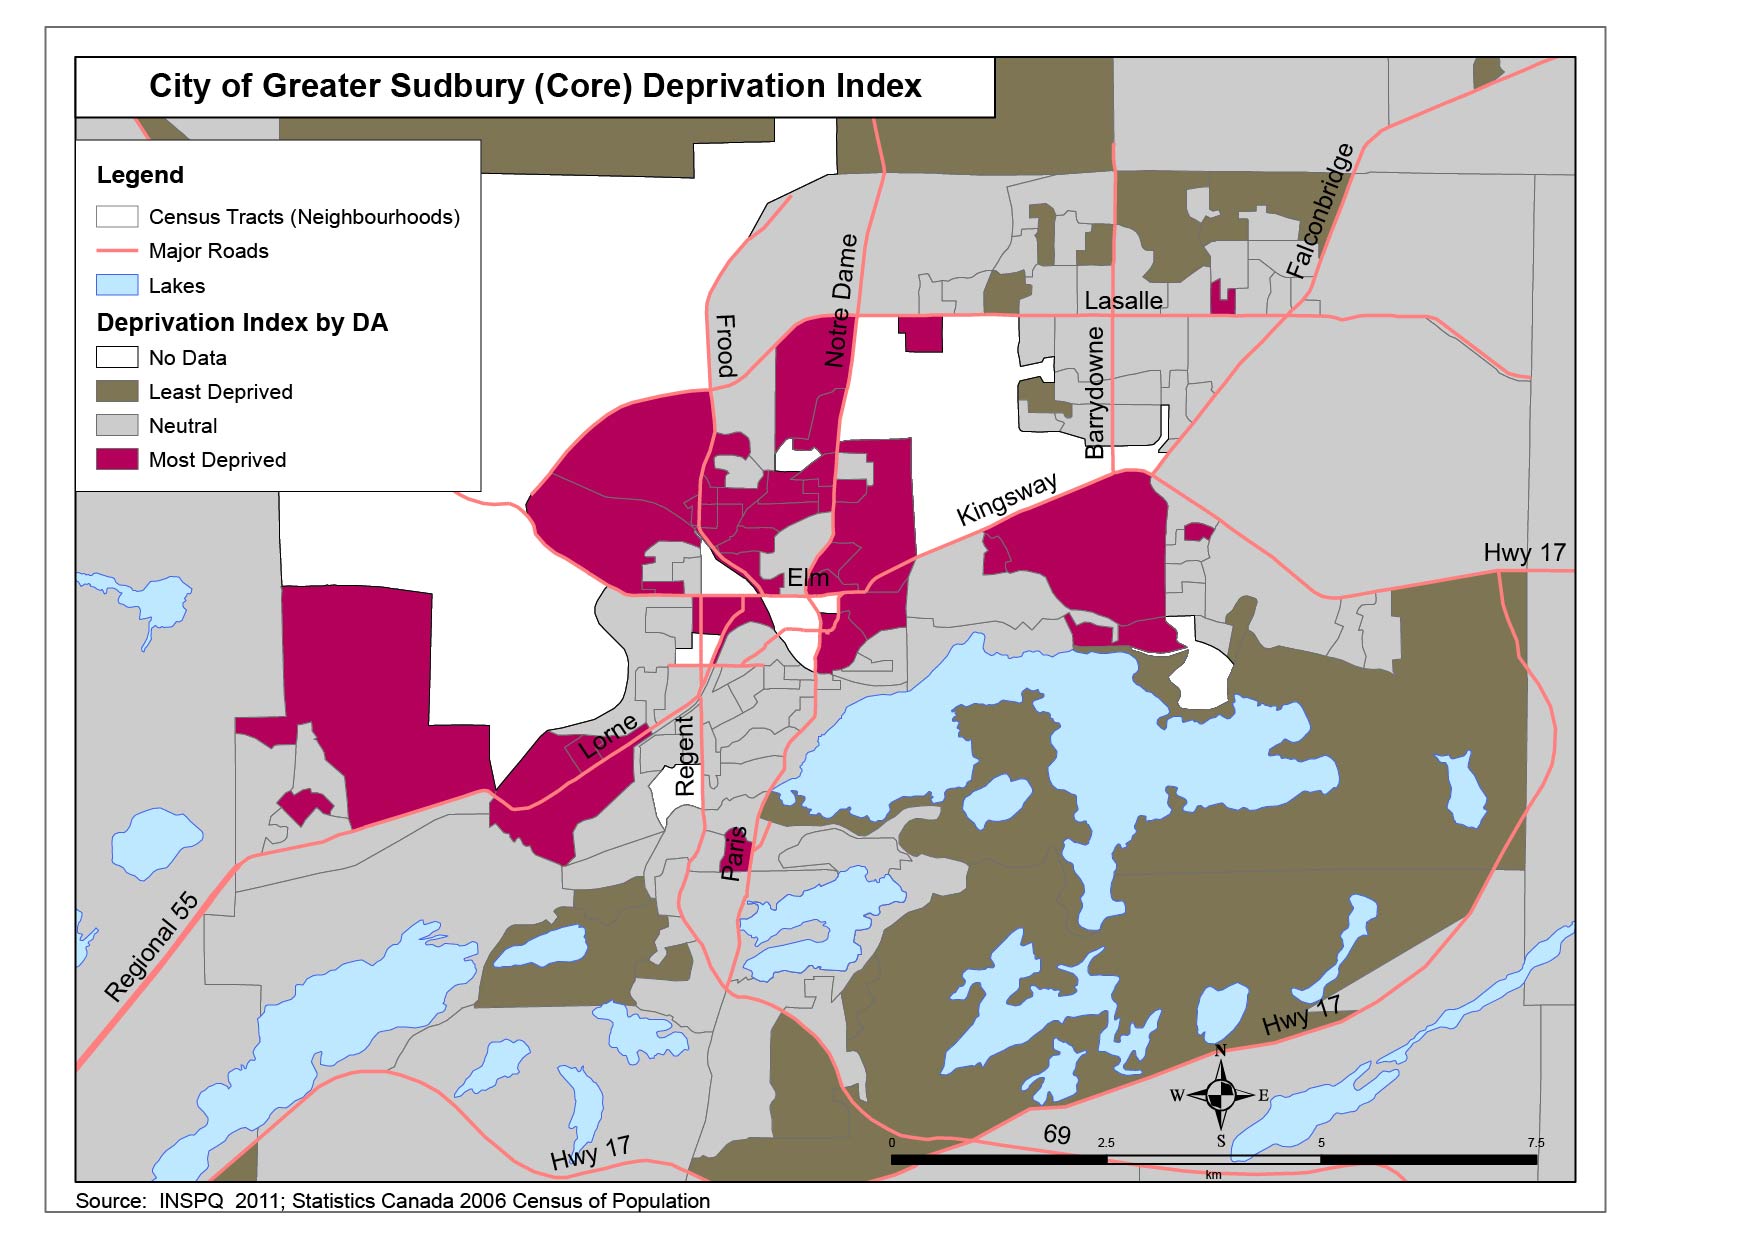
The following maps, Figures 2 and 3, represent the geographic areas (groups of DAs) of least, neutral and most deprivation within the City of Greater Sudbury. The DA boundaries have been suppressed for privacy reasons. Some census tract boundaries and community boundaries are included for geographic context. The purpose of the maps is to explore general geographic patterns and not to identify specific parts of the City as least or most deprived.
bAs measured by the low income cut-off.
Figure 2. City of Greater Sudbury Map Illustrating Levels of Deprivation as per the INSPQ Deprivation Index
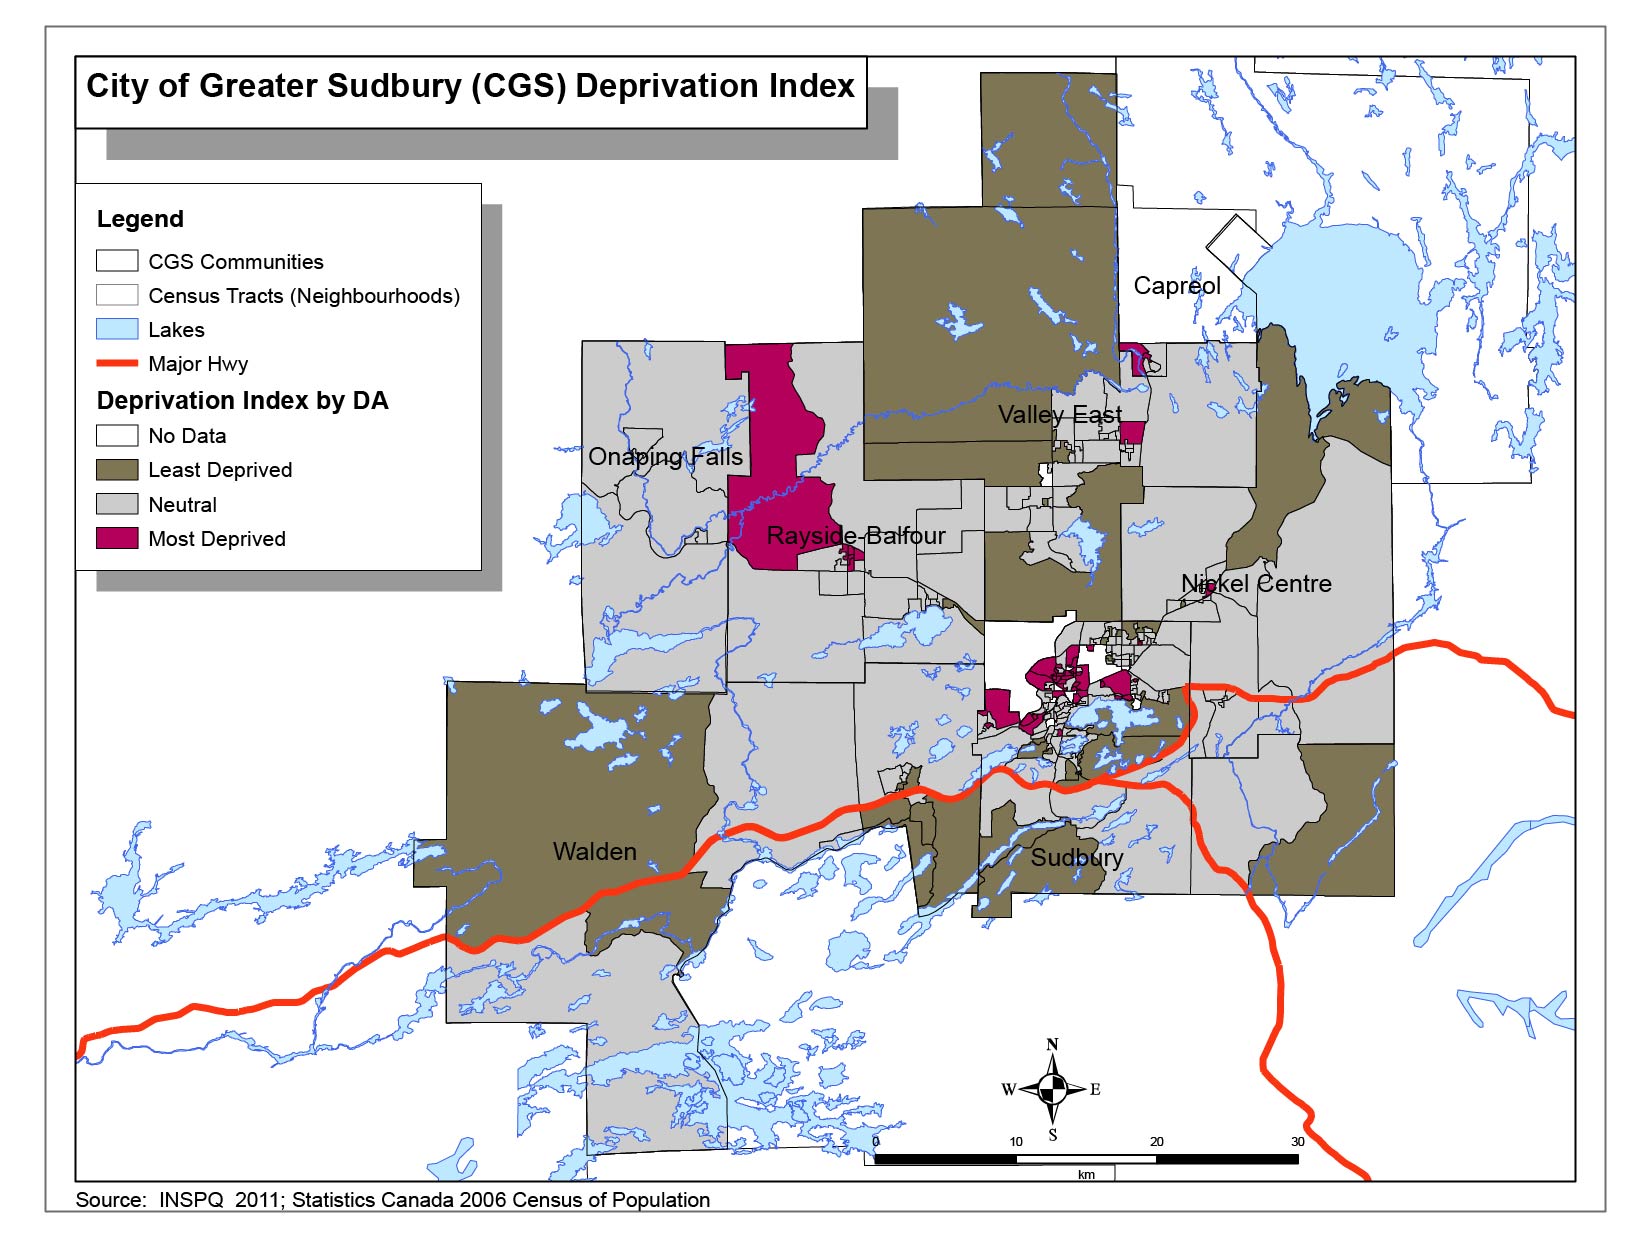
Figure 3. City of Greater Sudbury—Downtown Core Map Illustrating Levels of Deprivation as per the INSPQ Deprivation Index
These summary results support the use of the INSPQ’s Deprivation Index as a simplified tool to characterize and group Dissemination Areas. Although the Index is built on only six census variables, it is able to capture other factors commonly known to affect chances for health and well-being. Thus, the Index represents more than the sum of its parts.
Health inequities in the City of Greater Sudbury
Of the 42 health indicators examined, 15 demonstrated a significant relationship with area level deprivation in the City of Greater Sudbury. Of these, 14 showed a gradient in health outcomes related to deprivation. One indicator did not demonstrate a gradient but did exhibit a significant difference in rates between most and least deprived areas.
Table 1 summarizes the variables that displayed a statistically significant relationship with area level deprivation.c
Table 1. Health Indicators in Most Deprived Areas Where Differences Are Statistically Significant
| HEALTH INDICATORS | LEVEL IN MOST DEPRIVED AREAS RELATIVE TO LEAST DEPRIVED AREAS |
|---|---|
| 1. Self-rated health (excellent /very good) | 20% lower or 0.2 times lower |
| 2. Premature mortality (dying before age 75) | 86% higher or 1.9 times higher |
| 3. Infant mortality | 139% higher or 2.4 times higher |
| 4. Teen births (% of all live births born to adolescent mothers) | 205% higher or 3.1 times higher |
| 5. Injury and poisoning emergency department (ED) visits | 44% higher or 1.4 times higher |
| 6. Injury and poisoning ED visits (children and youth) | 25% higher or 1.3 times higher |
| 7. Injury and poisoning hospitalizations | 24% higher or 1.2 times higher |
| 8. Obesity | 102% higher or 2.0 times higher |
| 9. ED visits (all causes) | 71% higher or 1.7 times higher |
| 10. Hospitalizations (all causes) | 20% higher or 1.2 times higher |
| 11. Access to a regular medical doctor | 11% lower or 0.1 times lower |
| 12. Intentional self-harm ED visits | 226% higher or 3.3 times higher |
| 13. Intentional self-harm hospitalizations | 242% higher or 3.4 times higher |
| 14. Mental health episodes ED visits | 341% higher or 4.4 times higher |
| 15. Mental health episodes hospitalizations | 288% higher or 3.9 times higher |
cA statistically significant relationship means that there is less than 5% probability that the observed difference was due to chance. See Appendix D for further discussion of statistical significance.
General health
1. Self-rated health (excellent / very good)
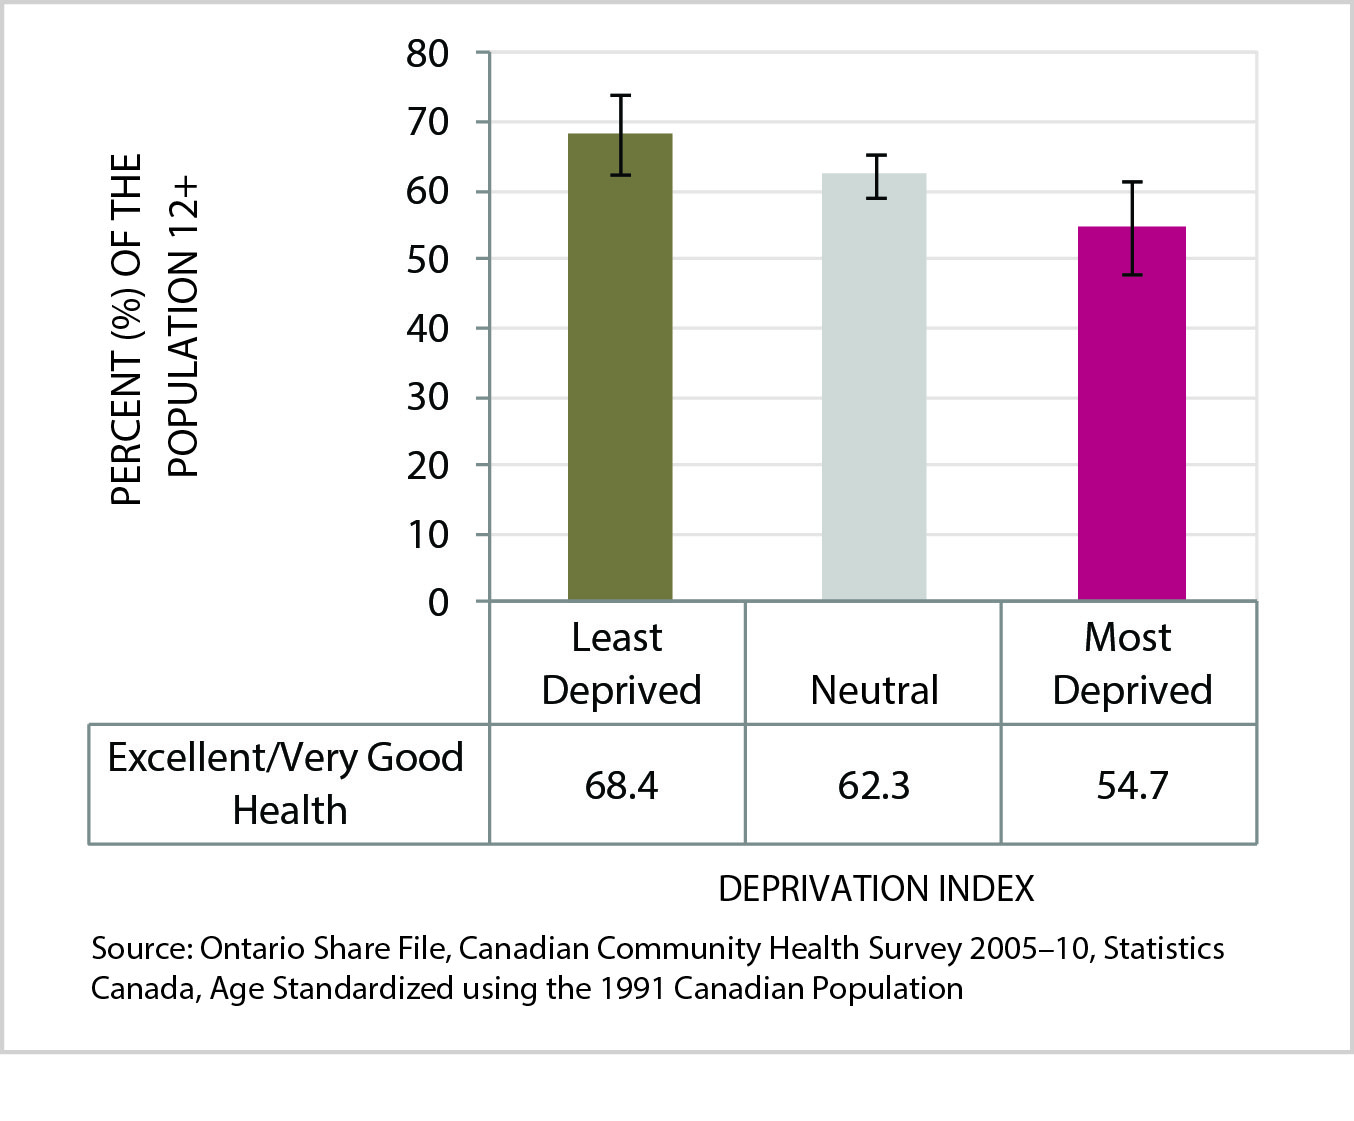
The prevalence rate of self-rated health (excellent/very good) is a measure of the percentage of residents aged 12 and over in the Sudbury & District Health Unit’s service area who rated their health as “excellent” or “very good” when surveyed between 2005 and 2010. The rate is presented by level of deprivation.
Figure 4. Age-standardized prevalence rate of excellent/very good health (self-rated), by deprivation index category, SDHU area, 2005–2010
Data Table for Figure 4. Age-Standardized Prevalence Rate of Excellent/Very Good Health (Self-Rated), by Deprivation Index Category, SDHU Area, 2005-2010
| Excellent/Very Good Health | Least Deprived | Neutral | Most Deprived |
|---|---|---|---|
| Percent of the Population 12+ | 68.4 | 62.3 | 54.7 |
| Lower Confidence Interval | 62.4 | 59.3 | 47.9 |
| Upper Confidence Interval | 74.3 | 65.3 | 61.4 |
The age-standardized prevalence rate of excellent or very good self-rated health decreases significantly with increasing levels of deprivation. The rate among residents in the City of Greater Sudbury’s most deprived areas was 55%, or 0.2 times lower than that for residents in the City’s least deprived areas (68%).
Health opportunity: If everyone in the City of Greater Sudbury experienced the same opportunities for well-being as those within the least deprived group, there would be 9,706 (7%) more people in the City who rate their health as excellent or very good.
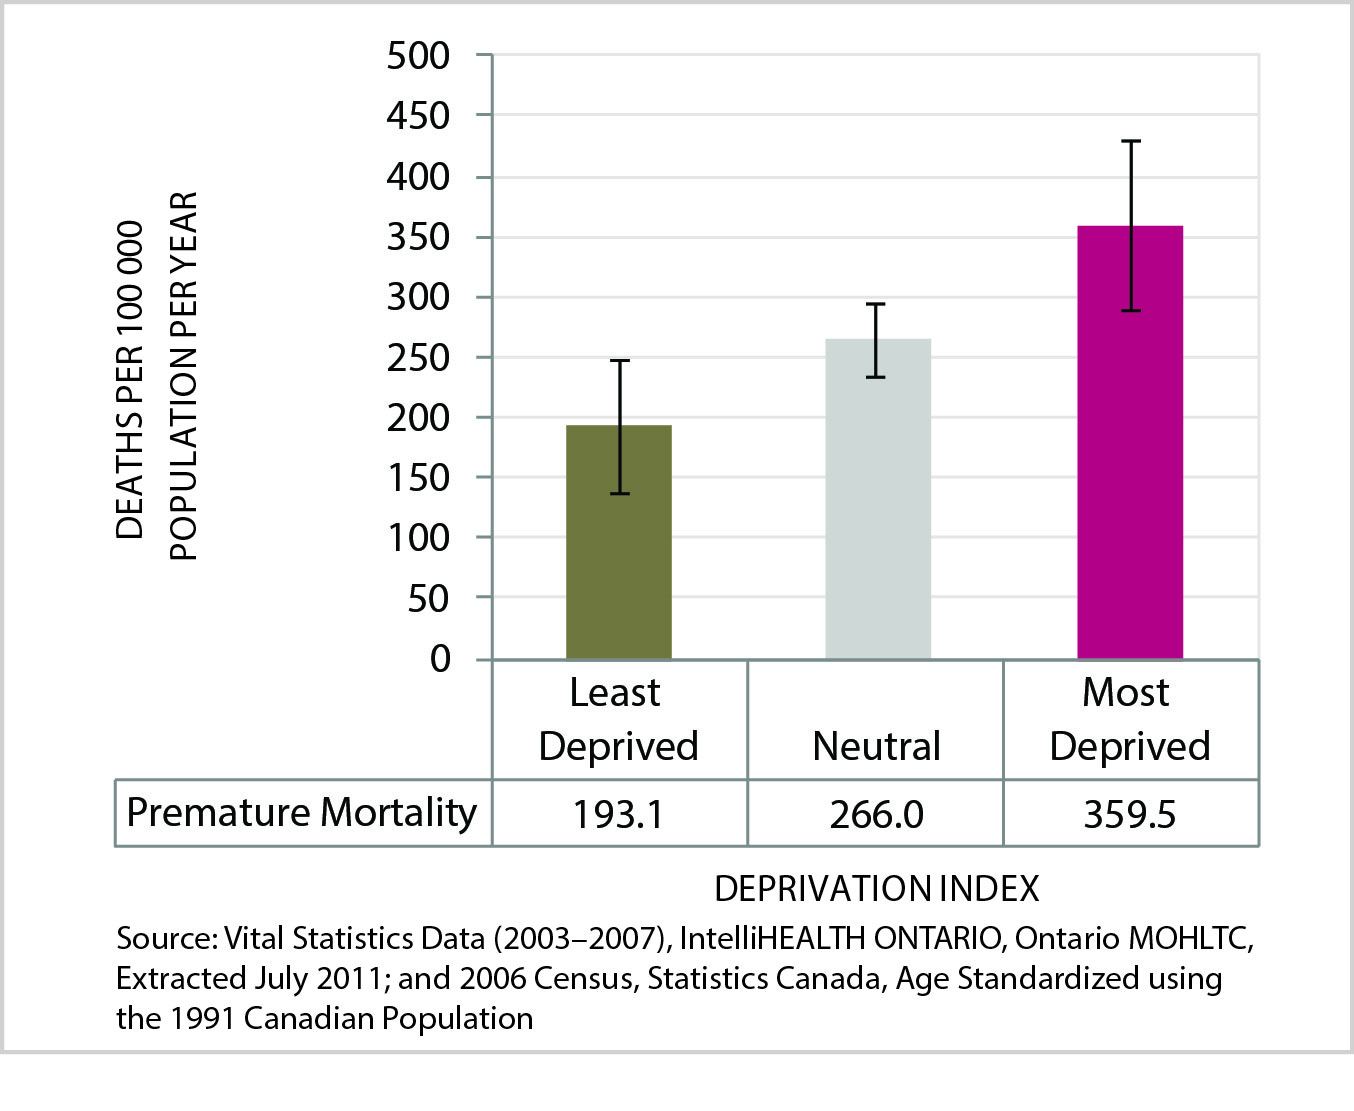
2. Premature mortality (dying before age 75)
Community levels of premature death can indicate how everyday living and working conditions influence the health and related longevity of residents. Across the globe, death rates are systematically higher among groups of lower socio-economic status, whether that status is measured by income, education or occupational class.9
Figure 5. Age-standardized rate of premature mortality (<75 years), by deprivation index category, City of Greater Sudbury, 2003-2007 average per year
Data Table for Figure 5. Age-standardized rate of premature mortality (<75 years), by deprivation index category, City of Greater Sudbury, 2003-2007 average per year
| Premature Mortality | Least Deprived | Neutral | Most Deprived |
|---|---|---|---|
| Deaths Per 100 000 Population Per Year | 193.1 | 266.0 | 359.5 |
| Lower Confidence Interval | 138.2 | 235.5 | 289.3 |
| Upper Confidence Interval | 248.0 | 296.5 | 429.6 |
The premature mortality rate is a measure of how many Greater Sudbury residents died before the age of 75. The rate for the years 2003 to 2007 is presented per 100,000 residents in the City aged 75 years or younger, by level of deprivation.
The age-standardized rate of premature mortality (death before the age of 75) increases significantly with increasing levels of deprivation. The annual rate among residents in Greater Sudbury’s most deprived areas was 360 deaths per 100,000 population (aged 75 years and under), or 1.9 times higher than that for residents in the City’s least deprived areas (193 per 100,000).
Health opportunity: If everyone in the City of Greater Sudbury experienced the same opportunities for well-being as those within the least deprived group, each year there would be 131 (28%) fewer premature deaths from all causes in the City.
Maternal and child health
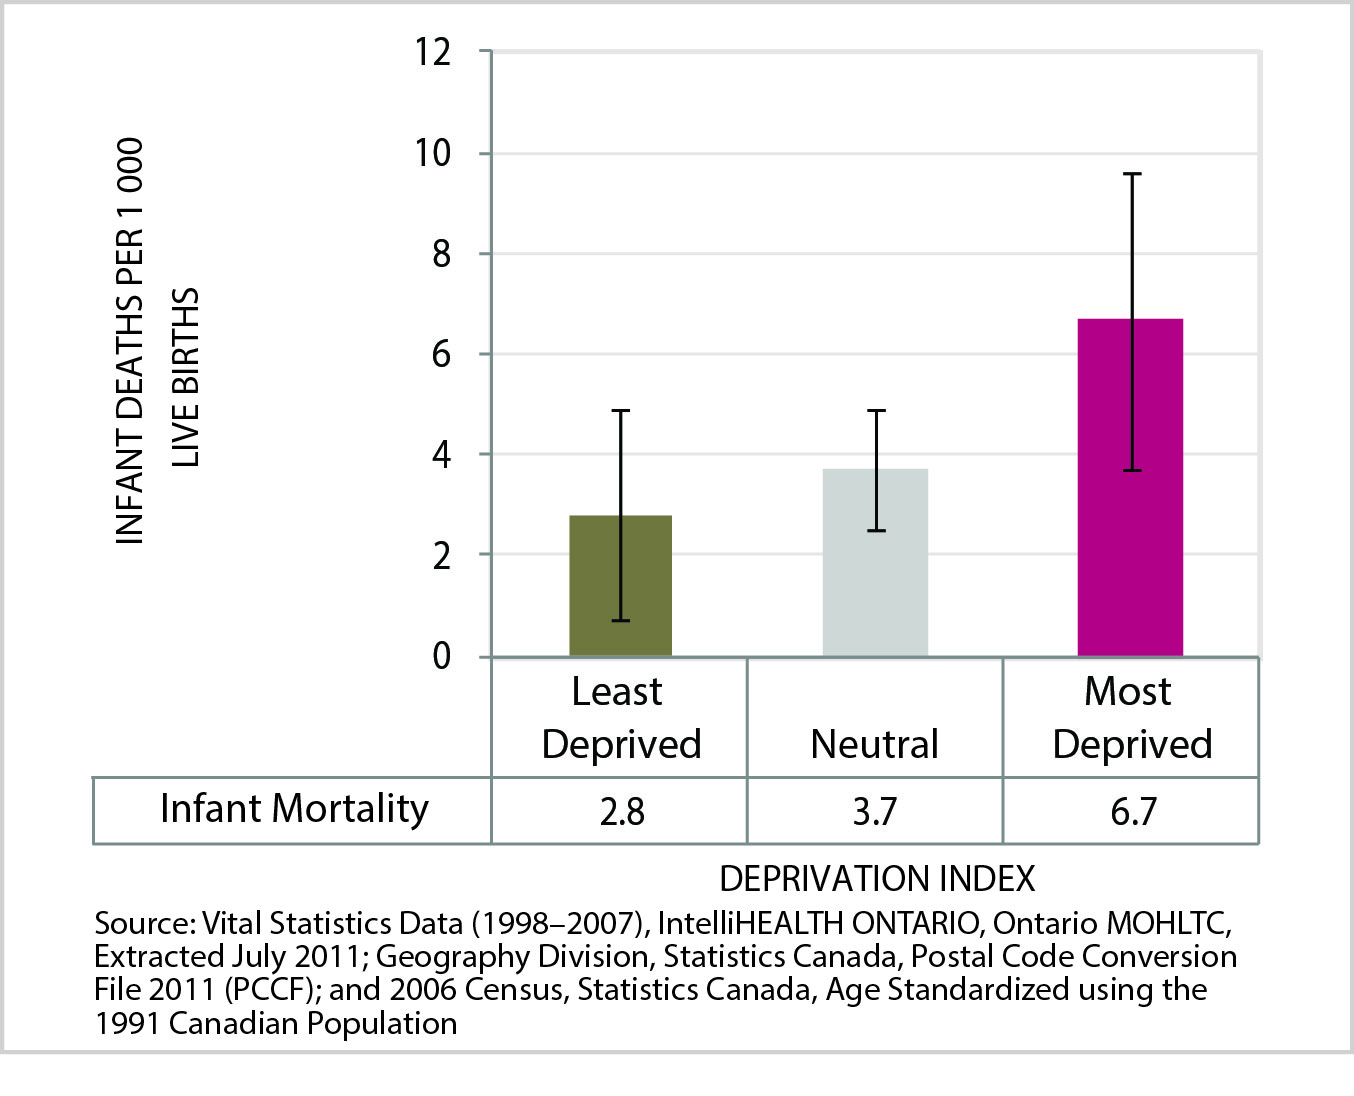
3. Infant mortality
Around the world, infant mortality is correlated with social deprivation and is an important marker of child health. 10 For example, a Canadian study conducted in 2007 found, “higher-than-average infant mortality rates among those in the poorest neighbourhoods (7.1 deaths per 1,000 live births in Canada’s poorest neighbourhoods, compared with 5.0 deaths per 1,000 live births in Canada’s richest neighbourhoods).”11
Figure 6. Infant mortality rate, by deprivation index category, city of Greater Sudbury, 1998-2007 average
Data Table for Figure 6. Infant mortality rate, by deprivation index category, city of Greater Sudbury, 1998-2007 average
| Infant Mortality | Least Deprived | Neutral | Most Deprived |
|---|---|---|---|
| Infant Deaths Per 1 000 Live Births | 2.8 | 3.7 | 6.7 |
| Lower Confidence Interval | 0.7 | 2.5 | 3.7 |
| Upper Confidence Interval | 4.9 | 4.9 | 9.6 |
Infant mortality in this analysis measures how many infants (less than one year old) died between 1998 and 2007 in Greater Sudbury. The rate is presented per 1,000 live births in the City, by level of deprivation.
The rate of infant mortality increases significantly between areas with lowest and highest levels of deprivation. The mortality rate among infants in Greater Sudbury’s most deprived areas was 7 per 1,000 live births per year, or 2.4 times higher than that for infants in the City’s least deprived areas (3 per 1,000).
Health opportunity: If everyone in the City of Greater Sudbury experienced the same opportunities for well-being as those within the least deprived group, each year there would be one less infant who died within their first year of life.
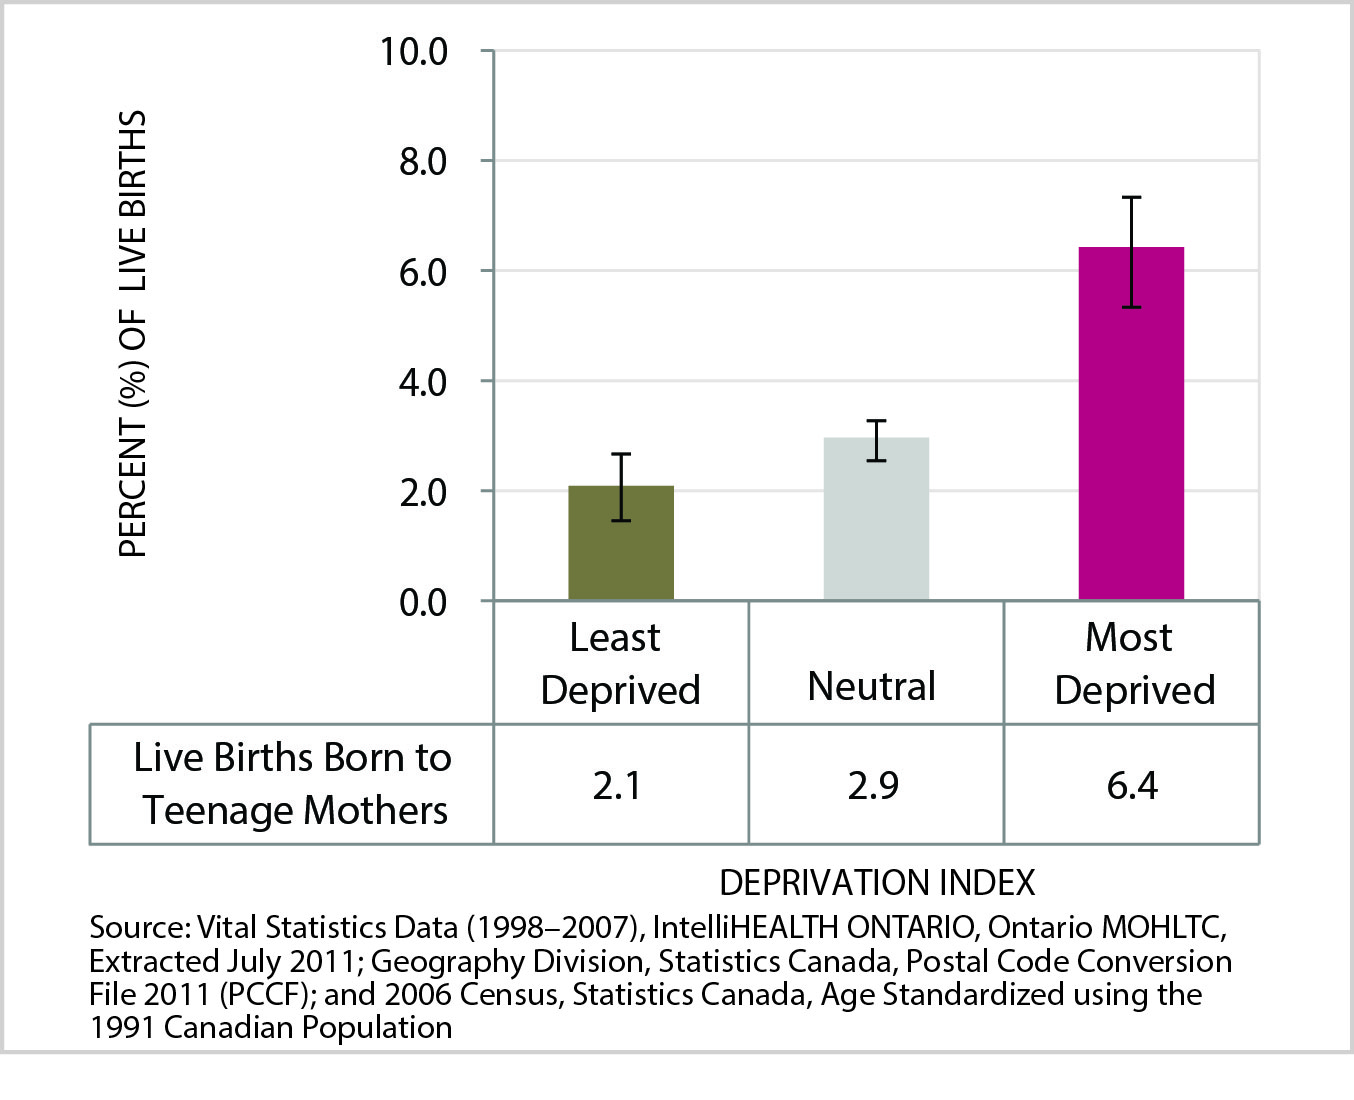
4. Teen births (% of all live births born to adolescent mothers)
Adolescent pregnancy is correlated with increased pregnancy risks for mothers and health concerns for their children.12, 13 These risks persist in developed countries where teenage pregnancy is associated with socio-economic deprivation.14 The health risks of teenage pregnancy may be overcome with appropriate support systems, health care access and economic means.
Figure 7. Teen pregnancy rate, by deprivation index category, City of Greater Sudbury, 1998-2007 average
Data Table for Figure 7. Teen pregnancy rate, by deprivation index category, City of Greater Sudbury, 1998-2007 average
| Live Births Born to Teenage Mothers | Least Deprived | Neutral | Most Deprived |
|---|---|---|---|
| Percent of Live Births | 2.1 | 2.9 | 6.4 |
| Lower Confidence Interval | 1.5 | 2.6 | 5.4 |
| Upper Confidence Interval | 2.7 | 3.3 | 7.4 |
The teen births indicator measures the proportion of live births born to teenage mothers (aged 15 to 19 years) in Greater Sudbury between 1998 and 2007.d The rate is presented as a proportion of live births in the City, by level of deprivation.
The percentage of live births born to teenage mothers increases significantly with increasing levels of deprivation. The rate in Greater Sudbury’s most deprived areas was 6 in 100 live births per year, or 3.1 times higher than that of the City’s least deprived areas (2 in 100).
Health opportunity: If all women aged 15 to 19 in the City of Greater Sudbury experienced the same opportunities for well-being as those within the least deprived group, each year there would be 17 (39%) fewer teen births.
dThis indicator was used instead of the more commonly reported teen pregnancy rate, because calculation of pregnancy rates requires data on therapeutic abortions. Therapeutic abortion data is not readily available by postal code, which is required for the method of analysis used in this report.
Chronic disease and injuries
The prevalence of chronic disease is increasing in Canada.5 Chronic diseases and injuries can decrease life expectancy and the number of years a person is expected to live in good health. Analyses have shown that low socio-economic status is related to higher rates of injuries and injury-related deaths, life expectancy and health adjusted life expectancy (the average number of years that an individual is expected to live in a healthy state).16, 17
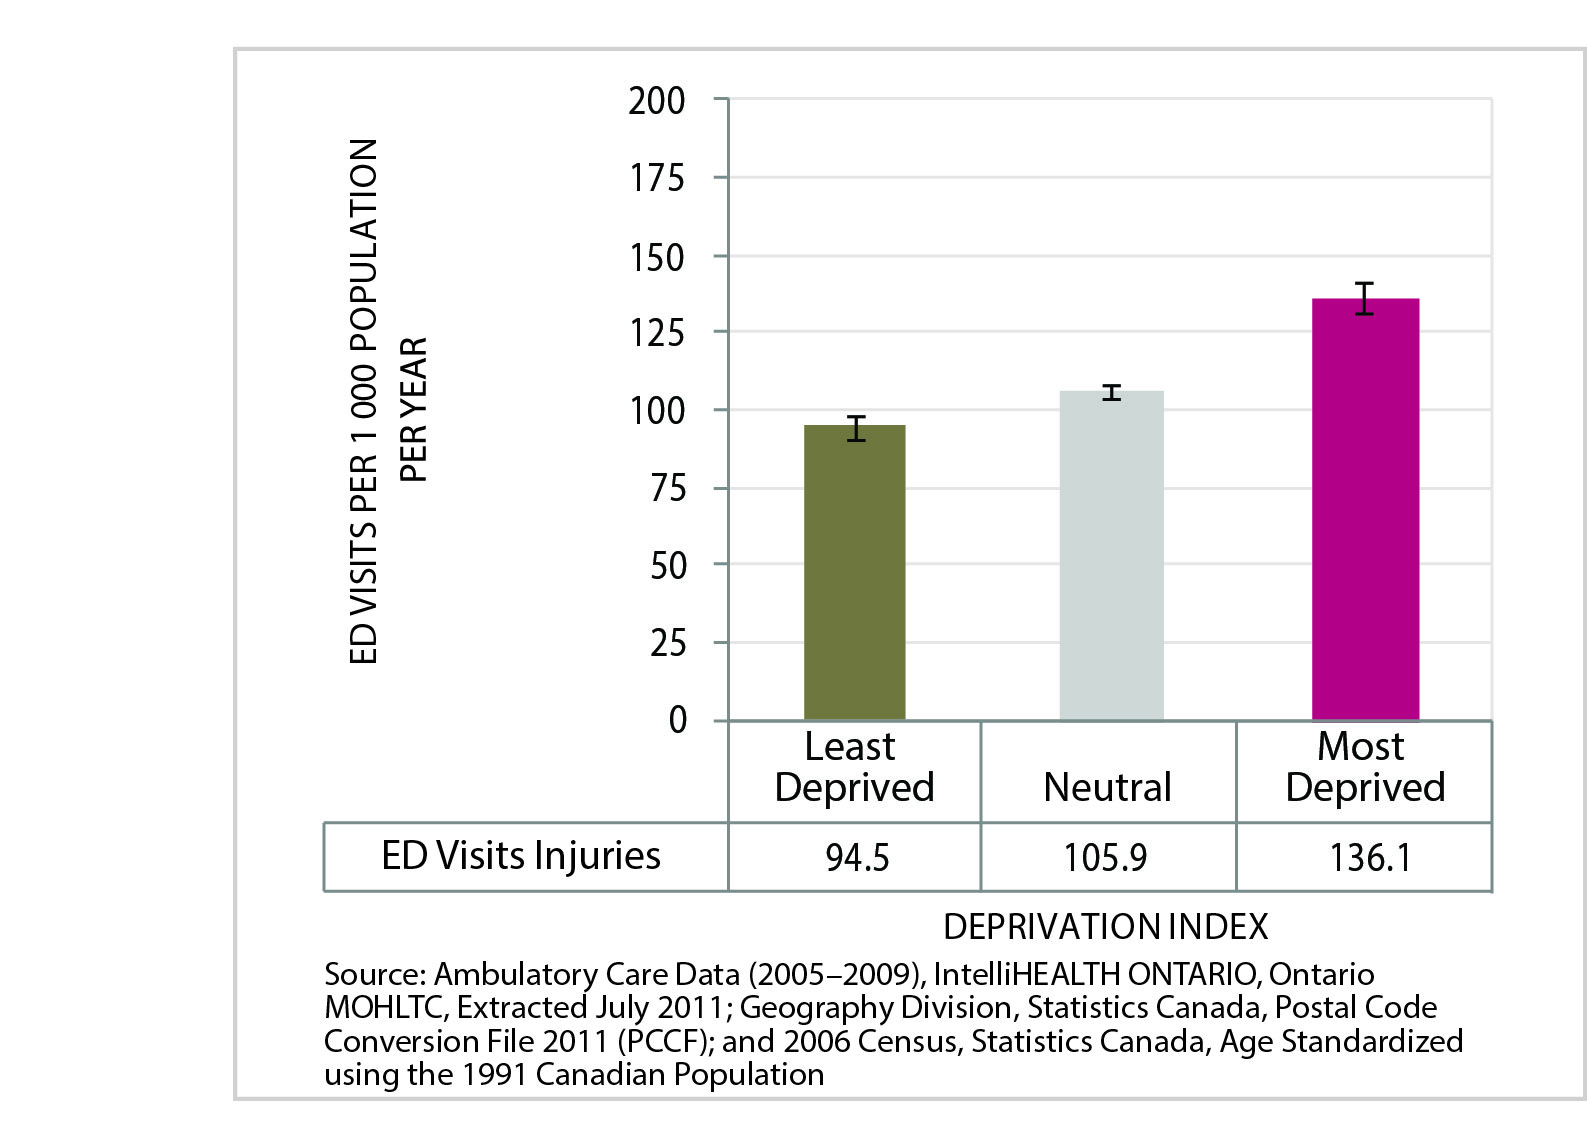
5. Injury and poisoning ED visits
For many age groups in the population, injuries are one of the most common reasons for illness requiring medical care. Injuries are an important contributor to decreased productivity, health care costs and preventable morbidity in Canada.18
Figure 8. Age-standardized rate of injury and poisoning emergency department visits, by deprivation index category, City of Greater Sudbury, 2005-2009 average per year
Data Table for Figure 8. Age-standardized rate of injury and poisoning emergency department visits, by deprivation index category, City of Greater Sudbury, 2005-2009 average per year
| ED Visits Injuries | Least Deprived | Neutral | Most Deprived |
|---|---|---|---|
| ED Visits per 1 000 Population Per Year | 94.5 | 105.9 | 136.1 |
| Lower Confidence Interval | 90.3 | 103.8 | 131.4 |
| Upper Confidence Interval | 98.7 | 108.1 | 140.8 |
The injury and poisoning emergency department visit rate measures how often Greater Sudbury residents were treated in an emergency department for these events. The rate for the years 2005 to 2009 is presented per 1,000 residents of the City, by level of deprivation.
The age-standardized rate of emergency department visits for injuries and poisonings increases significantly with increasing levels of deprivation. The rate among residents of Greater Sudbury’s most deprived areas was 136 visits per 1,000 population per year, or 1.4 times higher than that for residents of the City’s least deprived areas.
Health opportunity: If everyone in the City of Greater Sudbury experienced the same opportunities for well-being as those within the least deprived group, each year there would be 2,491 (16%) fewer emergency department visits for injuries and poisonings in the City.
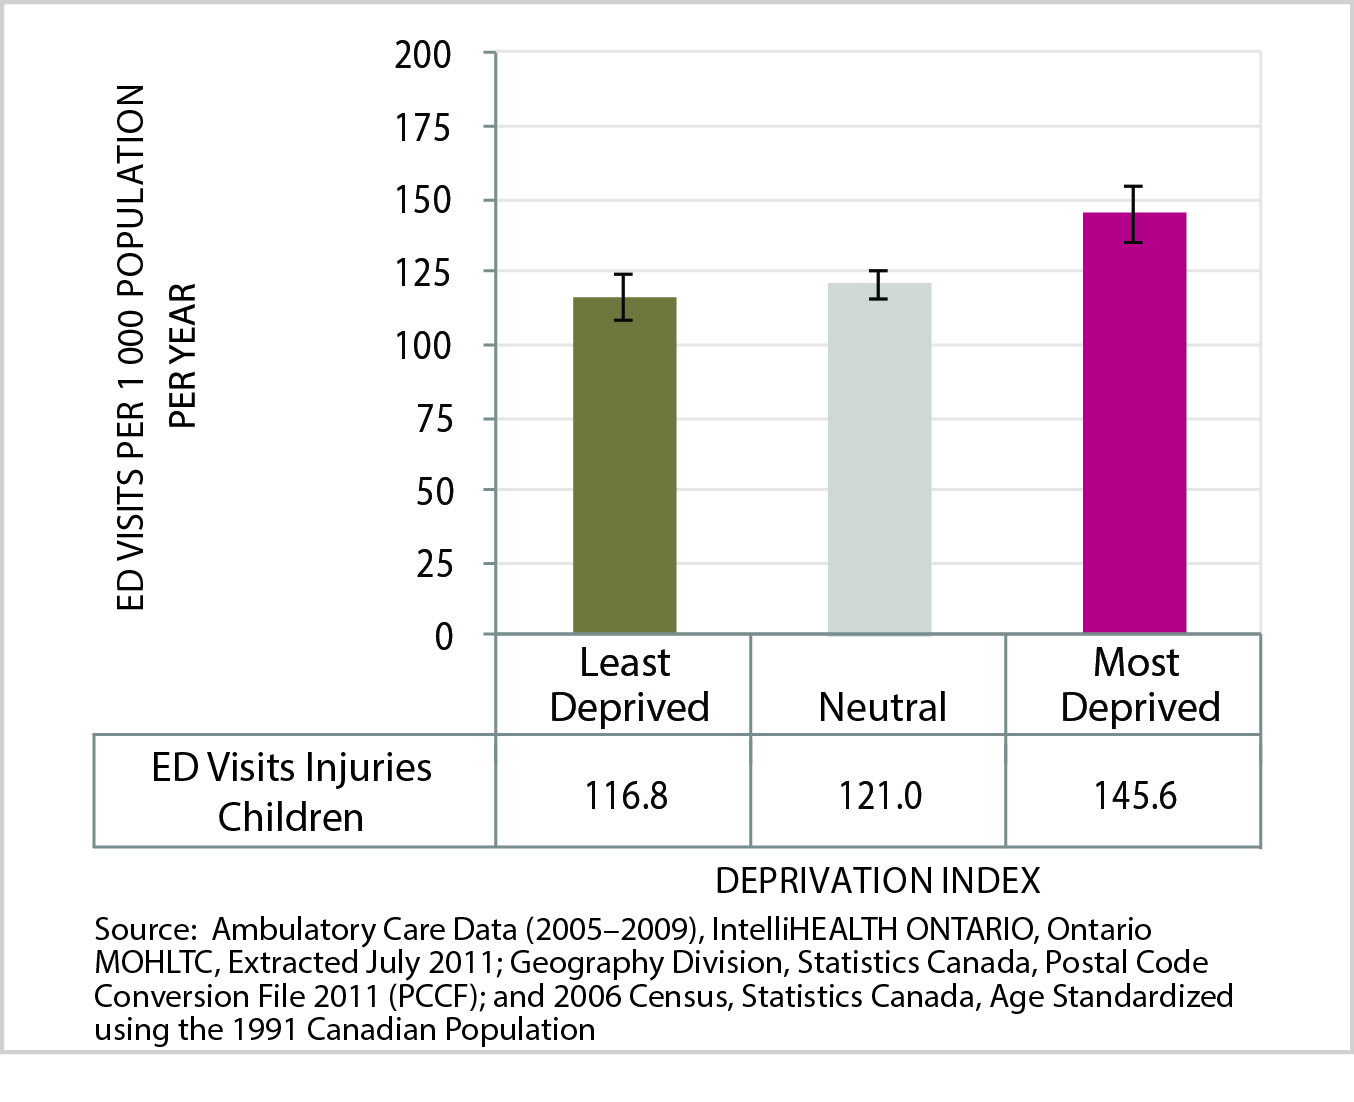
6. Injury and poisoning ED visits (children and youth)
Unintentional injuries are the leading cause of death for Canadian children and youth aged 1 to 19.19 Children’s physical characteristics, behaviours and abilities change with their growth and development. Some of these developmental features can increase their vulnerability to injury from hazards in their environment. For example, since children have smaller body sizes than adults, a quantity of a poisonous substance will be more toxic for a child than for an adult.20 Childhood injury is linked to social status, poverty, and education. Children living in lower socio-economic positions have increased risks of injury.21
Figure 9. Age-standardized rate of injury and poisoning emergency department visits (children), by deprivation index category, City of Greater Sudbury, 2005-2009 average per year
Data Table for Figure 9. Age-standardized rate of injury and poisoning emergency department visits (children), by deprivation index category, City of Greater Sudbury, 2005-2009 average per year
| ED Visits Injuries Children | Last Deprived | Neutral | Most Deprived |
|---|---|---|---|
| ED Visits Per 1 000 Population Per Year | 116.8 | 121.0 | 145.6 |
| Lower Confidence Interval | 108.7 | 116.5 | 135.9 |
| Upper Confidence Interval | 124.8 | 125.4 | 155.4 |
The injury and poisoning emergency department visit rate reflects how often Greater Sudbury infants, children, and youth aged 0 to 19 years were treated in an emergency department. The City rate for the years 2005 to 2009 is presented per 1,000 children by level of deprivation.
The age-standardized rate of emergency department visits for injuries and poisonings among children increases significantly between areas with the lowest and highest levels of deprivation. The annual rate among children of Greater Sudbury’s most deprived areas was 146 emergency department visits per 1,000 children, or 1.3 times higher than that for children in the City’s least deprived areas (117 per 1,000).
Health opportunity: If everyone in the City of Greater Sudbury experienced the same opportunities for well-being as those within the least deprived group, each year there would be 280 (6%) fewer emergency department visits for injuries and poisonings among children in the City.
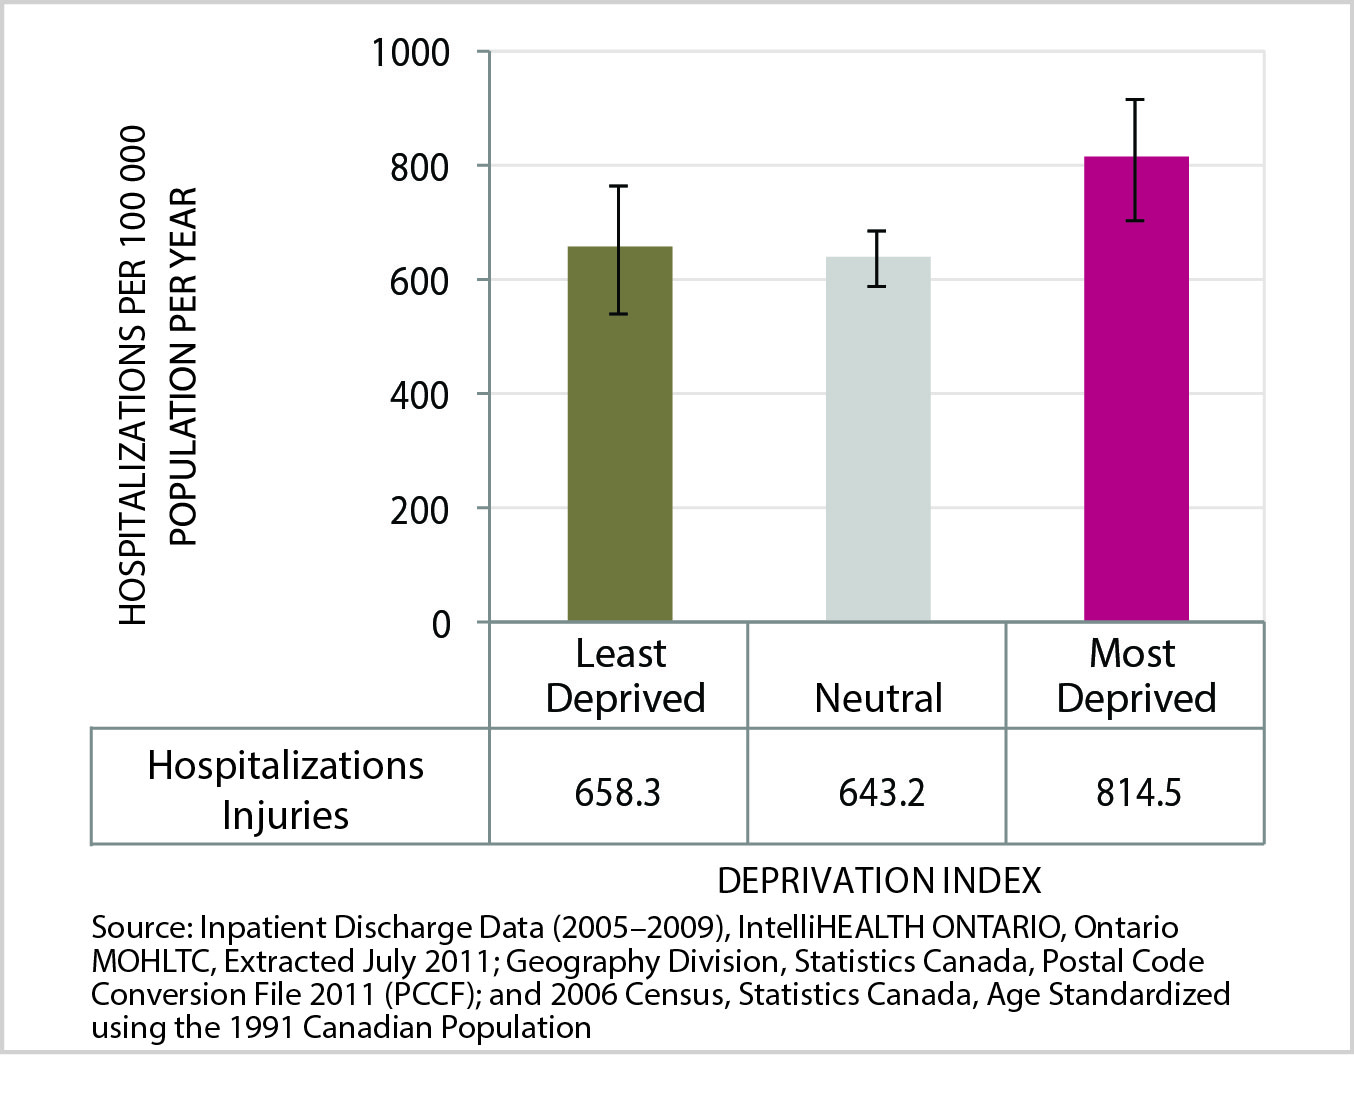
7. Injury and poisoning hospitalizations
Poisoning was the third leading cause of unintentional injury death in Canada between 2001 and 2007.22 Unintentional poisoning can occur from occupational exposure or presence of medications, chemicals, pesticides and plants in the home. Lack of awareness and knowledge about measures to reduce exposure to toxic products, can increase risk for poisoning.23 In Canada, hospitalizations from injuries are most prevalent in the least affluent neighborhoods.24 People with lower socio-economic status experience higher rates of injuries and poisonings.25
Figure 10. Age-standardized rate of injury and poisoning hospitalizations, by deprivation index category, City of Greater Sudbury, 2005-2009 average per year
Data Table for Figure 10. Age-standardized rate of injury and poisoning hospitalizations, by deprivation index category, City of Greater Sudbury, 2005-2009 average per year
| Hospitalizations Injuries | Last Deprived | Neutral | Most Deprived |
|---|---|---|---|
| Hospitalization Per 100 000 Population Per Year | 658.3 | 643.2 | 814.5 |
| Lower Confidence Interval | 546.5 | 593.5 | 706.3 |
| Upper Confidence Interval | 770.1 | 692.8 | 922.7 |
The rate of hospitalizations from injuries and poisonings indicates how many Greater Sudbury residents were discharged from a hospital for injuries and poisonings. The City’s rate for the years 2005 to 2009 is presented per 100,000 residents, by level of deprivation.
The age-standardized rate of hospitalization for injuries and poisonings increases significantly between areas with the lowest and highest levels of deprivation. The annual rate among residents in Greater Sudbury’s most deprived areas was 814 hospitalizations per 100,000 population, or 1.2 times higher than that for residents in the City’s least deprived areas (658 per 100,000).
Health opportunity: If everyone in the City of Greater Sudbury experienced the same opportunities for well-being as those within the least deprived group, each year there would be 154 (14%) fewer hospitalizations for injuries and poisonings in the City.
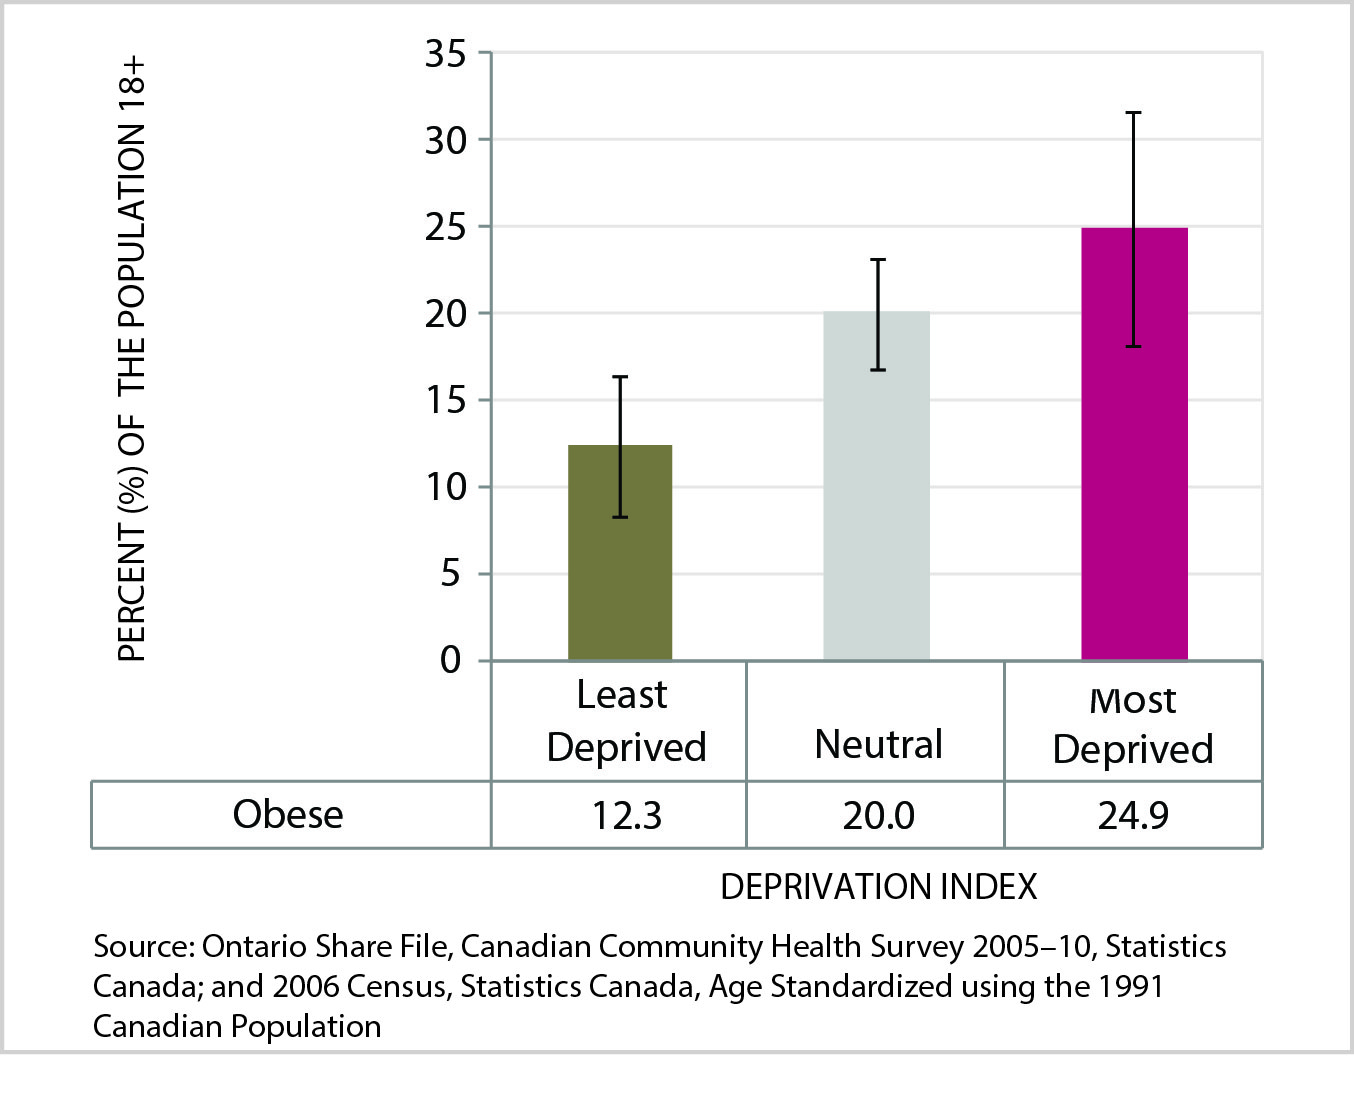
8. Obesity
Obesity is a complex issue, with many interacting factors that contribute to increasing rates. Addressing this important risk factor for multiple chronic diseases requires preventive approaches that acknowledge the social and economic determinants that influence obesity rates.26
Figure 11. Age-standardized rate of obese (ages 18+), by deprivation index category, Sudbury & District Health Unit, 2005-2010 average
Data Table for Figure 11. Age-standardized rate of obese (ages 18+), by deprivation index category, Sudbury & District Health Unit, 2005-2010 average
| Obese | Last Deprived | Neutral | Most Deprived |
|---|---|---|---|
| Percent of the Population 18+ | 12.3 | 20.0 | 24.9 |
| Lower Confidence Interval | 8.3 | 16.8 | 18.2 |
| Upper Confidence Interval | 16.4 | 23.2 | 31.6 |
Obesity prevalence is expressed in this report as the percentage of residents aged 18 and over in the City of Greater Sudbury who were classified as obese when asked during a telephone survey between 2005 and 2010. Obesity was determined based on respondents’ Body Mass Index (BMI), which was calculated using self-reported height and weight data. The obesity rate is presented by level of deprivation.
The age-standardized prevalence rate of obesity increases significantly with increasing levels of deprivation. The rate among residents in the City of Greater Sudbury’s most deprived areas was 25%, or 2.0 times higher than that for residents in the City’s least deprived areas (12%).
Health opportunity: If everyone in the City of Greater Sudbury experienced the same opportunities for well-being as those within the least deprived group, there would be 11,231 (38%) fewer people who were obese in the City.
Health service utilization
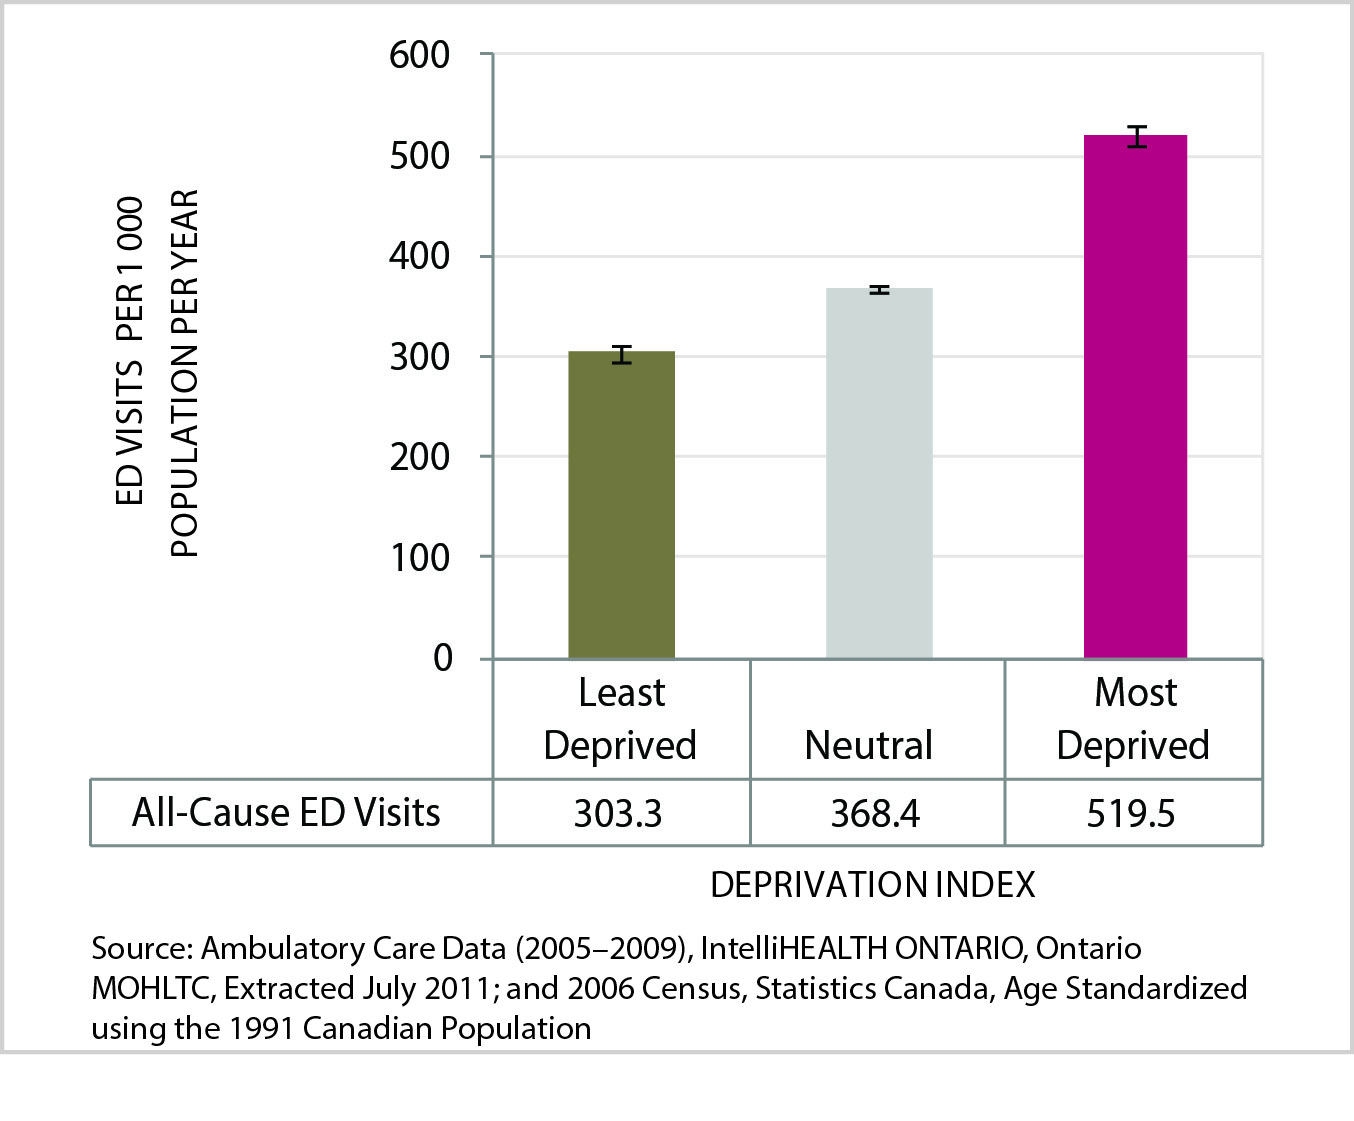
9. ED visits (all causes)
Material deprivation has been linked to higher use of the emergency department for medical care in an Ontario jurisdiction.27
Figure 12. Age-standardized rate of emergency department visits (all causes), by deprivation index category, City of Greater Sudbury, 2005-2009 average per year
Data Table for Figure 12. Age-standardized rate of emergency department visits (all causes), by deprivation index category, City of Greater Sudbury, 2005-2009 average per year
| All-Cause ED Visits | Least Deprived | Neutral | Most Deprived |
|---|---|---|---|
| ED Visits Per 1 000 Population Per Year | 303.3 | 368.4 | 519.5 |
| Lower Confidence Interval | 295.7 | 364.4 | 510.5 |
| Upper Confidence Interval | 311.0 | 372.4 | 528.6 |
The all-cause emergency department visit rate conveys how many Greater Sudbury residents were treated in an emergency department. The rate for the years 2005 to 2009 is presented per 1,000 residents of the City, by level of deprivation.
The age-standardized rate of emergency department visits for all causes rises significantly with increasing levels of deprivation. The rate among residents in Greater Sudbury’s most deprived areas was 520 visits per 1,000 population per year, or 1.7 times higher than that for residents in the City’s least deprived areas (303 per 1,000).
Health opportunity: If everyone in the City of Greater Sudbury experienced the same opportunities for well-being as those within the least deprived group, each year there would be 14,077 (14%) fewer emergency department visits for all causes in the City.
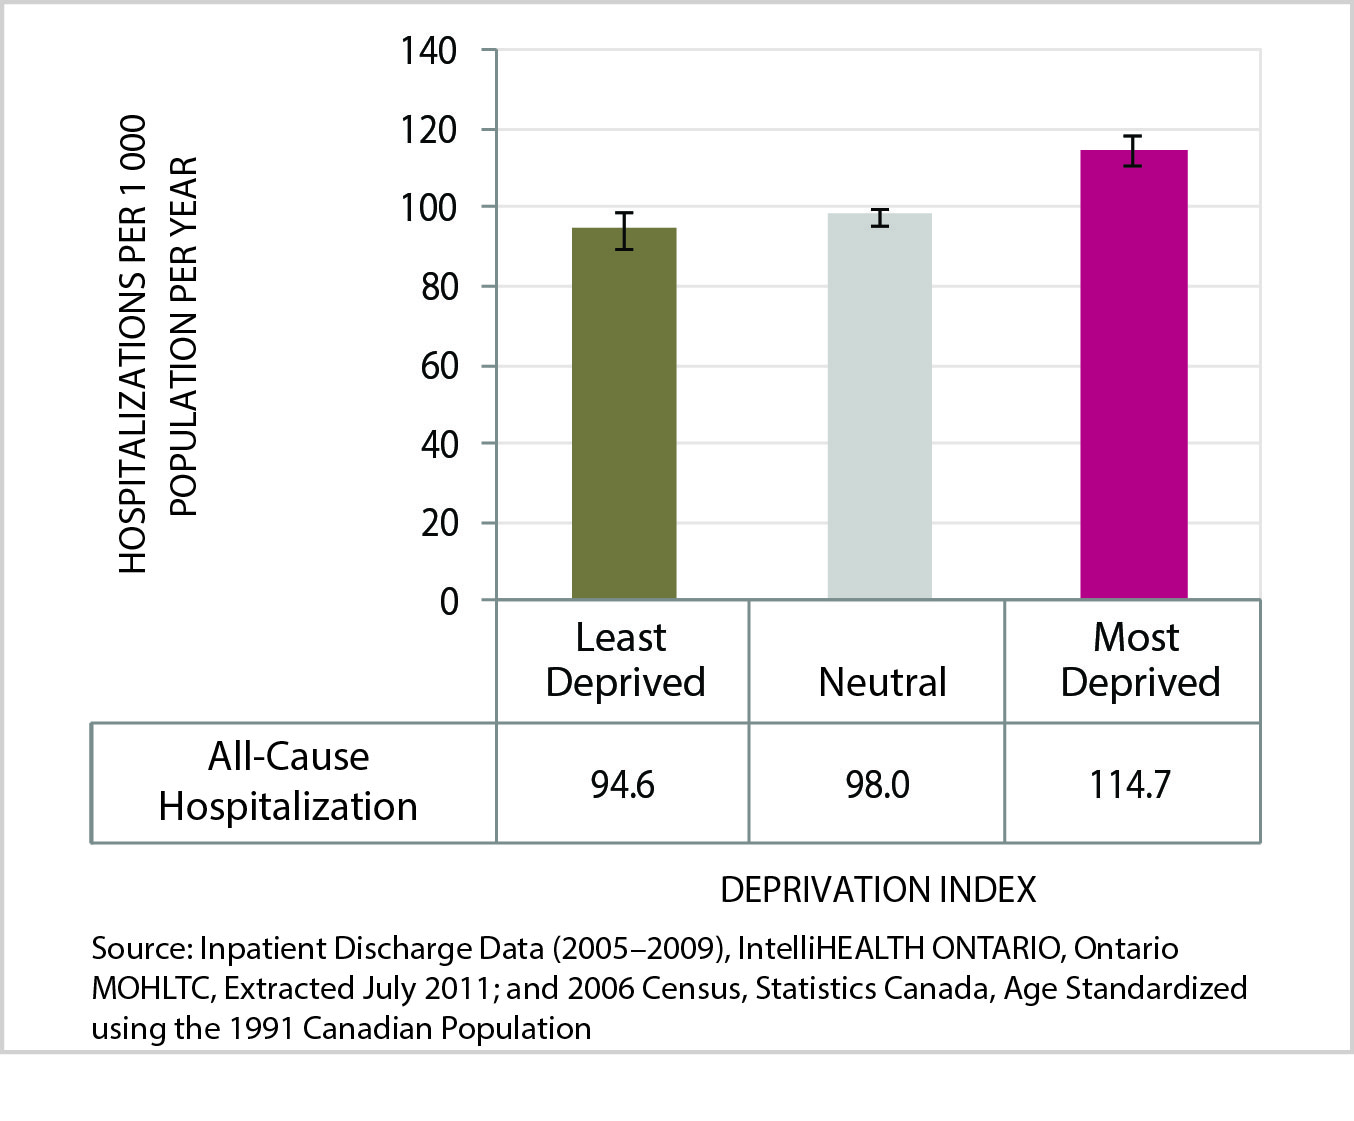
10. Hospitalizations (all causes)
Lower socio-economic status increases the likelihood of hospitalization for many acute and chronic illnesses.28 Increased risk for hospitalization related to preventable illness persists for those who live in low socio-economic neighbourhoods even when economic barriers to accessing care are removed.29
Figure 13. Age-standardized rate of hospitalization (all causes), by deprivation index category, City of Greater Sudbury, 2005-2009 average per year
Data Table for Figure 13. Age-standardized rate of hospitalization (all causes), by deprivation index category, City of Greater Sudbury, 2005-2009 average per year
| All-Cause Hospitalization | Least Deprived | Neutral | Most Deprived |
|---|---|---|---|
| Hospitalization Per 1 000 Population Per Year | 94.6 | 98.0 | 114.7 |
| Lower Confidence Interval | 90.2 | 95.9 | 110.6 |
| Upper Confidence Interval | 99.0 | 100.0 | 118.8 |
The all-cause hospitalization rate measures how often Greater Sudbury residents were discharged from a hospital. The rate for the years 2005 to 2009 is presented per 1,000 residents in the City, by level of deprivation.
The age-standardized rate of hospitalization for all causes increases significantly with increased levels of deprivation. The rate among residents in Greater Sudbury’s most deprived areas was 115 hospitalizations per 1,000 population per year, or 1.2 times higher than that for residents in the City’s least deprived areas
(95 per 1,000).
Health opportunity: If everyone in the City of Greater Sudbury experienced the same opportunities for well-being as those within the least deprived group, each year there would be 1,783 (12%) fewer hospitalizations for all causes in the City.
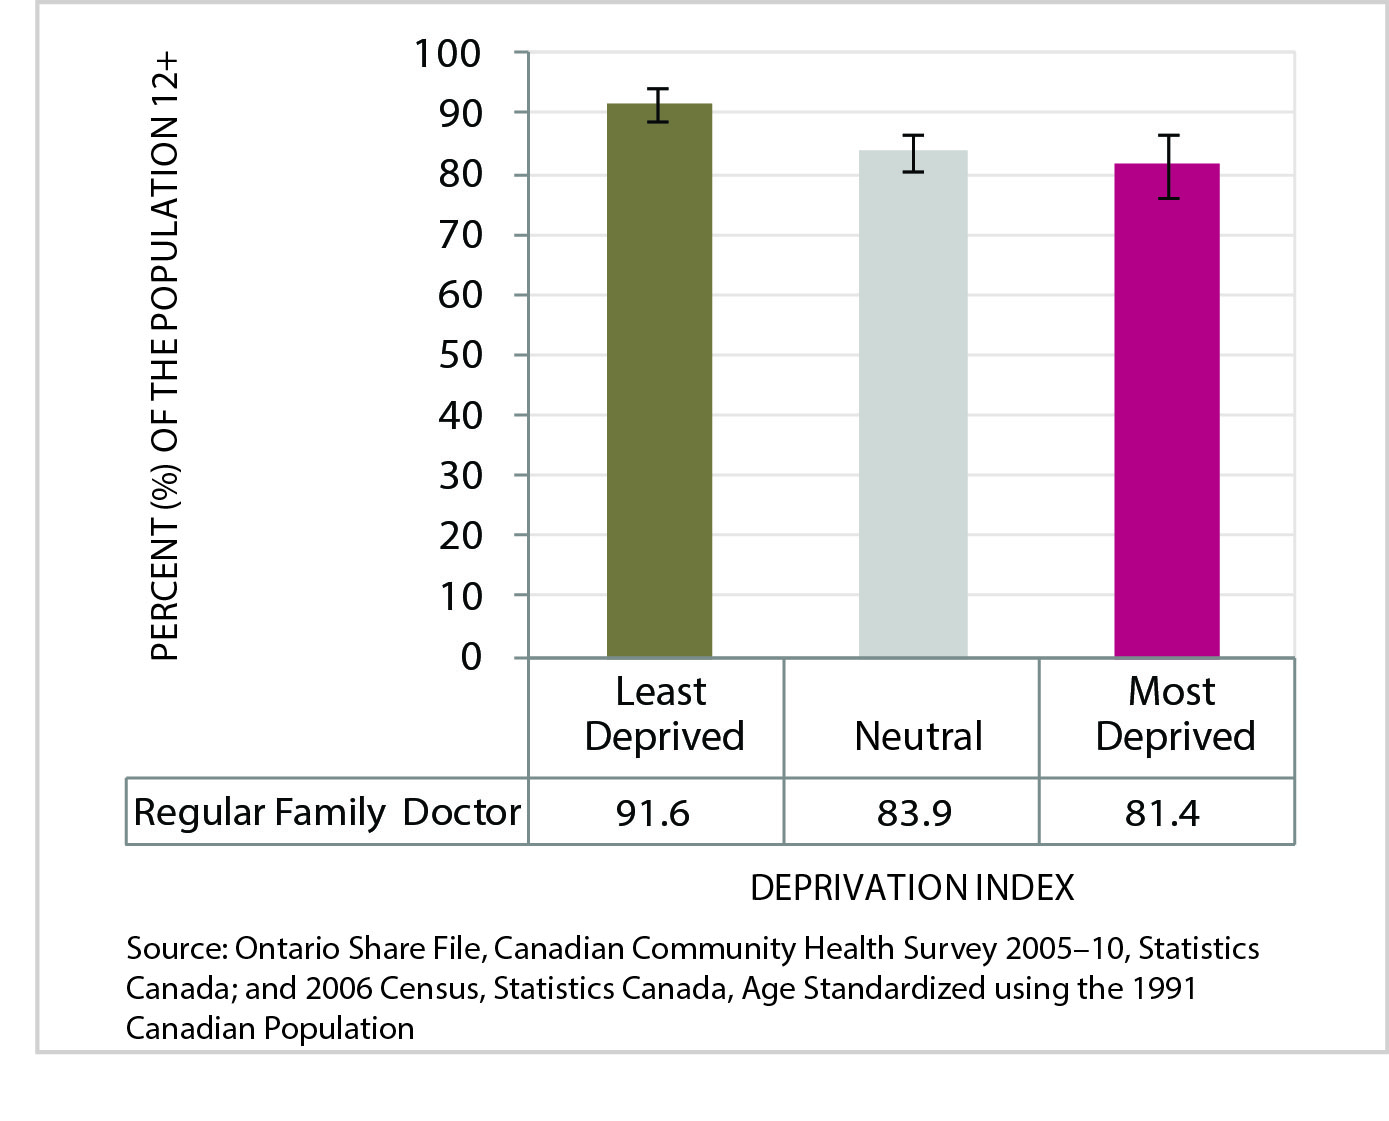
11. Access to a regular medical doctor
Regular access to a physician can enable people to review how they can promote their health in their daily lives, manage chronic conditions, and have acute medical issues managed in the most appropriate setting.
Figure 14. Age-standardized rate of residents who have a medical doctor (ages 12+), by deprivation index category, Sudbury & District Health Unit, 2005-2010 average
Data Table for Figure 14. Age-standardized rate of residents who have a medical doctor (ages 12+), by deprivation index category, Sudbury & District Health Unit, 2005-2010 average
| Regular Family Doctor | Least Deprived | Neutral | Most Deprived |
|---|---|---|---|
| Percent of the Population 12+ | 91.6 | 83.9 | 81.4 |
| Lower Confidence Interval | 88.7 | 80.8 | 76.4 |
| Upper Confidence Interval | 94.5 | 86.9 | 86.5 |
This indicator measures the percentage of residents in the City who reported that they have a regular medical doctor, when asked during a telephone survey between 2005 and 2010. The prevalence rate is presented by level of deprivation.
The age-standardized prevalence rate of individuals with a medical doctor decreases significantly with increasing levels of deprivation. The rate among residents in the City’s most deprived areas was 81%, or 0.1 times lower than that for residents in the City’s least deprived areas (92%).
Health opportunity: If everyone in the SDHU area enjoyed the same opportunities for well-being as those within the least deprived group, there would be 10,002 (6%) more people in our area who report having a regular medical doctor.
Mental health
“Social disadvantage is both a cause and consequence of mental illness; that is, mental illness, in all forms, is intrinsically social.”30 Mental health can be challenged by factors such as parental divorce, poverty and exclusion.31
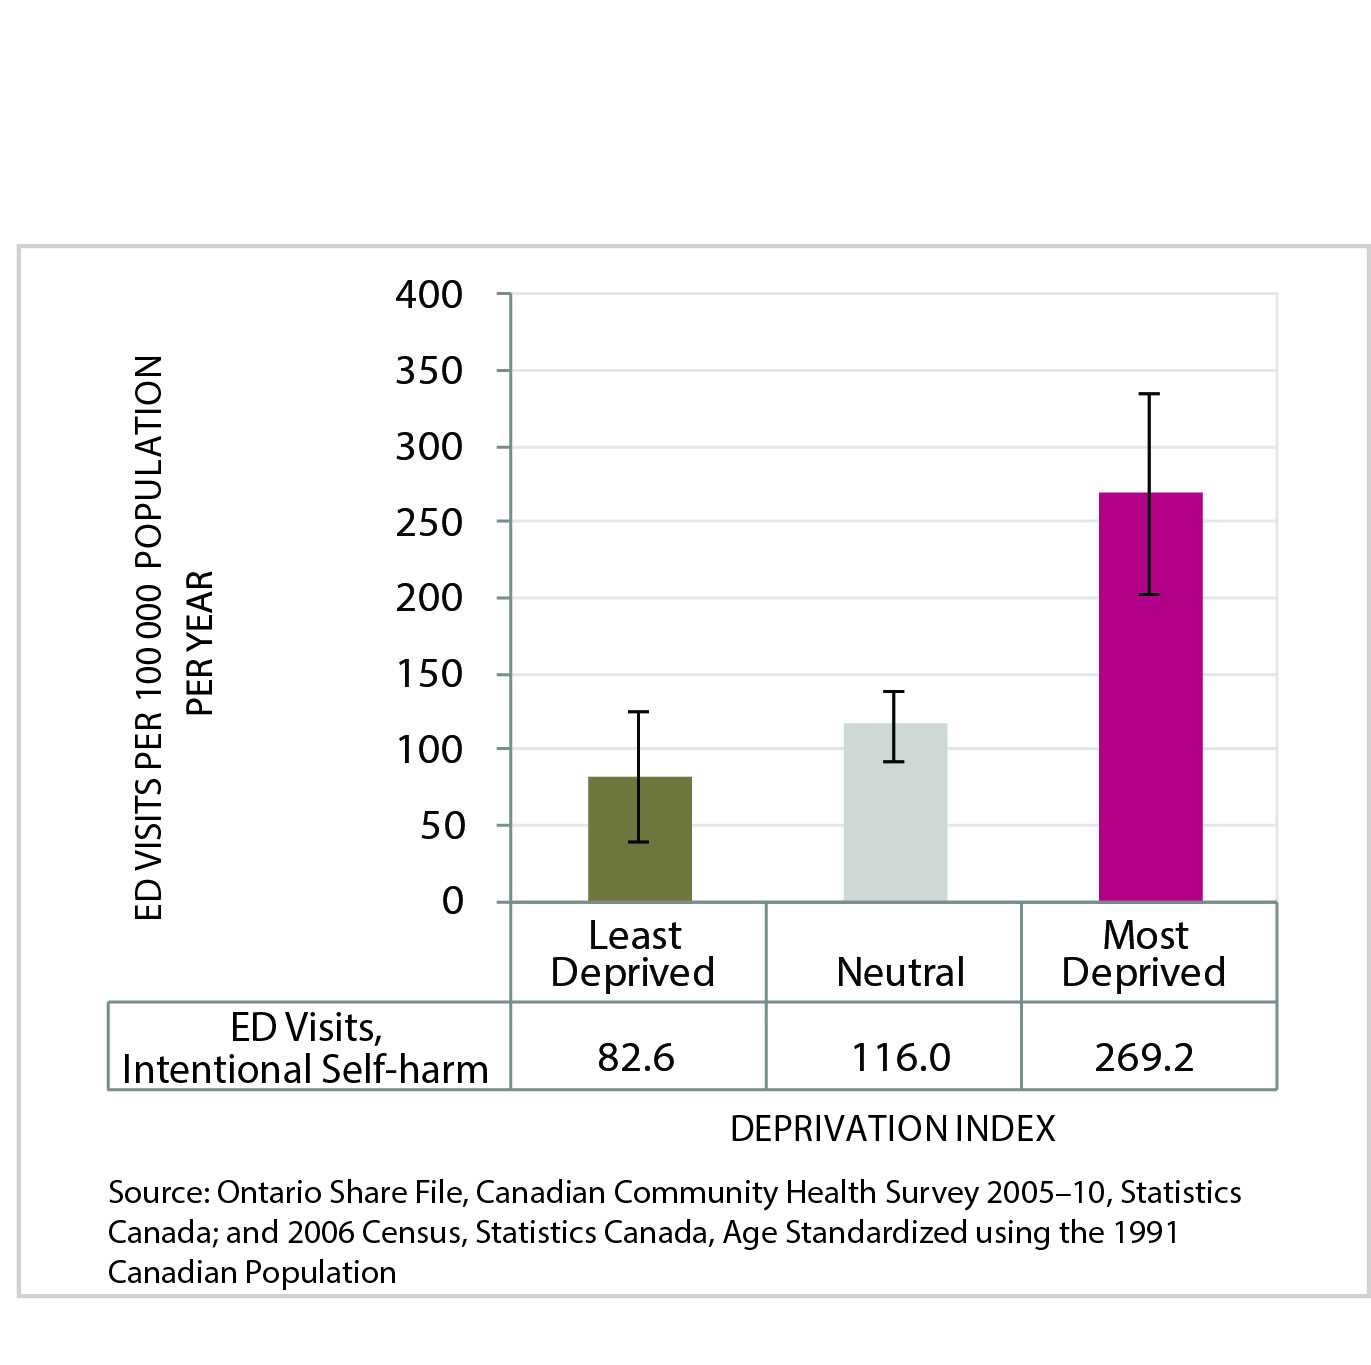
12. Intentional self-harm ED visits
The intentional self-harm emergency department visit rate measures how frequently Greater Sudbury residents were treated in an emergency department for self-induced injuries between 2005 and 2009. The rate is presented per 100,000 residents in the City, by level of deprivation.
Figure 15. Age-standardized rate of intentional self-harm emergency department visits, by deprivation index category, City of Greater Sudbury, 2005-2009 average per year
Data Table for Figure 15. Age-standardized rate of intentional self-harm emergency department visits, by deprivation index category, City of Greater Sudbury, 2005-2009 average per year
| ED Visits, Intentional Self-harm | Least Deprived | Neutral | Most Deprived |
|---|---|---|---|
| ED Visits per 100 000 Population Per Year | 82.6 | 116.0 | 269.2 |
| Lower Confidence Interval | 40.1 | 93.5 | 203.5 |
| Upper Confidence Interval | 125.0 | 138.6 | 334.9 |
The age-standardized rate of emergency department visits for intentional self-harm increases significantly with increasing levels of deprivation. The rate among residents of Greater Sudbury’s most deprived areas was 269 visits per 100,000 population per year, or 3.3 times higher than that for residents of the City’s least deprived areas (83 per 100,000).
Health opportunity: If everyone in the City of Greater Sudbury had the same opportunities for well-being as those within the least deprived group, each year there would be 83 (42%) fewer emergency department visits for intentional self-harm in the City.
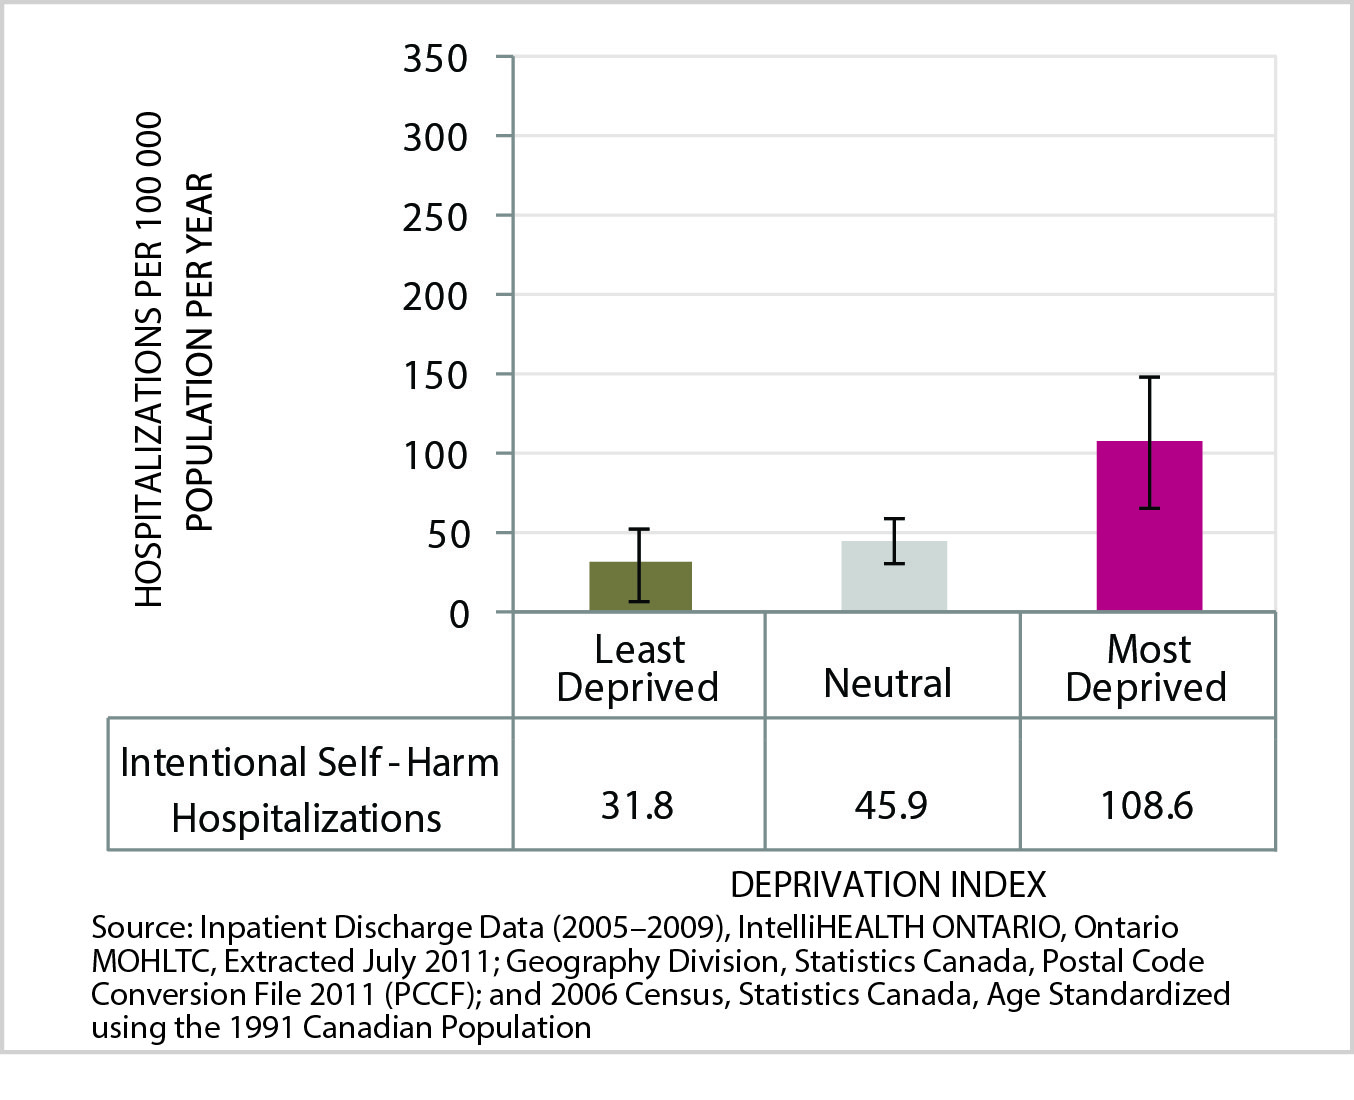
13. Intentional self-harm hospitalizations
The intentional self-harm hospitalization rate indicates how many Greater Sudbury residents were admitted to a hospital for intentional self-harm between 2005 and 2009. This measure reflects the serious self-harm episodes (suicide attempts) requiring a stay in hospital for treatment. The rate is presented per 100,000 residents in the City, by level of deprivation.
Figure 16. Age-standardized rate of intentional self-harm hospitalizations, by deprivation index category, City of Greater Sudbury, 2005-2009 average per year
Data Table for Figure 16. Age-standardized rate of intentional self-harm hospitalizations, by deprivation index category, City of Greater Sudbury, 2005-2009 average per year
| Intentional Self-Harm Hospitalizations | Least Deprived | Neutral | Most Deprived |
|---|---|---|---|
| Hospitalizations per 100 000 Population Per Year | 31.8 | 45.9 | 108.6 |
| Lower Confidence Interval | 8.4 | 32.1 | 67.2 |
| Upper Confidence Interval | 55.3 | 59.8 | 150.0 |
The age-standardized rate of hospitalization for intentional self-harm increases significantly between areas with the lowest and highest levels of deprivation. The rate among residents in Greater Sudbury’s most deprived areas was 109 hospitalizations per 100,000 population per year, or 3.4 times higher than that for residents in the City’s least deprived areas (32 per 100,000).
Health opportunity: If everyone in the City of Greater Sudbury experienced the same opportunities for well-being as those within the least deprived group, each year there would be 36 (44%) fewer hospitalizations for intentional self-harm in the City.
14. Mental health episodes ED visits
The mental health episodes emergency department visit rate is a measure of how many Greater Sudbury residents were treated in an emergency department between 2005 and 2009. The rate is presented per 100,000 residents of the City, by level of deprivation.
Figure 17. Age-standardized rate of mental health episodes emergency department visits, by deprivation index category, City of Greater Sudbury, 2005-2009 average
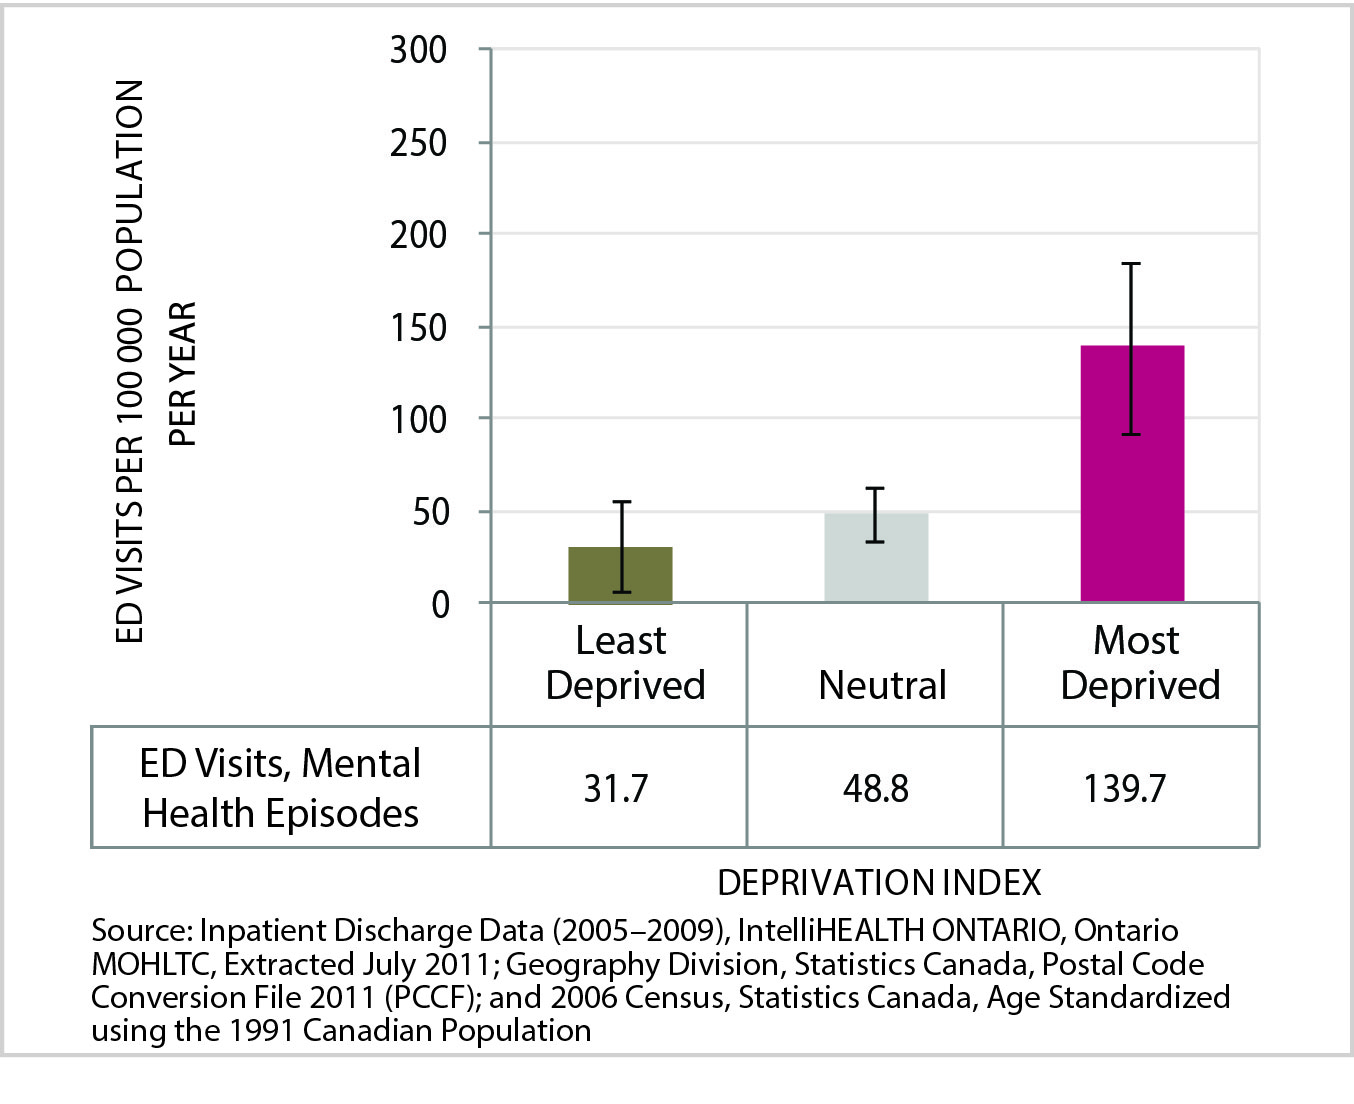
Data Table for Figure 17. Age-standardized rate of mental health episodes emergency department visits, by deprivation index category, City of Greater Sudbury, 2005-2009 average
| ED Visits, Mental Health Episodes | Least Deprived | Neutral | Most Deprived |
|---|---|---|---|
| ED Visits per 100 000 Population Per Year | 31.7 | 48.8 | 139.7 |
| Lower Confidence Interval | 7.2 | 34.2 | 93.4 |
| Upper Confidence Interval | 56.2 | 63.5 | 185.9 |
The age-standardized rate of emergency department visits for mental health episodes increases significantly with increasing levels of deprivation. The rate among residents in Greater Sudbury’s most deprived areas was 140 visits per 100,000 population per year, or 4.4 times higher than that for residents of the City’s least deprived areas (32 per 100,000).
Health opportunity: If everyone in the City of Greater Sudbury enjoyed the same opportunities for well-being as those within the least deprived group, each year there would be 46 (51%) fewer emergency department visits for mental health episodes in the City.
15. Mental health episodes hospitalizations
The mental health episodes hospitalization rate is a measure of how many Greater Sudbury residents were discharged from a hospital for mental health episodes between 2005 and 2009. The rate is presented per 100,000 residents in the City, by level of deprivation.
Figure 18. Age-standardized rate of mental health episodes hospitalizations, by deprivation index category, City of Greater Sudbury, 2005-2009 average
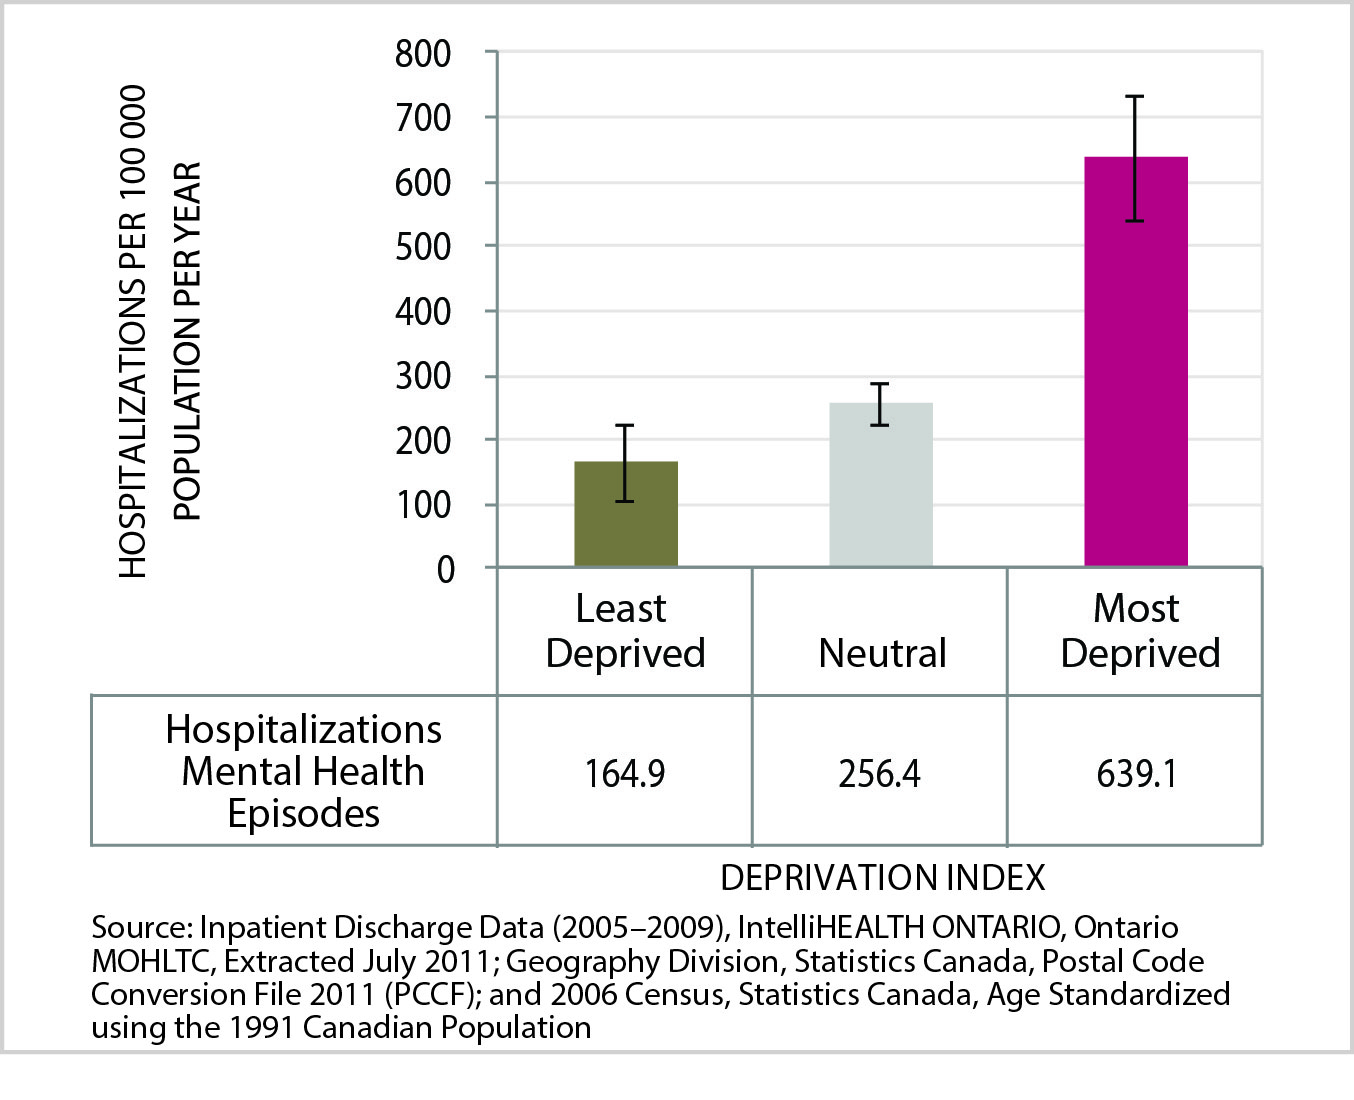
Data Table for Figure 18. Age-standardized rate of mental health episodes hospitalizations, by deprivation index category, City of Greater Sudbury, 2005-2009 average
| Hospitalizations Mental Health Episodes | Least Deprived | Neutral | Most Deprived |
|---|---|---|---|
| Hospitalizations per 100 000 Population Per Year | 164.9 | 256.4 | 639.1 |
| Lower Confidence Interval | 107.4 | 224.4 | 541.8 |
| Upper Confidence Interval | 222.5 | 288.4 | 736.3 |
The age-standardized rate of hospitalization for mental health episodes increases significantly with increasing levels of deprivation. The rate among residents in Greater Sudbury’s most deprived areas was 639 hospitalizations per 100,000 population per year, or 3.9 times higher than that for residents in the City’s least deprived areas (165 per 100,000).
Health opportunity: If everyone in the City of Greater Sudbury enjoyed the same opportunities for well-being as those within the least deprived group, each year there would be 264 (54%) fewer hospitalizations for mental health episodes in the City.
Discussion
Overall results
This report describes 15 health indicators of general health, maternal and child health, chronic disease and injuries, health service utilization, and mental health where statistically significant differences were found between areas of low and high deprivation across the City of Greater Sudbury. For the 27 additional health indicators studied, no statistically significant differences were found.
Of the 15 health indicators with significant findings, 14 demonstrated a gradient in health outcomes related to deprivation. The pattern for the remaining indicator, the rate of hospitalizations due to injury and poisoning, did not show a consistent increase between all levels of deprivation. However, the hospitalization rate was higher in the most deprived areas compared to the least deprived areas.
Overall, for the health indicators that displayed a socio-economic gradient, people in the most deprived areas had the worst health while health improved as the degree of deprivation decreased. Factors that are protective for health showed a similar gradient. For example, those living in areas with the highest deprivation were less likely to have regular access to a medical doctor or to rate their health as excellent or very good.
Some of the most dramatic differences by level of deprivation include:
- The infant mortality rate in Greater Sudbury’s most deprived areas was 2.4 times (or 139%) higher than that for infants in the City’s least deprived areas.
- The annual age-standardized rate of emergency department visits for mental health episodes in Greater Sudbury’s most deprived areas was 4.4 times (or 341%) higher than that for residents in the least deprived areas.
- The age-standardized prevalence rate of obesity among residents of the City of Greater Sudbury’s most deprived areas was 2.0 times (or 102%) higher than that for residents of the City’s least deprived areas.
The report reveals untapped health potential in Greater Sudbury. Using this report’s analytical approach, if everyone in the City of Greater Sudbury experienced the same opportunities for health as those in the least deprived areas, each year there would be:
- 14,077 fewer emergency department visits for all causes in the City
- 1,783 fewer hospitalizations for all causes in the City
- 9,706 more people in the City who rate their health as excellent or very good
- 1 less infant death
The significant findings are consistent with a growing body of literature that detects health inequities from social and economic determinants of health at individual and area levels. In 2008, the Canadian Institute for Health Information performed a similar analysis using the INSPQ Deprivation Index and methodology to assess health outcomes across 15 Canadian urban census metropolitan areas (CMAs). 32 The study confirmed inequities in 21 self-reported health and hospitalization indicators within and across the 15 CMAs. Other Canadian local public health agencies, including Toronto, Region of Peel, Winnipeg, and Saskatoon, have conducted comparable local analyses of health outcomes; each of these corroborates differences in health based on levels of social and economic status.33
Although this report highlights health inequities between areas with different levels of deprivation, it does not capture the resilience, strengths, and opportunities for health available in our community. The patterns revealed in Opportunity for All are one aspect of the conditions that impact health across the City.
Interpreting the results
This study found that out of 42 indicators examined, there were 15 statistically significant relationships between area level deprivation and health. Although some inequities were revealed and discussed in this report, the lack of significant findings in other health domains can be due to many possibilities. The non-significant results could be false and could be influenced by technical aspects of the study methodology. Some Dissemination Areas within the City of Greater Sudbury are known to include heterogeneous populations, with very variable socio-economic characteristics. The variability within DAs may have lessened the apparent impact of deprivation on a health outcome. In addition, some of the City of Greater Sudbury’s potentially most deprived areas were excluded from the analysis because of a lack of long-form census information on socio-economic data. The absence of this data could have decreased our ability to detect significant findings.
In contrast, if the non-significant findings are indeed true, many possible explanations exist. The City of Greater Sudbury could be less socio-economically polarized than other cities that have been analyzed with the Deprivation Index. Less difference between the extremes in socio-economic circumstances across the City would tend to decrease the likelihood of finding health inequities. For example, the historical availability of high-paid work in the resource sector has flattened some social gradients that would be expected with lower levels of education. Similarly, if the City of Greater Sudbury offers more supports to mitigate the negative health impacts that can occur due to lower socio-economic status, then less health inequities can result. The non-significant findings may underscore the health opportunity for all that is achievable in the City of Greater Sudbury.
Discussions with Sudbury & District Health Unit staff and community partners conveyed thoughtful perspectives on the complex factors and community characteristics that contribute to health in the City of Greater Sudbury. The insights offered by community and staff informants reinforce that the findings of this report should be understood with appreciation of the diversity of our community (including differences in culture and basic living condition of residents). For example, during the December 2012 consultation forum, community members noted that with cultural differences in attitudes to early motherhood, births to teenage mothers may not always be viewed as a negative health outcome. For those with income instability, obesity may be connected to “binge eating” at times when money is available, followed by food shortage and insecurity.
Another theme raised during consultation included the role access to services plays in achieving health outcomes. Higher hospitalization rates within areas of lower socio-economic status may be influenced by limited access to health promotion, prevention and treatment services. This has been demonstrated by a Canadian study, which found a clear gradient in health service usage from richest to poorest neighbourhoods. The study uncovered that the average cost of providing health services to the poorest quintile was approximately 50% higher than the richest quintile. 34 Similarly, health service utilization due to mental health episodes may reflect actual differences in mental health status between residents of lower and higher areas of deprivation. It may also indicate that residents of more deprived areas have less access to mental health promotion and support services.
The interdependence of deprivation and mental health was raised by consultation participants. The social and economic conditions where someone lives influence mental health and well-being. Furthermore, poor mental health may limit one’s ability to maintain regular employment and secure a steady income. These factors also contribute to where someone can reside. A 2005 U.S. study found that the physical characteristics of neighbourhoods were associated with residents’ likelihood of depression. Individuals who lived in neighbourhoods with poorer features of the built environment were more likely to report depression than those living in neighbourhoods with a better quality physical environment.35
Finally, consultation participants associated injury rates (and associated hospitalizations and emergency department visits) with influences from the built environment. They named physical characteristics of communities, such as availability of play spaces, sidewalks, and presence of abandoned structures as contributors to the safety of spaces that can affect injury risk. Consistent with that perception, a 2005 Canadian study found that parents and caregivers in lower socio-economic status neighbourhoods were three times less likely than those in higher socio-economic neighbourhoods to perceive that their neighbourhood had access to safe play spaces.36
Limitations
The use of a single index to describe an area’s socio-economic status greatly simplifies the analysis and interpretation of results. The use of more sophisticated analytical methods and the inclusion of more determinants of health beyond those incorporated in the Deprivation Index could permit a more complex description of population health and social and material deprivation.
Within a single category of deprivation differences will exist in income, education, social support, and other factors that affect the health status of each individual within the category. Thus, observations of relationships between deprivation and health made at the population level cannot be assumed to describe the relationships of those factors for a particular individual in the population. Similarly, this analysis uses categories of geographic areas called Dissemination Areas to determine the groups that were separated by deprivation. A wide range of household income levels were observed within some Dissemination Areas of Greater Sudbury. This variation means that we may not have been able to characterize material deprivation very accurately; therefore, the relationship between deprivation and health outcomes may have been underestimated. A more detailed discussion of limitations is found in Appendix E.
Conclusions
Fifteen health indicators presented in this report show a relationship between health and socio-economic status. For 14 of these indicators, people in the most deprived areas had the worst health, and health improved as the degree of deprivation decreased. There are a number of ways to understand the impact of these relationships including the lost opportunity for better health of all residents when a gradient in health exists. The findings of this report resonate with international and national studies that have revealed similar relationships between the social determinants of health, health inequities, and population health status.37
There is still work to be done to understand the path to health equity and reduce the health disparities described for Greater Sudbury. Opportunity for All provides local data to help inform the necessary community dialogue to do this work. There is much potential for productive discussion about what we can do to mitigate the disparities.
Notably, consultation with community members cited community factors that can “buffer” health inequities. For example, Greater Sudbury has a long history of individual and agency collaboration in support of early childhood development and food security. It was suggested in our consultations that strong community resources and neighbourhood-based supports explain some of the findings of no significant differences between residents of more and less deprived areas, (for example, low birth weight and breastfeeding rates). The indicators of health in the City of Greater Sudbury that do not show a socio-economic gradient reinforce that inequities are modifiable. They should be explored further to understand the lessons that can be learned about the potential for community action to enhance opportunities for all.
The Sudbury & District Health Unit remains committed to implementing locally based public health activities to fulfill its Health Equity Vision — 2020. It remains committed to working with community partners from many sectors to share information, experiences, and perspectives to better understand and influence community wellbeing.
Greater Sudbury has many assets and a long history of mobilizing its strengths to recognize and respond to inequities such as those revealed in this report. With informed, creative and concerted action to improve the public’s health, no one in our community needs to be at risk of poor health solely due to the social and economic environments in which they live. The health inequities described in this report are not inevitable — together we can build a community in which there is opportunity for all.
Endnotes
1 World Health Organization (2008)
2 Kawachi et al. (2002)
3 Whitehead & Dahlgren (2006)
4 http://www.who.int/social_determinants/thecommission/finalreport/en/index.html
5 Senate Subcommittee on Population Health (2009)
6 Toronto Public Health (2008); Lemstra & Neudorf (2008); Winnipeg Regional Health Authority (2010); Region of Peel Public Health (2011)
7 Ontario: MOHLTC (2011)
8 Pampalon et al. (2009)
9 Mackenback et al. (2003)
10 Guildea et al. (2001)
11 Wilkins et al. (2002)
12 Community Action Program for Children/Canadian Prenatal Nutrition Program (2007).
13 Chen et al. (2007)
14 Smith & Elander (2006)
15 Broemeling et al. (2008)
16 CIHI (2010)
17 Public Health Agency of Canada (2012)
18 Smartrisk (2006)
19 Public Health Agency of Canada (2009)
20 Peden et al (2008)
21 Faelker et al. (2000); Peden et al (2008)
22 Chen et al 2013
23 Peden et al. (2008)
24 CIHI (2010)
25 CIHI (2010), Burrows et al. (2012)
26 Doorfman & Wallack (2007)
27 Region of Peel Public Health (2011)
28 CIHI (2008)
29 Region of Peel Public Health (2011)
30 Horwitz & Shield (1999)
31 Melzer et al (2004)
32 CIHI (2008)
33 Toronto Public Health (2008); Peel Region Public Health (2011); Winnipeg Regional Health Authority (2010); Lemstra M, Neudorf C. (2008)
34 Glazier et al. (2000)
35 Galea et al. (2005)
36 Oliver & Hayes (2005)
37 Lemstra & Neudorf (2008); CIHI (2008); Toronto Public Health (2008); Region of Peel Public Health (2011)
38 CIHI (2001)
39 Statistics Canada, (2009)
40 Pampalon et al. (2009)
41 Last (2006)
42 Last (2006)
43 Statistics Canada (2009)
44 Young (1998)
45 Pagano & Gauvreau (2000)
46 Heeringa et al. (2010)
47 StataCorp (2011)
References
Bonell, C.P., Strange, V.J., Stephenson, J.M., Oakley, A.R., Copas, A.J., Forrest, S.P., Black, S. (2003). Effect of social exclusion on the risk of teenage pregnancy: development of hypotheses using baseline data from randomized trial of sex education. Journal of Epidemiology of Community Health, 57, 871–876.
Broemeling, A., Watson, D.E., & Prebtani, F. (2008). Population patterns of chronic health conditions, co-morbidity and healthcare use in Canada: implications for policy and practice. Healthcare Quarterly, 11, 70–76.
Burrows, S. Augera,N., Gamacheb P.,Hamelb D., (2012) Individual and area socioeconomic inequalities in cause-specific unintentional injury mortality: 11-Year follow-up study of 2.7 million Canadians. Accident Analysis and Prevention, 45, 99– 106.
Canadian Institute of Health Information (2010). Analysis in Brief: Injury Hospitalizations and Socio-Economic Status. Ottawa, ON: CIHI. Retrieved from: https://secure.cihi.ca/free_products/Injury_aib_vE4CCF_v3_en.pdf.
Canadian Institute for Health Information. (2008). Canadians in lower socio-economic groups more likely to be hospitalized for mental illness, child asthma. Retrieved from: http://www.cihi.ca/CIHI-ext-portal/internet/en/Document/factors+influencing+health/socioeconomic/RELEASE_24NOV08.
Canadian Institute of Health Information (2009). International Statistical Classification of Diseases and Related Health Problems, 10th Revision. Canada (ICD-10-CA). Ottawa, ON: CIHI.
Canadian Institute for Health Information. (2008). Reducing Gaps in Health: A Focus on Socio-Economic Status in Urban Canada: Ottawa, ON.
Caspi, A., Taylor, A., Moffitt, T.E., & Plomin, R. (2000). Neighborhood deprivation affects children’s mental health: environmental risks identified in a genetic design. Psychological Science, 11, 338–342.
Chen, X. K., Wen, S. W., Fleming, N., Demissie, K., Rhoads, G. G., & Walker, M. (2007). Teenage pregnancy and adverse birth outcomes: a large population based retrospective cohort study. International Journal of Epidemiology, 36, 368–373.
Chen, Y., Mo, F., Li, Q.L., Yiang, Y, Mao, Y. (2013) Unintentional injury mortality and external causes in Canada from 2001 to 2007. Chronic Diseases and Injuries in
Canada, 33, 95–102.
Community Action Program for Children/Canadian Prenatal Nutrition Program. (2007). On the move: Mobilizing community and engaging youth to reduce rates of teen pregnancy in Canada. Ottawa: CAPC/CPNC.
Doorfman, L., & Wallack, L. (2007). Moving nutrition upstream: the case for reframing obesity. Journal of Nutrition Education and Behavior, 39, S45–S50.
Doubeni, C.A., Schootman, M., Major, J.M., Torres Stone, R.A., Laiyemo, A.O., Park, Y. Schatzkin, A. (2012). Health status, neighborhood socioeconomic context, and premature mortality in the Unites States: The National Institutes of Health—AARP diet and health study. American Journal of Public Health, 102, 680–688.
Faelker, T., Pickett, W., & Brison, R.J. (2000). Socioeconomic differences in childhood injury: a population based epidemiologic study in Ontario, Canada. Injury Prevention, 6, 203–208.
Galea, S., Ahern, J., Rudenstine, S., Wallace, Z., & Vlahov, D. (2005). Urban Built Environment and Depression: A Multilevel Analysis. Journal of Epidemiology and Community Health, 59, 822–827.
Glazier, R.H., Badley, E.M., Gilbert, J.E., & Rothman, L. (2000). The Nature of Increased Hospital Use in Poor Neighbourhoods: Findings From a Canadian Inner City. Canadian Journal of Public Health, 91,268–273.
Guildea, Z.E.S., Fone, D.L., Dunstan, F.D., Sibert, J.R., & Cartilidge, P.H.T. (2001). Social deprivation and the causes of stillbirth and infant mortality. Archives of Disease in Childhood, 84, 307–310.
Heeringa, S.G., West, B.T., & Berglund, P.A. (2010). Applied survey data analysis. Boca Raton, FL: Chapman & Hall/CRC.
Horwitz, A.V., & Shied, T.L. (1999). A handbook for the study of mental health: social contexts, theories and systems. New York: Cambridge University Press.
Kawachi, I., Subramanian, S., & Almeida-Filho, N. (2002). A glossary for health inequalities. Journal of Epidemiology Community Health, 55, 647–652.
Kowaleski-Jones, L., & Duniform, R. (2006). Family Structure and Community Context: Evaluating Influences on Adolescent Outcomes. Young & Society, 38, 110–130.
Lahelma, E., Martikainen, P., Laaksonen, M., & Aittomaki, A. (2004). Pathways between socioeconomic determinants of health. Journal of Epidemiology Community Health, 58, 327–332.
Last, J.M. (2001). A dictionary of epidemiology (4th Eds.). New York, NY: Oxford University Press.
Lemstra, M., & Neudorf, C. (2008). Health disparity in Saskatoon: analysis to intervention. Saskatoon. Retrieved from: http://www.saskatoonhealthregion.ca/your_health/documents/PHO/HealthDisparityRept-complete.pdf.
Mackenbach, J.P., Bos, V., Andersen, O., Cardano, M., Costa, G., Harding, S., Reid, A., Kunst, A.E. (2003). Widening socioeconomic inequalities in mortality in six Western European countries. International Journal of Epidemiology, 32, 830–837.
McLeod, A. (2001). Changing patterns of teenage pregnancy: population based study of small areas. BMJ, 323, 199–203.
Melzer, D., Fryers T., Jenkins R. (eds), Social Inequalities and Distribution of Common Mental Disorders, Hove: Psychology Press Ltd, 2004.
Norman, P., Boyle, P., Exeter, D., Feng, Z., & Popham, F. (2011). Rising premature mortality in the UK’s persistently deprived areas: only a Scottish phenomenon?. Social Science & Medicine, 73, 1575–1584.
Oliver, L.N., & Hayes, M.V. (2005). Neighbourhood socio-economic status and the prevalence of overweight Canadian children and youth. Canadian Journal of Public
Health, 96, 415–420.
Ontario, Ministry of Health and Long-Term Care. (2011). Health, not health care – Changing the conversation. 2010 Annual Report of the Chief Medical Officer of Health of Ontario to the Legislative Assembly of Ontario, by Dr. Arlene King. Toronto, ON: Ministry of Health and Long-Term Care.
Pampalon, R.M., Hamel, D., Gamache, P., & Raymond, G. (2009). A deprivation index for health planning in Canada. Chronic Diseases in Canada, 29, 178–191.
Pagano, M., & Gauvreau, K. (2000). Principles of biostatics (2nd Eds.). Pacific Grove, CA: Brooks/Cole.
Peden, M. et al. (2008) World report on child injury prevention. Geneva: World Health Organization. Retrieved from: http://whqlibdoc.who.int/publications/2008/9789241563574_eng.pdf.
Public Health Agency of Canada. (2009). Child and youth injury in review, 2009 Edition – Spotlight on consumer product safety. Ottawa, ON: Public Health Agency of Canada. Retrieved from: http://www.phac-aspc.gc.ca/publicat/cyi-bej/2009/index-eng.php.
Public Health Agency of Canada Steering Committee on Health-Adjusted Life Expectancy. (2012) Health-Adjusted Life Expectancy in Canada: 2012 Report by the Public Health Agency of Canada. Ottawa, ON: Public Health Agency of Canada.
Region of Peel Public Health. (2011). Health in Peel: determinants and disparities 2011. Retrieved from: http://www.peelregion.ca/health/health-status-report/determinants/pdf/MOH-0036_Determinants_final.pdf.
Rudd Centre for Food Policy and Obesity, Yale University. (2008). Access to Healthy Foods in Low Income Neighbourhoods: Opportunities for Public Policy. Retrieved from: http://www.yaleruddcenter.org/resources/upload/docs/what/reports/RuddReportAccesstoHealthyFoods2008.pdf.
Senate Subcommittee on Population Health. (2009). A Healthy, Productive Canada: A Determinant of Health Approach. Final Report of the Subcommittee on Population Health of the Standing Committee on Social Affairs, Science and Technology. Ottawa, ON: The Senate of Canada. Retrieved from: http://www.phn-rsp.ca/pubs/ssphfr-rfscssp/pdf/ssphfr-rfscssp-2009-10-eng.pdf.
Smith, D.M., & Elander, J. (2006). Effects of area and family deprivation on risk factors for teenage pregnancy among 13-15-year-old girls. Psychology, Health & Medicine, 11, 399–410.
SMARTRISK. (2006). The Economic Burden of Injury in Ontario. Toronto: SMARTRISK. Retrieved from: http://www.smartrisk.ca/downloads/burden/EBI-Ont-2006.pdf.
StataCorp. (2011). Stata statistical software: release 12. College Station, TX: StataCorp LP.
Statistics Canada. (2010). Postal code conversion file, October 2010 release. Ottawa, ON: Statistics Canada.
Toronto Public Health. (2008). The Unequal City: Income and Health Inequalities in Toronto, 2008. Retrieved from: http://www.toronto.ca/health/map/pdf/unequalcity_20081016.pdf.
Whitehead, M., & Dahlgren, G. (2006). Levelling Up, Part 1: Concepts and principles for tackling social inequalities in health.Copenhagen: World Health Organization.
Wilkins, R., Berthelot, J.M., & Ng, E. (2002). Trends in Mortality by Neighbourhood Income in Urban Canada from 1971 to 1996. Health Reports, 13, 45–71.
Winnipeg Regional Health Authority. (2010). Community health assessment 2009/2010. Winnipeg, MB: WRHA Research & Evaluation Unit. Retrieved from http://www.wrha.mb.ca/research/cha2009/index.php.
World Health Organization. (2008). Social determinants of health. Key concepts. World Health Organization home page. Retrieved from: http://www.who.int/social_determinants/thecommission/finalreport/key_concepts/en/index.html.
Young, T.K. (1998). Population health: concepts and methods. New York, NY: Oxford University Press.
Appendix A
Health outcomes and risk factors examined by deprivation level
The next two tables display the variables examined for relationships between health and area level deprivation. The indicators that did not display a statistically significant socio-economic gradient are listed in Table A2.
Table A1. Health indicators in most deprived areas where differences are statistically significant
| HEALTH INDICATORS | LEVEL IN MOST DEPRIVED AREAS RELATIVE TO LEAST DEPRIVED AREAS |
| 1. Self-rated health (excellent /very good) | 20% lower or 0.2 times lower |
| 2. Premature mortality (dying before age 75) | 86% higher or 1.9 times higher |
| 3. Infant mortality | 139% higher or 2.4 times higher |
| 4. Teen births (% of all live births born to adolescent mothers) | 205% higher or 3.1 times higher |
| 5. Injury and poisoning emergency department (ED) visits |
44% higher or 1.4 times higher |
| 6. Injury and poisoning ED visits (children and youth) | 25% higher or 1.3 times higher |
| 7. Injury and poisoning hospitalizations | 24% higher or 1.2 times higher |
| 8. Obesity | 102% higher or 2.0 times higher |
| 9. ED visits (all causes) | 71% higher or 1.7 times higher |
| 10. Hospitalizations (all causes) | 20% higher or 1.2 times higher |
| 11. Access to a regular medical doctor | 11% lower or 0.1 times lower |
| 12. Intentional self-harm ED visits | 226% higher or 3.3 times higher |
| 13. Intentional self-harm hospitalizations | 242% higher or 3.4 times higher |
| 14. Mental health episodes ED visits | 341% higher or 4.4 times higher |
| 15. Mental health episodes hospitalizations | 288% higher or 3.9 times higher |
Table A2. Health indicators where no statistically significant difference was found between most and least deprived areas
| CHRONIC DISEASE |
| 1. Asthma |
| 2. Cardiovascular disease mortality |
| 3. Cancer |
| 4. Cancer mortality |
| 5. Diabetes |
| 6. Heart disease |
| 7. Respiratory diseases |
| INJURIES |
| 8. Falls ED visits (seniors) |
| 9. Falls hospitalizations (seniors) |
| 10. Injuries and poisoning hospitalizations (children) |
| 11. Injuries and poisoning mortality |
| 12. Intentional self-harm mortality |
| MATERNAL AND CHILD HEALTH |
| 13. Breastfeeding |
| 14. Low birth weight |
| 15. Perinatal mortality |
| Screening and Immunization |
| 16. Breast screening |
| 17. Cervical screening |
| 18. Colorectal screening |
| 19. High blood pressure |
| 20. Influenza Immunization |
| HEALTH BEHAVIOURS |
| 21. Alcohol (heavy alcohol use) |
| 22. Nutrition (fruit and vegetable consumption per Canada Food Guide) |
| 23. Overweight or obese (combined) |
| 24. Physical activity |
| 25. Tobacco (daily or occasional smoking) |
| GENERAL HEALTH |
| 26. Self-rated mental health (very good/excellent) |
| 27. Sense of community belonging (very/somewhat strong) |
Appendix B
Data sources
Overview
The analyses presented in this report combine numerous data sources, calculations and statistical procedures, as illustrated in Figure B1.
Figure B1. Graphical representation of data, sources, linkages and analyses
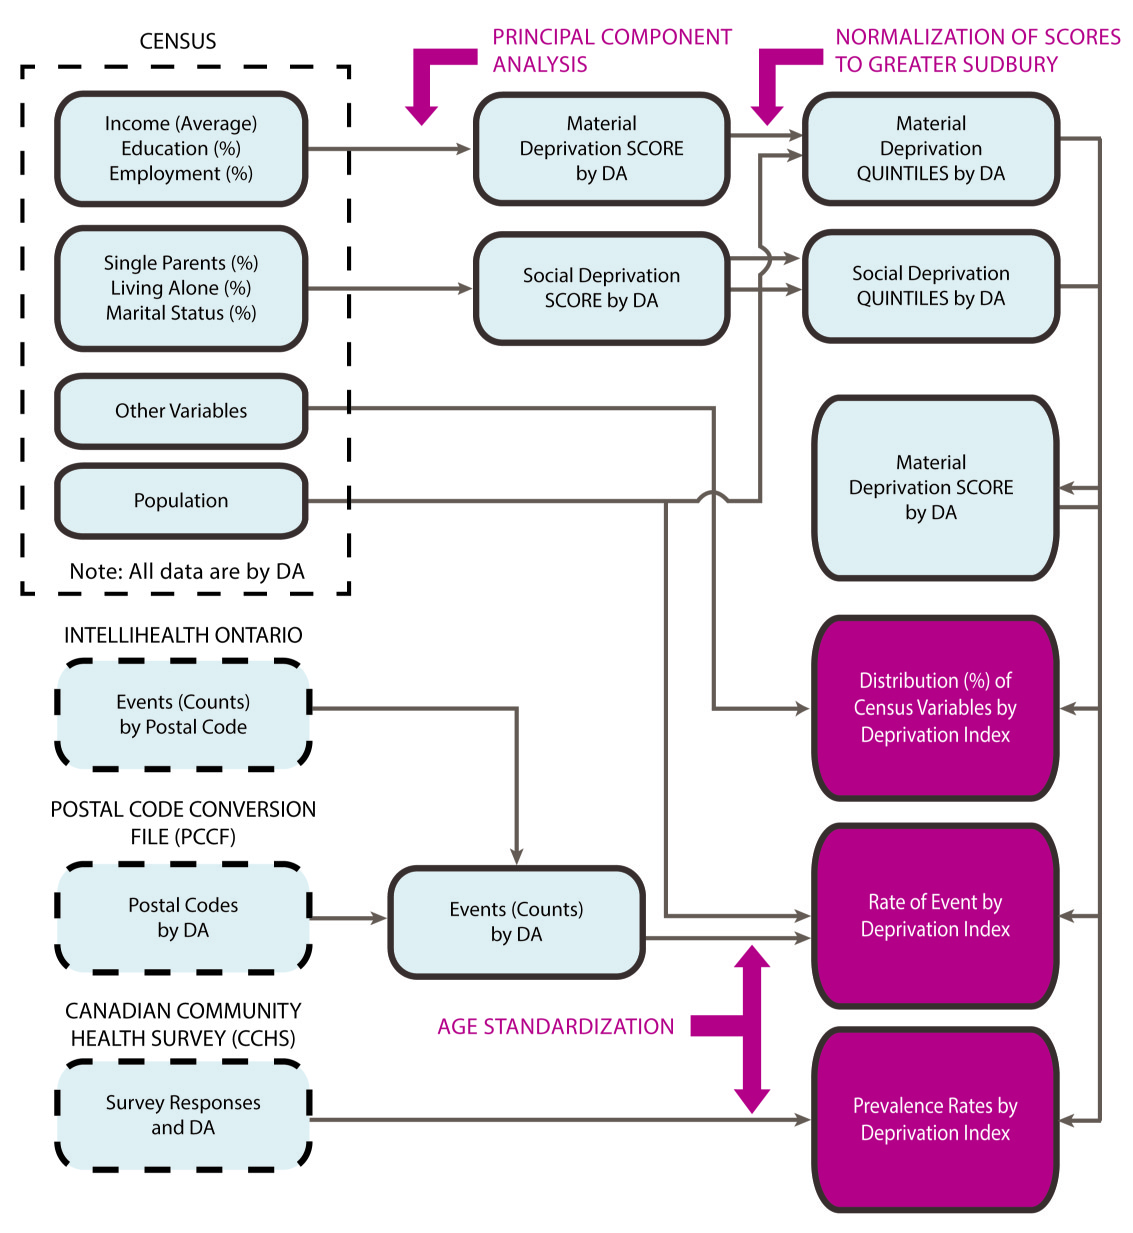
The following data sources have been used in the analyses found in this report.
The Canadian Community Health Survey (CCHS) is a national survey of individuals aged 12 years and older conducted by Statistics Canada. The CCHS provides prevalence estimates related to health status, risk factors, and health care system use within 126 health regions in Canada. The CCHS sample excludes individuals living on Indian reserves, Canadian Forces bases, and some remote areas. Households were randomly selected, as were individuals within those households (one per household). CCHS data shares limitations with similar telephone surveys that ask participants to answer questions about themselves. CCHS data are limited by an under-representation of individuals without phones. Respondents may answer questions inaccurately or desire to respond in a socially acceptable way.
In this report, estimates based on CCHS data from the Sudbury & District Health Unit area are used to approximate the estimates for the City Greater Sudbury. The data used was collected between 2005 and 2010, with a total sample for Greater Sudbury of 3,079 respondents.
The Canadian Census is conducted by Statistics Canada every five years to provide a reliable source for describing the characteristics of Canada’s people, dwellings and agricultural operations. The census provides population and dwelling estimates, as well as the demographic and socio-economic characteristics, for Canada, the Provinces and Territories, and numerous smaller regions. The analyses in this report use data from the 2006 Census (collected in May, 2006).
IntelliHEALTH ONTARIOis an Internet-based data portal managed by the Ontario Ministry of Health and Long-Term Care. It provides access to numerous data sources used in this report, including:
- Data on emergency department (ED) visits from the
National Ambulatory Care Reporting System (NACRS), produced by the Canadian Institute of Health Information (CIHI) - Data on hospital separations (stillbirths, in-hospital deaths, and discharges) contained within CIHI’s
Discharge Abstract Database (DAD) - Vital statistics data (live births, stillbirths, and deaths) from the Office of the Ontario Registrar general
These data are coded based on the place of residence of the person in question, rather than on the location where the event occurred. The data may be limited by errors or biases in the coding of data, especially on the diagnosis or cause of death. The database does not contain records for Ontarians who visited an ED, were hospitalized or died outside of the province.
NACRS, DAD and vital statistics data related to specific events (for example, cardiovascular disease) are classified according to the Canadian Enhancement of the International Classification of Disease, Tenth Revision(ICD-10CA).38 These are a set of standard codes that represent all disease, illnesses, and injuries. The Classification was originally published by the World Health Organization and then adapted to the Canadian environment.
The Postal Code Conversion File (PCCF) links postal codes to census geographic units, including dissemination areas (DAs).39 In instances where it was possible to map the postal code to multiple DAs, assignment was based on the single link indicator, (which denotes the region in which the individual is most likely to reside, based upon the population distribution).
Consultation with representatives from many sectors such as education, health care, and social services contributed to the interpretation of the report findings. Preliminary findings were shared at a community event hosted by Sudbury & District Health Unit in December 2012. Participants were asked questions about the meaning of the results, what could be contributing to the health outcomes and which strengths in the City of Greater Sudbury could be protective of health. The list of invited agencies is presented in Appendix F.
Appendix C
Socio-economic status of neighbourhoods — the deprivation index
All analyses presented in this report compare rates of outcomes or conditions among residents of geographic areas that are grouped by levels of the Deprivation Index. The Deprivation Index is a composite measure of neighbourhood-level socio-economic status developed by the Institut national de santé publique du Québec (INSPQ). It has material and social components, each of which is derived from three variables in the 2006 Canadian Census. Geographic areas are assigned a material deprivation score using a principal components analysis (PCA) based upon:
- the percentage of residents without a high-school diploma
- the percentage of residents who are employed
- the average (mean) income (in 2005) of residents
Similarly, the areas are assigned a social deprivation score using PCA based upon:
- the percentage of families that are single-parent families
- the percentage of residents who are living alone
- the percentage of residents who are separated, divorced or widowed40
Raw material and social deprivation scores were obtained for dissemination areas (DAs) in the Greater Sudbury Census Subdivision. Local DAs were then grouped into quintiles on the basis of their material and social deprivation scores, with the first quintile representing the 20% of local DAs with the highest scores (i.e. lowest deprivation).
Finally, DAs were reclassified into three groups, representing high, moderate, and low socio-economic status, on the basis of the material and social deprivation index quintiles, as illustrated in Figure C1.
Appendix D
Calculation of rates, confidence intervals and statistical significance
Calculation of rates
A rate is a measure of the frequency of occurrence of an event or condition. It has three components:
- The number of events that occurred
- The population at risk for the event
- A measure of time (usually a year)
The rate is often multiplied by a larger number (usually 100,000) to make it easier to understand. An example of a rate in this report is 52 deaths per 100,000 population per year. The benefit of using rates, rather than the number of cases of a disease that have occurred, is that it allows comparison of the experience of different populations.41 Many different types of rates are presented in this report.
Incidence rates
An incidence rate is a measure of the frequency of new occurrences of the event in a given time period.42 This report presents three specific types of incidence rates, which differ by the event being described:
- emergency department visits rates
- hospitalization rates
- mortality (i.e. death) rates
These rates can be calculated for a specific cause of illness (for example, cardiovascular disease) or for all causes combined. For all rates, data from multiple (i.e. 5 or 10) years have been combined to increase the stability of the estimate. Records of each event occurring in that period were geocoded to a particular census dissemination area (DA) by their postal code, using the postal code conversion file (PCCF).43 Each DA also had a population estimate from the 2006 Census and was been assigned a deprivation index category (i.e. low, moderate, high), as described previously. The DAs were combined into deprivation groups, and the event counts and population estimates summed. Crude rates of the event were then calculated for each deprivation group as follows:

Years is the length of period from which data was drawn in years, and 10n is a multiple of 10, usually 100,000.
Prevalence rates
A prevalence rate provides information on the number of cases of a disease or condition that existed within the population at a particular time. This is usually presented as a percentage of the population. “Twenty-four percent of SDHU area residents aged 12 years and over are current smokers” is an example of a prevalence rate. In this report, prevalence rates are calculated using data from both the 2006 Canadian Census and the 2007-2008 Canadian Community Health Survey (CCHS) as follows:

Weighted refers to the fact that survey weights were applied to the CCHS data to ensure that information obtained from the survey sample is representative of the full target population in which the analyst is interested; (see Heeringa et al for information on survey data analysis).
Prevalence estimates were calculated for each deprivation group category by first assigning a deprivation category to each DA for which census data was available — or to each respondent in the CCHS survey sample, on the basis of their DA — and then aggregating the data by those categories.
Age standardization of rates
It is possible that a greater proportion of the population living under conditions of high deprivation are older, given that older individuals may be more likely to have lower incomes, to be separated, divorced or widowed, and hence to live alone. Older individuals also tend to have higher rates of certain conditions or health outcomes being studied in this report. For this reason, a finding of higher rates of the outcome among residents of areas with greater deprivation may simply reflect the fact that they are older.
Therefore, comparisons between populations are often made on the basis of age-standardized rates. These rates have been adjusted statistically for any differences in the age structure of the underlying population, as follows:

Eventsi represents the number of events in the ith age group (usually a five-year age group), Populationi represents the population of that age group, and Standardi represents the population of that age group within some standard population, which in this report is the 1991 Canadian Population.
Standardized rates are not intended to provide an estimate of the true rate within each group. Rather, they reflect the rate that would have resulted had the observed rates within each age group in the current populations (groups) been experienced by the standard population. Because the age structures of the groups are removed from consideration, comparisons of the age-standardized rates are likely a better reflection of the possible effects of deprivation.
Rates and measures related to infant health
Other types of rates and measures were used in this report when reporting on indicators related to the health of infants. This is because the denominator of such rates/measures is typically the number of births occurring within the geographic area, not the population of that area. They were calculated as follows:


Calculation of “health potential”
The measure reported as “health potential” in this report is commonly referred to the population attributable risk (or fraction) in the scientific literature. It is an estimate of the proportion of cases of the illness/condition that would be prevented if the exposure in question was eliminated. In this report, the exposure in question is moderate to high levels of deprivation.
The population attributable fraction (PAF) is calculated as follows:

Where Pe is the prevalence of the exposure within the population, and RR is a ratio of rates of illness between the exposed and unexposed population, i.e.


The number of cases that would be prevented is equal to the product of the RR and the total number of cases that occur annually. For most indicators, the total number of cases was known from the data. For indicators derived from Canadian Community Health Survey (CCHS) data, the total number of cases was estimated by multiplying the estimated prevalence of the health condition by a population estimate for the City of Greater Sudbury taken from the 2006 Census.
Calculation of confidence intervals and statistical significance
It is important to acknowledge that the results presented in this report are estimates of the true rates of the outcome and conditions within the population. This is especially true for estimates from the Canadian Community Health Survey (CCHS), which might have changed if different people had been selected to participate in the survey. Therefore, when making comparisons it is important to account for the potential for observed differences between deprivation groups to have arisen solely due to chance, rather than any true difference between the groups being compared. This is achieved through the presentation of confidence intervals and the statistical significance of differences.
Confidence intervals are like the “margin of error” that accompanies the results of most surveys. They are an indication of how the result may change if the analysis was repeated numerous times but with data on different people from within the same population. The upper and lower limits of the interval denote the range one might expect in the estimate in 95% of these repetitions. Note that in 5% of trials, the estimate would lie outside this range.
The results for two populations can be compared based on their confidence intervals. If the intervals of the two groups do not overlap, then the difference observed between those two groups is said to be statistically significant (i.e. there is less than a 5% chance that the difference is due to chance.) When an overlap does exist, then the observed difference is not statistically significant, and one cannot conclude that it is not due to chance. The degree of overlap is important. Cases must be further analyzed to reach a conclusion regarding statistical significance if the confidence intervals overlap, but neither interval includes the point estimate for the other group.
In this report, the confidence intervals for rates, standardized rates and means, as well as differences between them, are calculated as described in Young.44 The calculation of confidence intervals for proportions and ratios follows Pagano and Gauvreau.45
The confidence intervals for CCHS prevalence estimates, and the differences between them, were calculated using bootstrapping procedures in STATA 1247 using bootstrap weights provided by Statistics Canada, and following procedures described by Heeringa.46, 47
A test of statistical significance was conducted to confirm that there is a statistically significant difference between values for least and most deprived areas. When confidence intervals overlapped between deprivation categories, a second test was performed to confirm if there was a statistically significant difference (for example, this occurred with the infant mortality results).
Appendix E
Limitations
The results of this analysis may be affected by potential limitations in the methodology.
Limitations of deprivation indices
The INSPQ Deprivation Index is one of many available indices to describe neighbourhood-level socio-economic status. The six census variables comprising this specific index were selected based on analyses at the national level. Deprivation scores were ranked considering data from all of Ontario. It is possible that a choice to use a different index comprised of different factors, or to derive a new index or new scores based on analyses of local data, would have led to different categorization of local Dissemination Areas in terms of their level of deprivation. However, due to the correlation of many of the factors that comprise most indices, the choice of index is unlikely to be a large source of error.
The use of a single index to describe an area’s socio-economic status simplifies the analysis and interpretation of results. The determination of population health is not simple. Material and social deprivation might have different impacts upon health, depending on which health indicator is under consideration. These impacts are likely modified by other factors not considered in this analysis. The use of more sophisticated analytical methods and the inclusion of more determinants of health beyond the Deprivation Index would have allowed for a better description of this complexity. Nevertheless the INSPQ’s Deprivation Index has been used in other recent studies (see, for example, reports by the Canadian Population Health Initiative, available at www.cihi.ca/cphi).
The choice to base this analysis on categories of deprivation is an important limitation. In statistics, creating categories out of anything essentially treats all members of each category as if they were identical. This is not the case in the real world. Within a single category of deprivation there will be differences in income, education, social support and other factors which may be important in determining the health status of each individual within that category. While useful for their simplicity and ease of interpretation, categories decrease the amount of information that is available and limit the complete description of the relationship between deprivation and population health.
The choice to categorize areas into three deprivation groups, and to compare areas of highest and lowest deprivation, is important. Areas could have been grouped in alternative ways that either enhanced or diminished differences between them in terms of deprivation (i.e. by including more or fewer people). Grouping a smaller number of areas into each deprivation group may have made health outcome differences between the extremes
(i.e. highest vs. lowest) easier to detect. However, gains due to increased group homogeneity would be offset somewhat by a decrease in sample size.
Heterogeneity within City of Greater Sudbury dissemination areas
Using predefined geographic regions or administrative boundaries as the basis for analysis poses a challenge. Grouping people together in an area and treating them as if they were the same can mask differences that may exist between the residents of that area. The use of the smallest geographic unit (the Dissemination Area) does mitigate this effect to some extent. However, even within DAs significant variability can exist. This is a known phenomenon with some of the Dissemination Areas in Greater Sudbury, which for example have a wide range of household income levels. Therefore, if the boundaries of the Dissemination Areas had been drawn differently, the results presented in this report may have changed, (this is known as the Modifiable Area Unit Problem). Specifically, the variability within DAs may have lessened the apparent impact of deprivation on a health outcome.
Missing deprivation data
The INSPQ methodology excludes DAs with large proportions of persons living in collective dwellings (nursing homes, retirement home, etc.). It also excludes DAs where socio-economic data were suppressed or were not available (no long-form census data available). In the current analysis, three DAs were excluded on the basis of these criteria. It is noteworthy that these excluded DAs represent some of the most disadvantaged parts of the City (downtown core, for which no socio-economic data was available).
Data source-specific limitations
The data analyzed here come from a number of different sources, each of which have their own limitations. Health survey data are subject to a number of known biases, due to self-reports by the respondents. Administrative data (for example, births, deaths, hospital records) can suffer from errors in recording the proper diagnosis, or the client’s postal code. These sorts of errors would make an association between deprivation and health harder to detect. Furthermore, postal code files do not pinpoint the exact location of a person’s residence. Canada Post and Statistics Canada estimate the “most likely” location of a population related to a postal code. However, there are a variety of situations, especially in suburban and rural parts of a city, where health data can be erroneously geocoded.
Sample size
Many of the health outcomes considered in this report are rare. In such cases, there might be insufficient data to detect statistically significant differences between groups at the local level, even if they exist. Multiple years of data were combined in this report in an effort to overcome this limitation. This may mask trends in the data that appear over time.
Variability in estimated rates
The rates presented in this report are estimates, for which there is always uncertainty and variability. For example, observed rates of disease can fluctuate over the short term, even if there is no “true” change in the underlying rate of disease within the population. Estimates from health surveys can change if the survey were repeated using different people. Such changes can occur due to chance alone.
In keeping with common practice, if statistical methods indicate that there is a greater than 5% likelihood that a difference may have arisen solely due to chance, then that difference is said to NOT be statistically significant. The proper interpretation of such a finding is that there is not sufficient evidence to conclude that a difference actually exists between the groups under consideration.
Appendix F
Consultation Participants
Opportunities for Wellbeing consultation event — December 5, 2012
Participating agencies and organizations
Better Beginnings Better Futures
Canadian Mental Health Association
Centre de santé communautaire du Grand Sudbury
Child & Community Resources
City of Greater Sudbury, Community Development (Leisure Services, Social Services)
City of Greater Sudbury, Growth and Development (Planning Services)
Conseil scolaire public du Grand Nord de l’Ontario
Greater Sudbury Police Service
Health Sciences North – Mental Health and Addictions Program
Iris Addiction Recovery for Women
Laurentian University
NetL3.com
NISA/Northern Initiative for Social Action
North East Local Health Integration Network
Our Children, Our Future
Prince Albert Police Services
Shkagamik-Kwe Health Centre
Social Planning Council of Sudbury
Sudbury & District Health Unit
Sudbury Action Centre For Youth
United Way Centraide Sudbury and/et Nipissing Districts
Authors
Na-Koshie Lamptey
Penny Sutcliffe
Stephanie Lefebvre
Michael King
Dar Malaviarachchi
Marc Lefebvre
Kirsty Inglis
Acknowledgements
The authors would like to thank l’Institut national de santé publique du Québec for providing the data files necessary for this analysis and Kingston, Frontenac and Lennox & Addington Public Health for their preliminary analysis. The authors extend their gratitude to Philippe Gamache for his technical advice on the use of the Deprivation Index and Alissa Palangio for her assistance with the data analysis. The authors thank Renée Chevrier-Lamoureux and Stephanie Collins for their assistance with searches of the academic literature. Finally, the authors acknowledge the contributions of Shanon Stewart, Laurie Gagnon, Jamie Lamothe, and Shawna Brydges, to the report design and format.
Cover photo credit: Greg Taylor
Contact for More Information
Information Resource Centre
Sudbury & District Health Unit
1300 Paris Street
Sudbury, ON P3E 3A3
705.522.9200, ext. 350
resourcecentre@sdhu.com
Citation
Sudbury & District Health Unit. (2013). Opportunity for All: The Path to Health Equity. Sudbury, ON: Author.
© Sudbury & District Health Unit, 2013
This item was last modified on November 17, 2025