Ward profiles: City of Greater Sudbury
The following includes information on the distribution of people living in areas of high deprivation across the City of Greater Sudbury by city wards. Also included are maps that identify the areas of least, neutral, and most deprivation within the various wards in the City of Greater Sudbury.
The maps do not represent rates of particular health outcomes within the areas or the health status of individual residents. For example, the overall rate of premature mortality (i.e. dying before age 75) in the City of Greater Sudbury’s most deprived areas is nearly twice as high as in the City’s least deprived areas. However, not every geographic area that is categorized as “most deprived” will have the same rate of premature mortality, nor will every resident within those most deprived areas.
What can you do?
Just as every community has challenges to overcome, each also exhibits great resilience, strengths, and opportunities for health. These actions span community interests from economic development to food security, health care access to housing. The actions that will have the most impact in each ward, and across the City of Greater Sudbury, will be best informed by our collective knowledge and experience.
Keep the conversation going in your community. For example,
- Share this information with local Community Action Networks to consider as they plan their own activities and events.
- Use this information to advocate for local and provincial policies and programs to improve the social and economic conditions where you live.
- Ask about the potential health impacts of new policies and programs in the City of Greater Sudbury. Will they create or reduce opportunities for health in our communities?
City of Greater Sudbury ward population distribution
The table below presents the findings for each of the wards located within the City of Greater Sudbury.
| % OF THE OVERALL POPULATION OF THE CITY OF GREATER SUDBURY |
% OF ALL RESIDENTS WITHIN THE MOST DEPRIVED AREAS WHO LIVE WITHIN EACH WARD |
% OF RESIDENTS IN EACH WARD WHO LIVE IN A MOST DEPRIVED AREA |
|
| Ward 1 | 8% | 11% | 22% |
| Ward 2 | 8% | 3% | 7% |
| Ward 3 | 8% | 13% | 28% |
| Ward 4 | 8% | 16% | 31% |
| Ward 5 | 7% | 9% | 19% |
| Ward 6 | 9% | 2% | 4% |
| Ward 7 | 8% | 7% | 14% |
| Ward 8 | 7% | 2% | 5% |
| Ward 9 | 9% | 0% | 0% |
| Ward 10 | 10% | 6% | 9% |
| Ward 11 | 8% | 11% | 23% |
| Ward 12 | 9% | 21% | 36% |
N.B. It is important to note that not all City of Greater Sudbury ward boundaries correspond with Statistics Canada dissemination area boundaries. The above population percentages are, therefore, an estimate based on best available data.
Ward 1: West End, Gatchell, Copper Park, Robinson, Moonglo, South of Ontario Street and West of Regent Street
- Ward 1 (PDF, 656 KB)
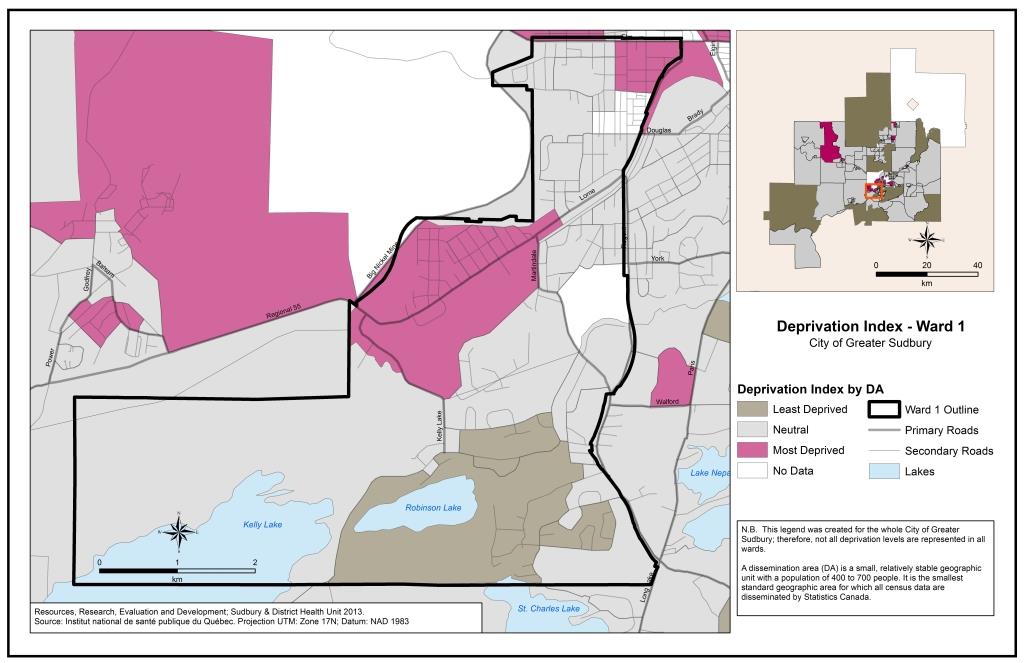
Based on the 2006 census data:
- Ward 1 has 8% (12 671) of Greater Sudbury’s population
- Ward 1 has 11% (2 750) of all Greater Sudbury residents who live in most deprived areas
- Overall, 22% (2 750) of all Ward 1 residents live in a most deprived area
Ward 2: Lively, Naughton, Whitefish, Copper Cliff and Worthington
- Ward 2 (PDF, 760 KB)
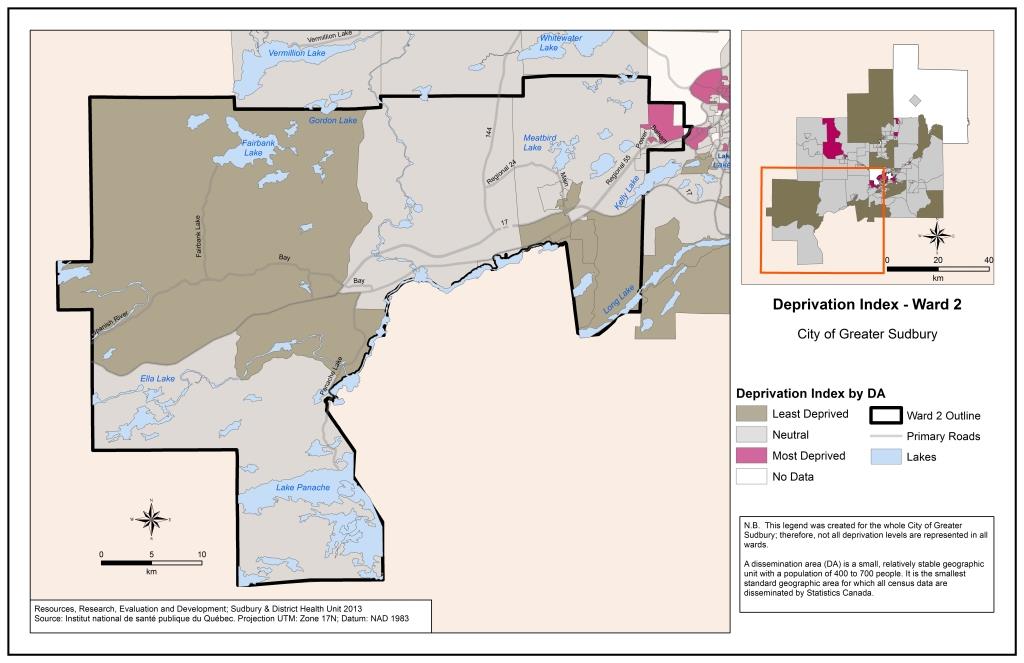
Based on the 2006 census data:
- Ward 2 has 8% (12 631) of Greater Sudbury’s population
- Ward 2 has 3% (900) of all Greater Sudbury residents who live in most deprived areas
- Overall, 7% (900) of all Ward 2 residents live in a most deprived area
Ward 3: Chelmsford, Onaping, Dowling and Levack
- Ward 3 (PDF, 718 KB)
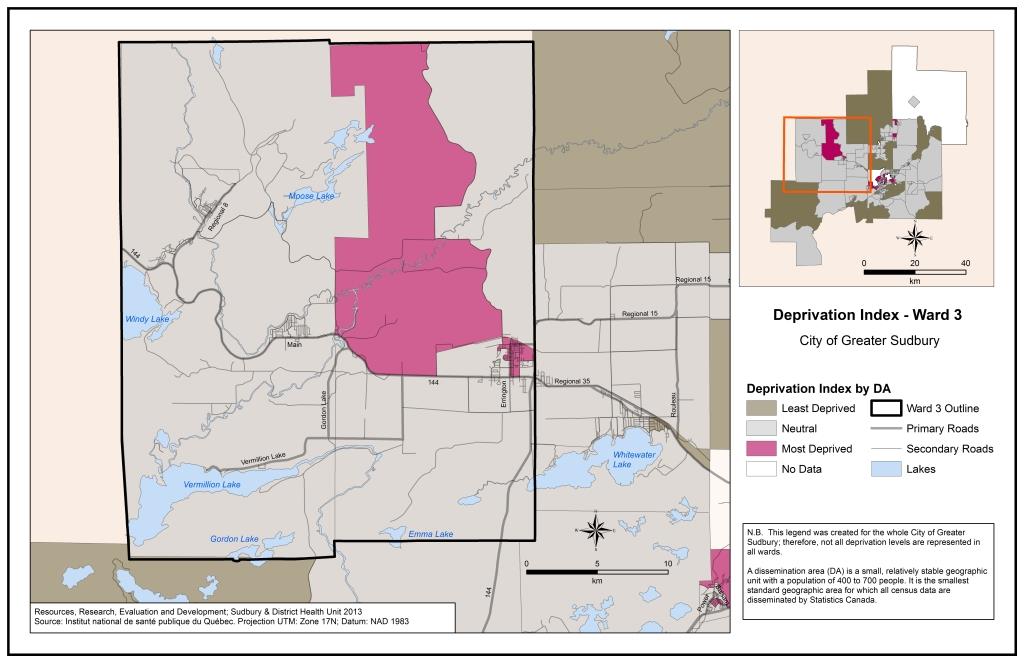
Based on the 2006 census data:
- Ward 3 has 8% (12 744) of Greater Sudbury’s population
- Ward 3 has 13% (3 508) of all residents who live in most deprived areas
- Overall, 28% (3 508) of all Ward 3 residents live in a most deprived area
Ward 4: Azilda, Elm West and Donovan
- Ward 4 (PDF, 655 KB)
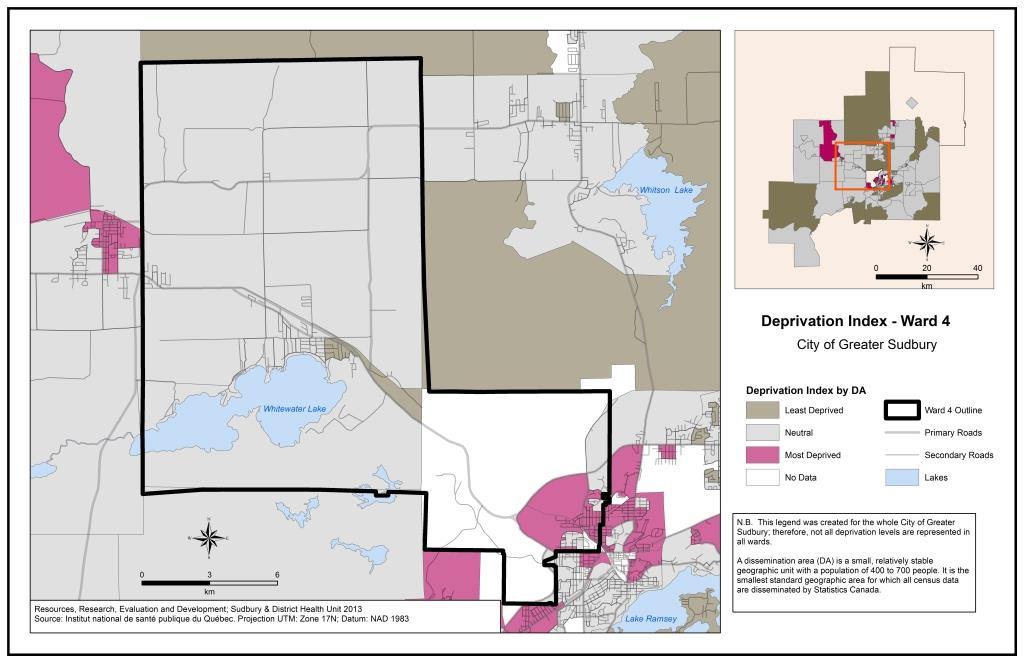
Based on the 2006 census data:
- Ward 4 has 8% (13 317) of Greater Sudbury’s population
- Ward 4 has 16% (4 074) of all Greater Sudbury residents who live in most deprived areas
- Overall, 31% (4 074) of all Ward 4 residents live in a most deprived area
Ward 5: Val Caron, Blezard Valley, Cambrian Heights, McCrea Heights, Guilletteville, Notre Dame- Lasalle area West of Rideau Street
- Ward 5 (PDF, 760 KB)
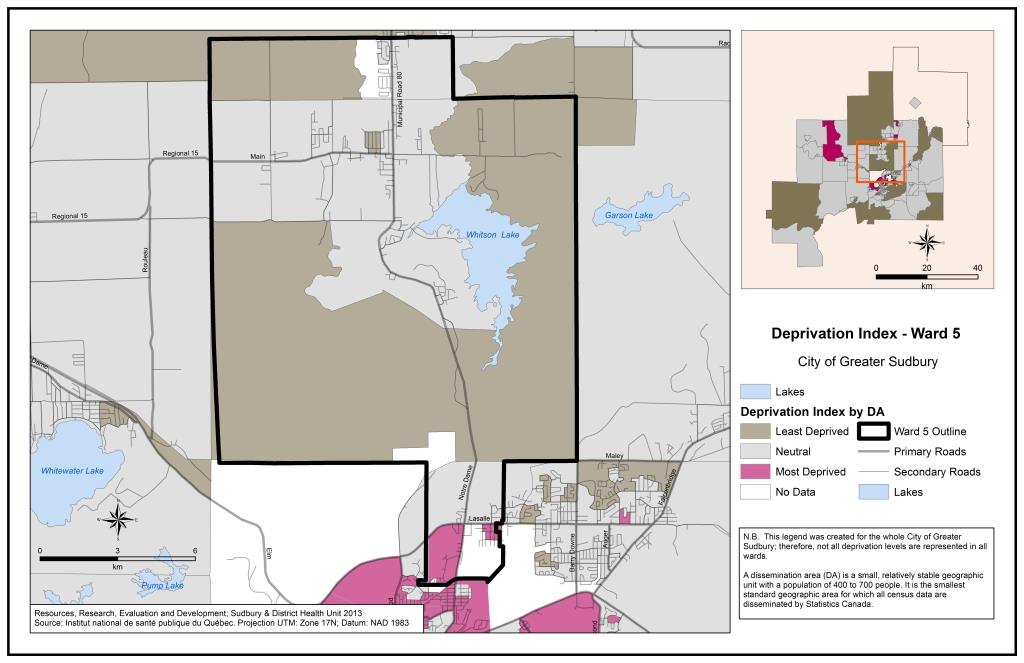
Based on the 2006 census data:
- Ward 5 has 7% (11 739) of Greater Sudbury’s population
- Ward 5 has 9% (2 230) of all Greater Sudbury residents who live in most deprived areas
- Overall, 19% (2 230) of all Ward 5 residents live in a most deprived area
Ward 6: Val Therese and Hanmer
- Ward 6 (PDF, 701 KB)
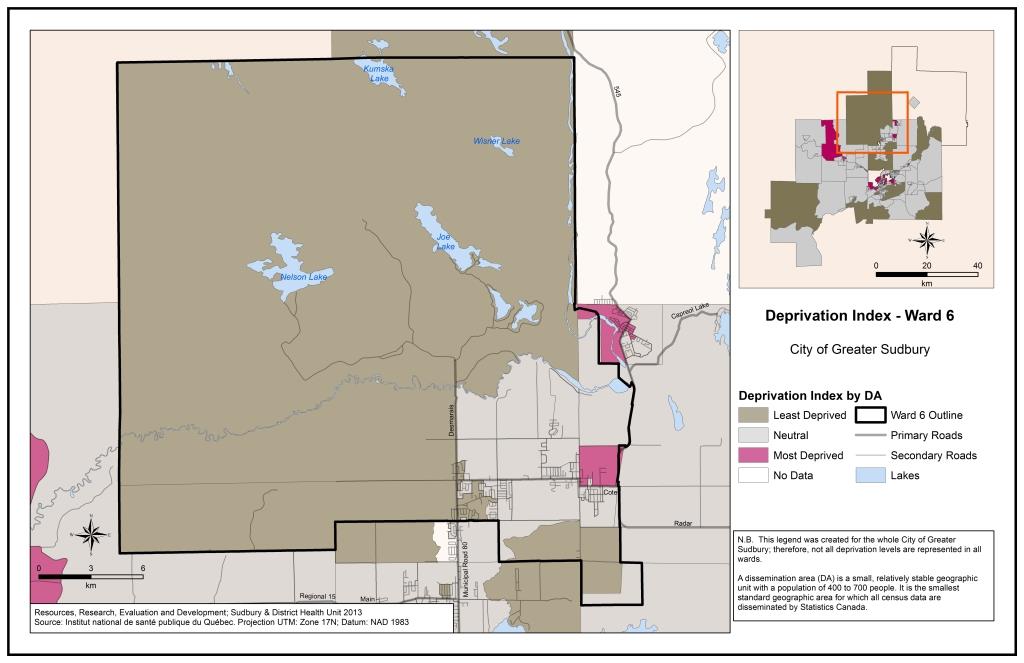
Based on the 2006 census data:
- Ward 6 has 9% (13 700) of Greater Sudbury’s population
- Ward 6 has 2% (526) of all Greater Sudbury residents who live in most deprived areas
- Overall, 4% (526) of all Ward 6 residents live in a most deprived area
Ward 7: Garson, Falconbridge, Capreol and Skead
- Ward 7 (PDF, 763 KB)
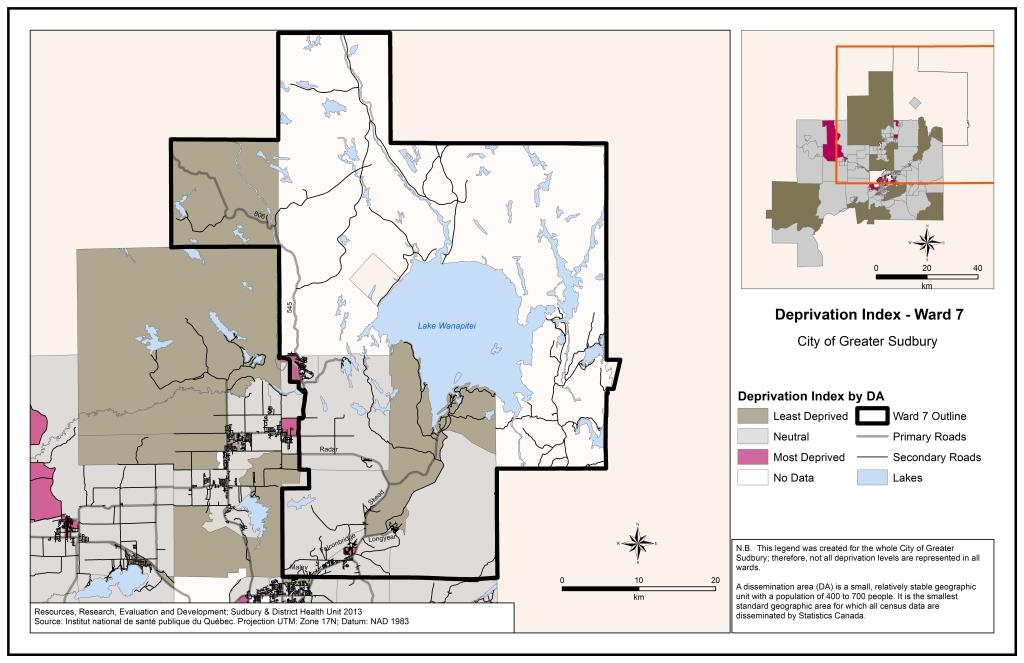
Based on the 2006 census data:
- Ward 7 has 8% (12 901) of Greater Sudbury’s population
- Ward 7 has 7% (1 796) of all Greater Sudbury residents who live in most deprived areas
- Overall, 14% (1 796) of all Ward 7 residents live in a most deprived area
Ward 8: New Sudbury (East of Barry Downe Road)
- Ward 8 (PDF, 613 KB)
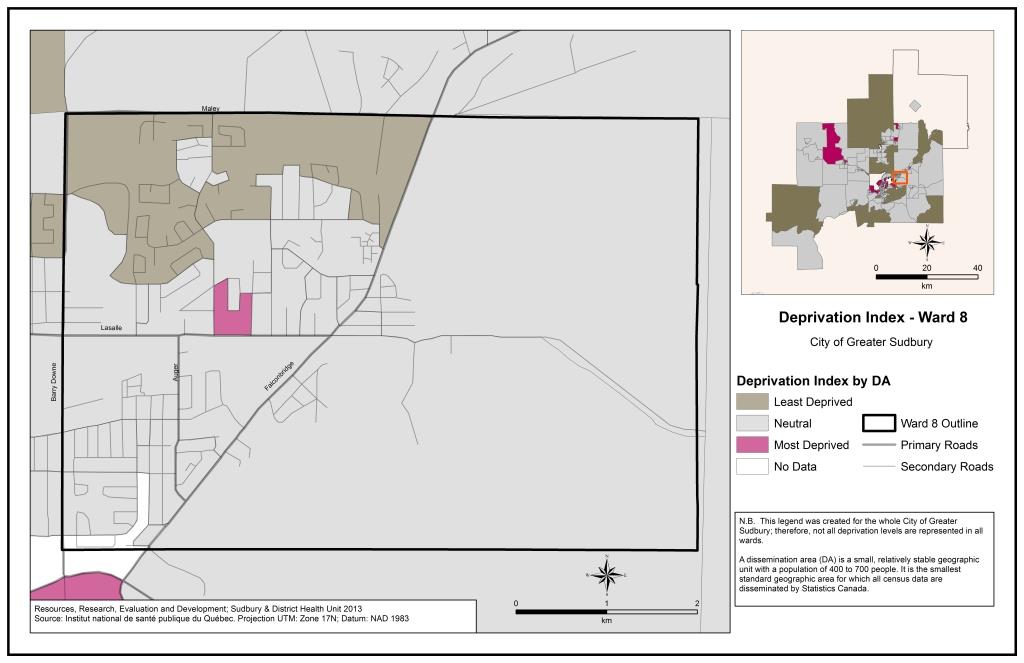
Based on the 2006 census data:
- Ward 8 has 7% (11 838) of Greater Sudbury’s population
- Ward 8 has 2% (560) of all Greater Sudbury residents who live in most deprived areas
- Overall, 5% (560) of all Ward 8 residents live in a most deprived area
Ward 9: Coniston, Wahnapitae, Wanup and South End (Broder Township)
- Ward 9 (PDF, 542 KB)
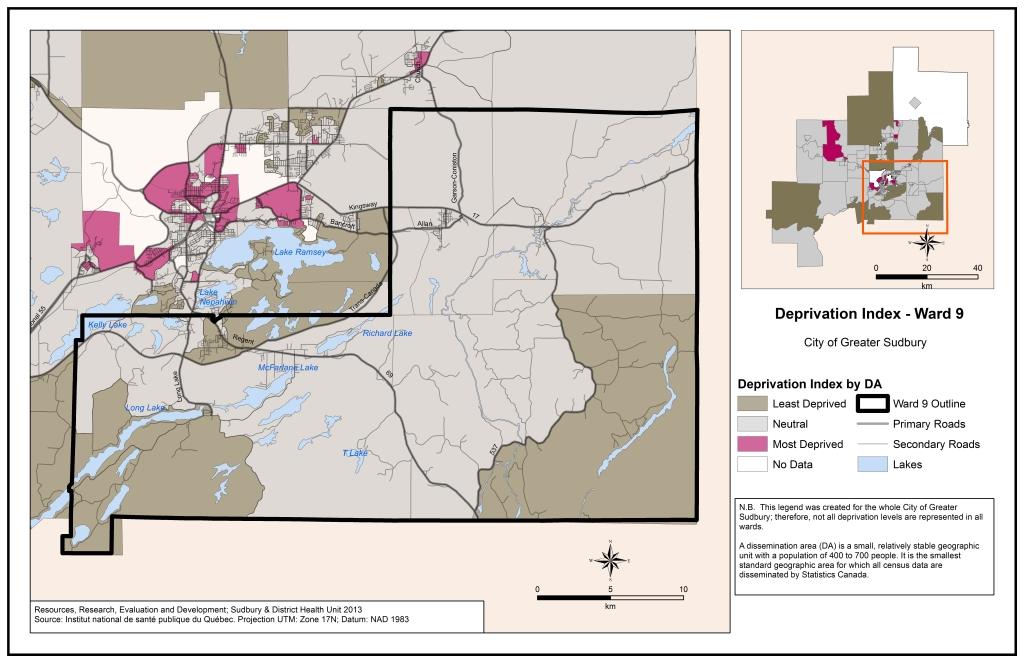
Based on the 2006 census data:
- Ward 9 has 9% (13 652) of Greater Sudbury’s population
- Ward 9 has 0% (0) of all Greater Sudbury residents who live in most deprived areas
- Overall, 0% (0) of all Ward 9 residents live in a most deprived area
Ward 10: Lockerby, Lo-Ellen, University Area, Kingsmount, Bell Park and Downtown (South of Elm Street)
- Ward 10 (PDF, 544 KB)
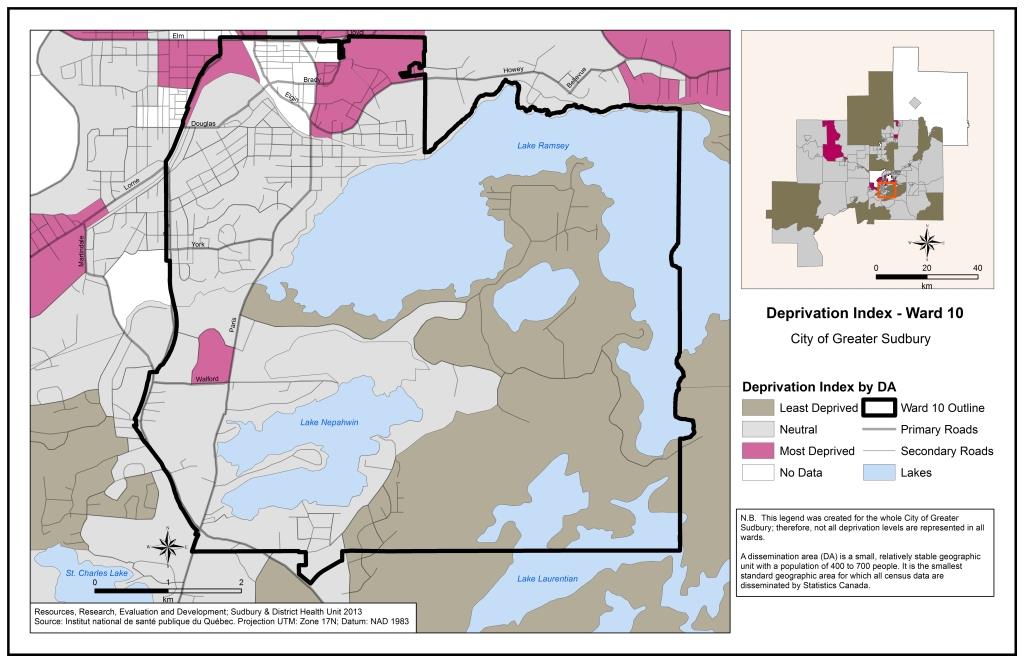
Based on the 2006 census data:
- Ward 10 has 10% (15 775) of Greater Sudbury’s population
- Ward 10 has 6% (1 491) of all Greater Sudbury residents who live in most deprived areas
- Overall, 9% (1 491) of all Ward 10 residents live in a most deprived area
Ward 11: Minnow Lake and New Sudbury (West of Barry Downe Road, east of Arthur Street, South of Lasalle Boulevard)
- Ward 11 (PDF, 790 KB)
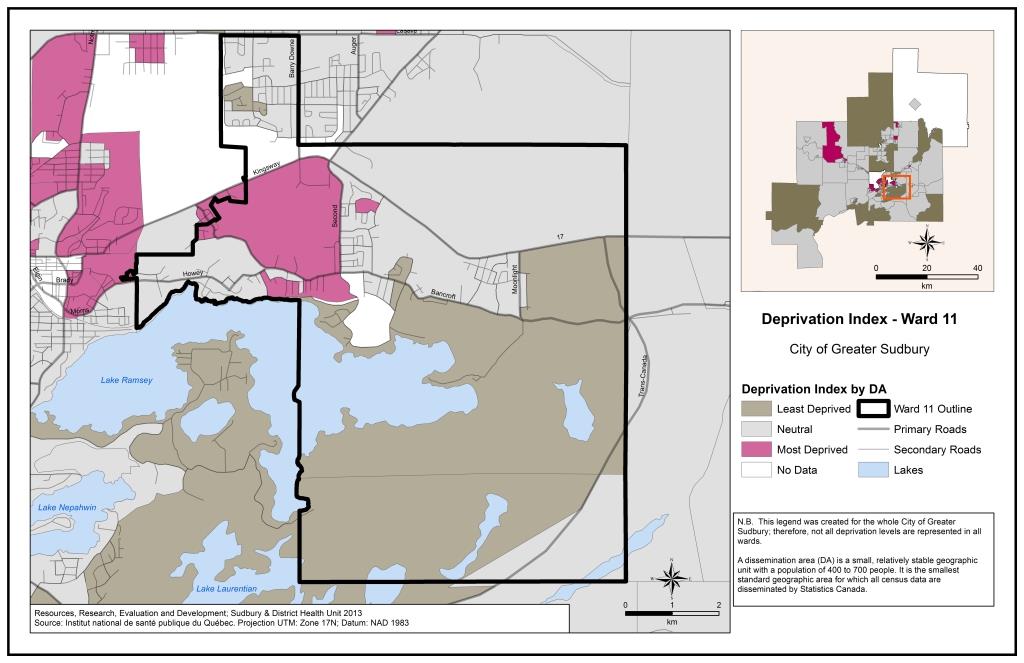
Based on the 2006 census data:
- Ward 11 has 8% (12 003) of Greater Sudbury’s population
- Ward 11 has 11% (2 819) of all Greater Sudbury residents who live in most deprived areas
- Overall, 23% (2 819) of all Ward 11 residents live in a most deprived area
Ward 12: Flour Mill, Downtown (North of Elm Street) New Sudbury (east of Rideau Street, west of Barry Downe Road & north of Lasalle Boulevard), Kingsway-Bancroft area
- Ward 12 (PDF, 701 KB)
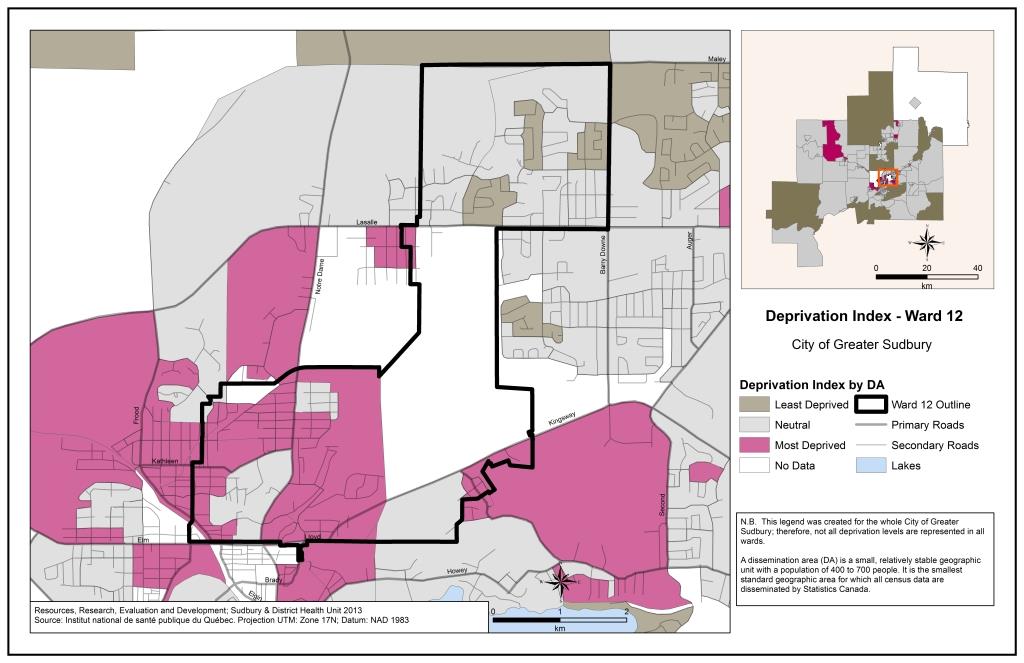
Based on the 2006 census data:
- Ward 12 has 9% (14 886) of Greater Sudbury’s population
- Ward 12 has 21% (5 384) of all Greater Sudbury residents who live in most deprived areas
- Overall, 36% (5 384) of all Ward 12 residents live in a most deprived area
This item was last modified on March 17, 2025