Obesity (adjusted Body Mass Index)
Obesity (adjusted body mass index) by geographic area
Key findings:
- In 2013/14, survey results indicated that the rate of obesity among the Sudbury and districts population aged 18 and older was 33%.
- The prevalence rate of obesity in Sudbury and districts has consistently been similar to that reported in northeastern Ontario, but higher than Ontario overall.
- Between 2007/08 and 2013/14, the rate of obesity in Sudbury and districts has not changed significantly.
Notes:
- Rates are age-standardized using the 2011 Canadian population.
- Rates are for the population aged 18 years and older, excluding pregnant women, lactating women, and persons less than 3 feet tall or greater than 6 feet 11 inches.
- Rates have been adjusted to correct for a known bias in self-reported data on height (overestimation) and weight (underestimation).
- Data source: Canadian Community Health Survey (CCHS), 2007 to 2014, Statistics Canada, Share File, Ontario Ministry of Health and Long-Term Care.
Figure: Age-standardized prevalence rate, obesity (adjusted body mass index), by year and geographic area, ages 18+, 2007/08 to 2013/14
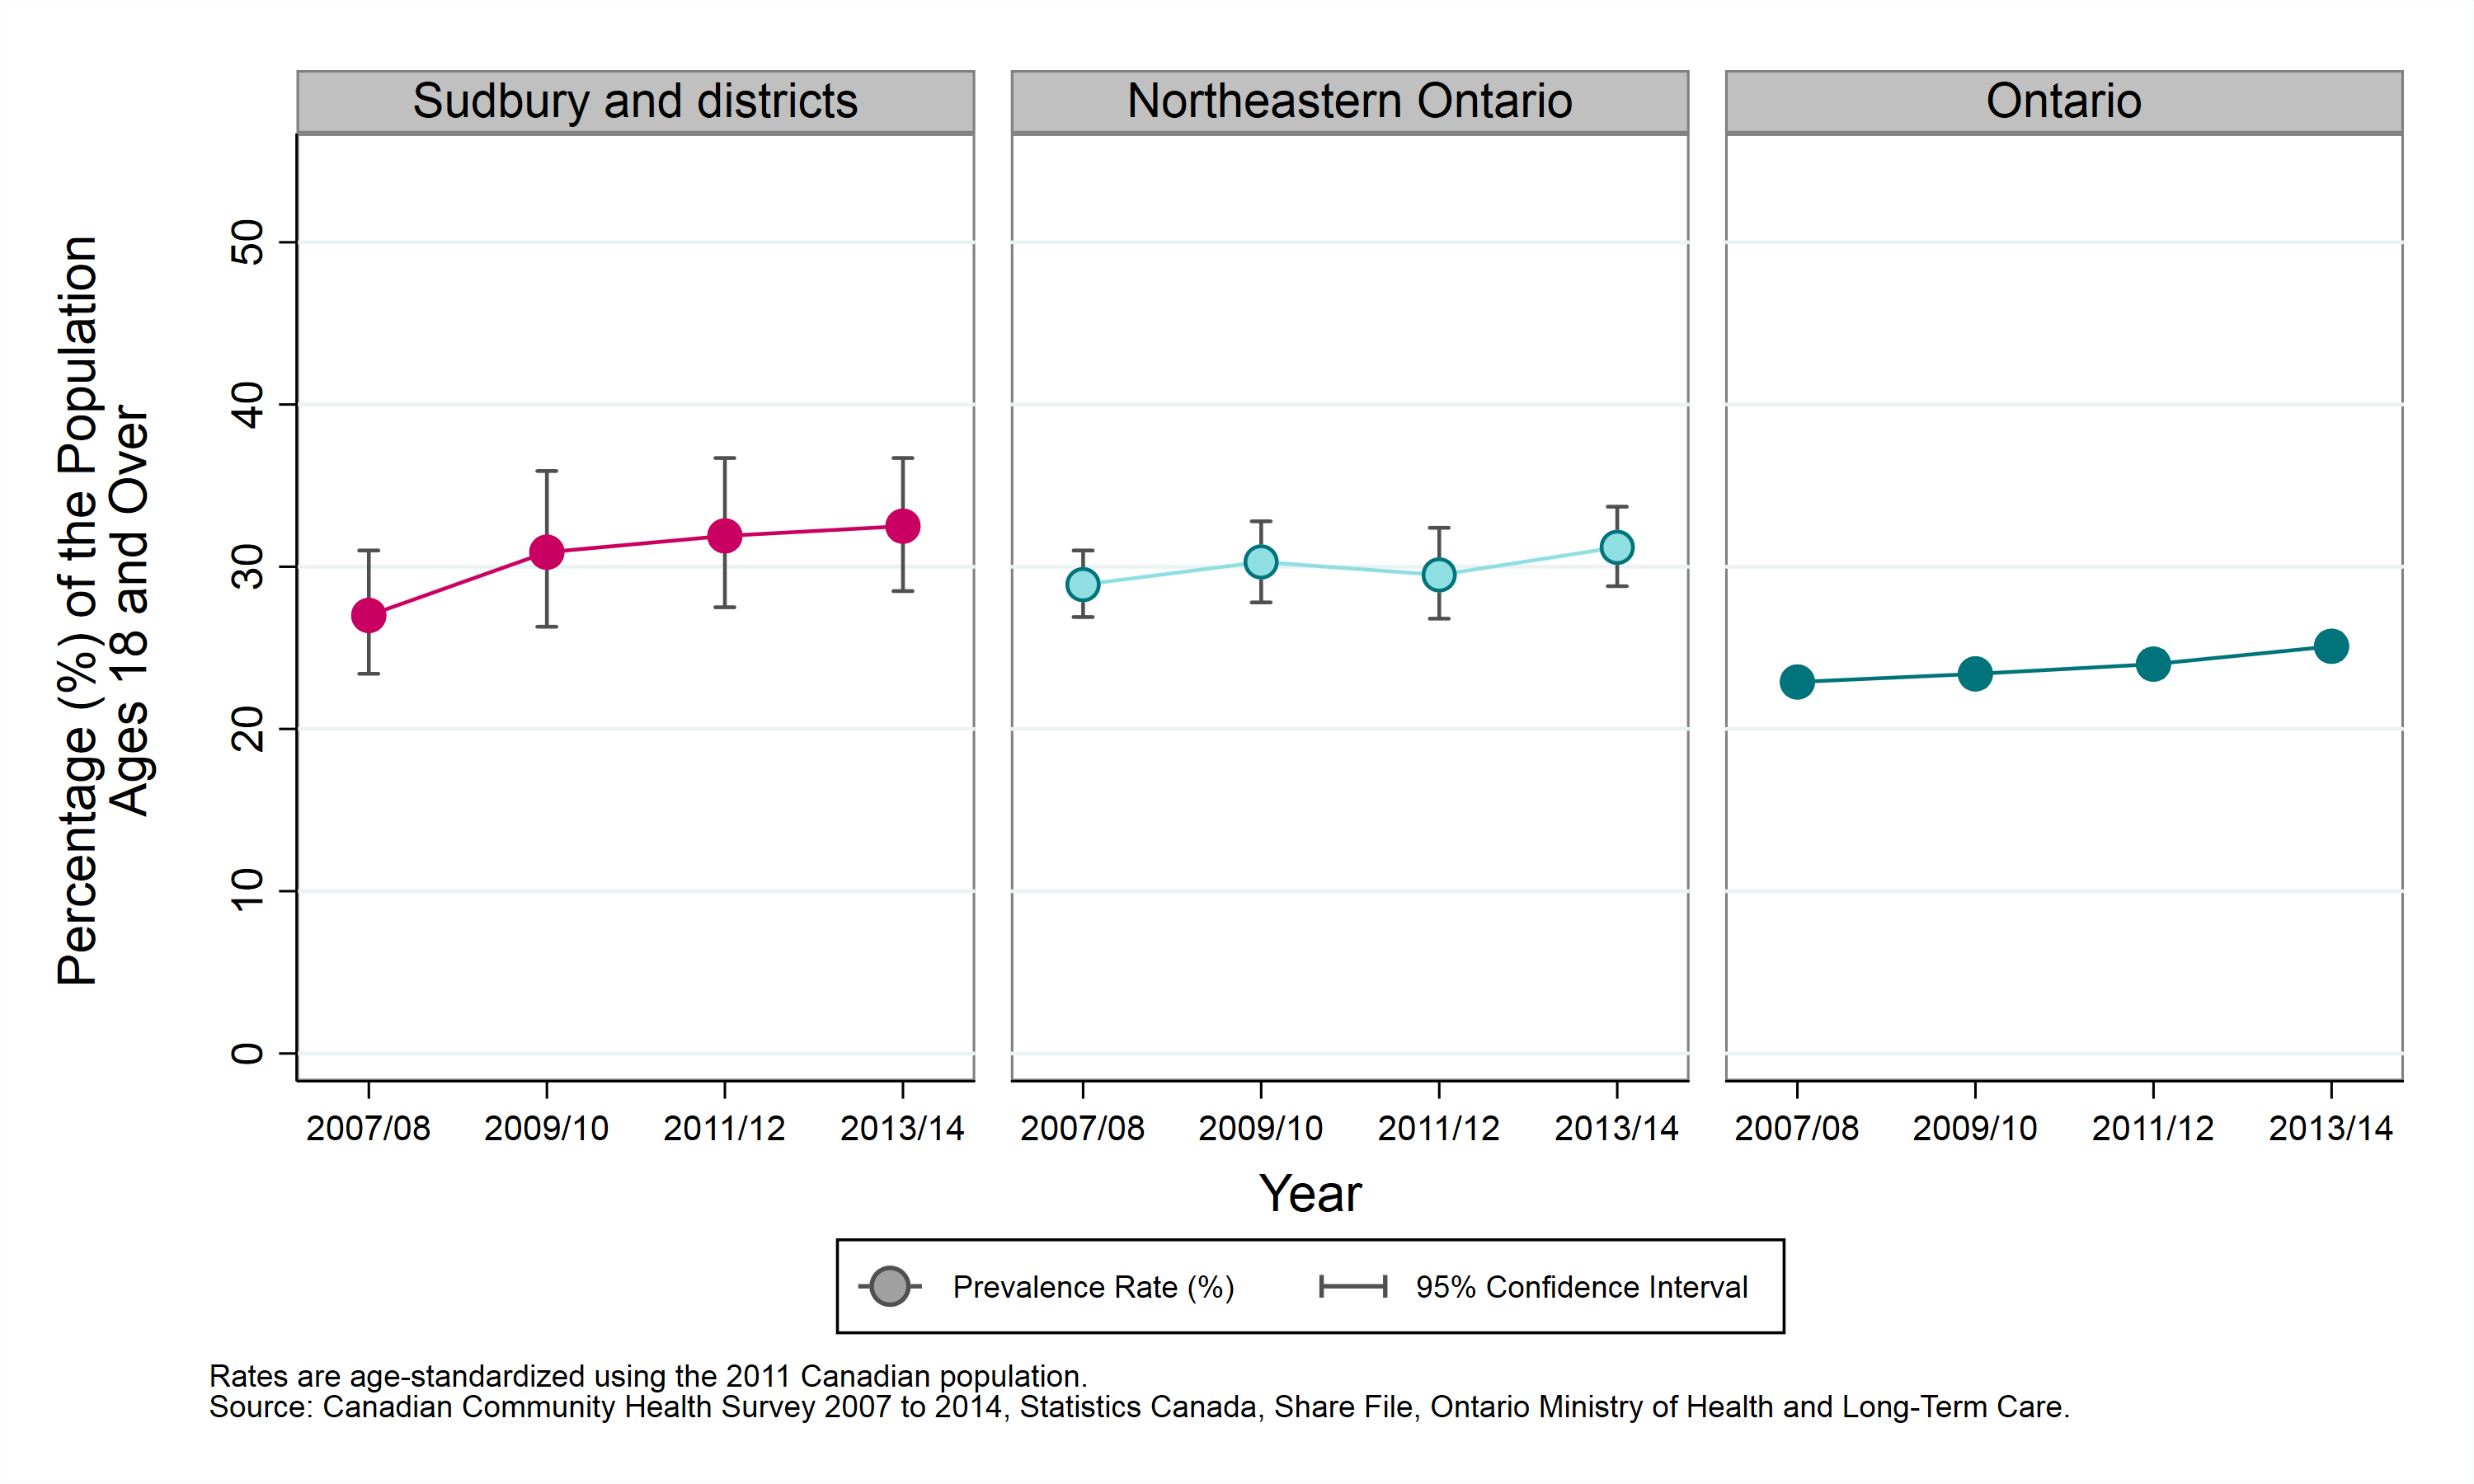
Table: Age-standardized prevalence rate, obesity (adjusted body mass index), by year and geographic area, ages 18+, 2007/08 to 2013/14
| Geographic Region | Prevalence Rate, 2007 to 2008 | Prevalence Rate, 2009 to 2010 | Prevalence Rate, 2011 to 2012 | Prevalence Rate, 2013 to 2014 |
|---|---|---|---|---|
| Sudbury and districts | 27.0% (CI: 23.4% to 31.0%) | 30.9% (CI: 26.3% to 35.9%) | 31.9% (CI: 27.5% to 36.7%) | 32.5% (CI: 28.5% to 36.7%) |
| Northeastern Ontario | 28.9% (CI: 26.9% to 31.0%) | 30.3% (CI: 27.8% to 32.8%) | 29.5% (CI: 26.8% to 32.4%) | 31.2% (CI: 28.8% to 33.7%) |
| Ontario | 22.9% (CI: 22.3% to 23.6%) | 23.4% (CI: 22.6% to 24.1%) | 24.0% (CI: 23.2% to 24.8%) | 25.1% (CI: 24.3% to 25.9%) |
Obesity (adjusted body mass index) by sex
Key findings:
- Between 2011 and 2014, survey results indicated that there was no statistical difference in the rate of obesity between males and females in Sudbury and districts.
- Between 2007 to 2010 and 2011 to 2014, the rate of obesity has remained relatively unchanged in both males and females in Sudbury and districts.
Notes:
- Rates are age-standardized using the 2011 Canadian population.
- Rates are for the population aged 18 years and older, excluding pregnant women, lactating women, and persons less than 3 feet tall or greater than 6 feet 11 inches.
- Rates have been adjusted to correct for a known bias in self-reported data on height (overestimation) and weight (underestimation).
- Data source: Canadian Community Health Survey (CCHS), 2007 to 2014, Statistics Canada, Share File, Ontario Ministry of Health and Long-Term Care.
Figure: Age-standardized prevalence rate, obesity (adjusted body mass index), by year and sex, ages 18+, 2007 to 2010 and 2011 to 2014
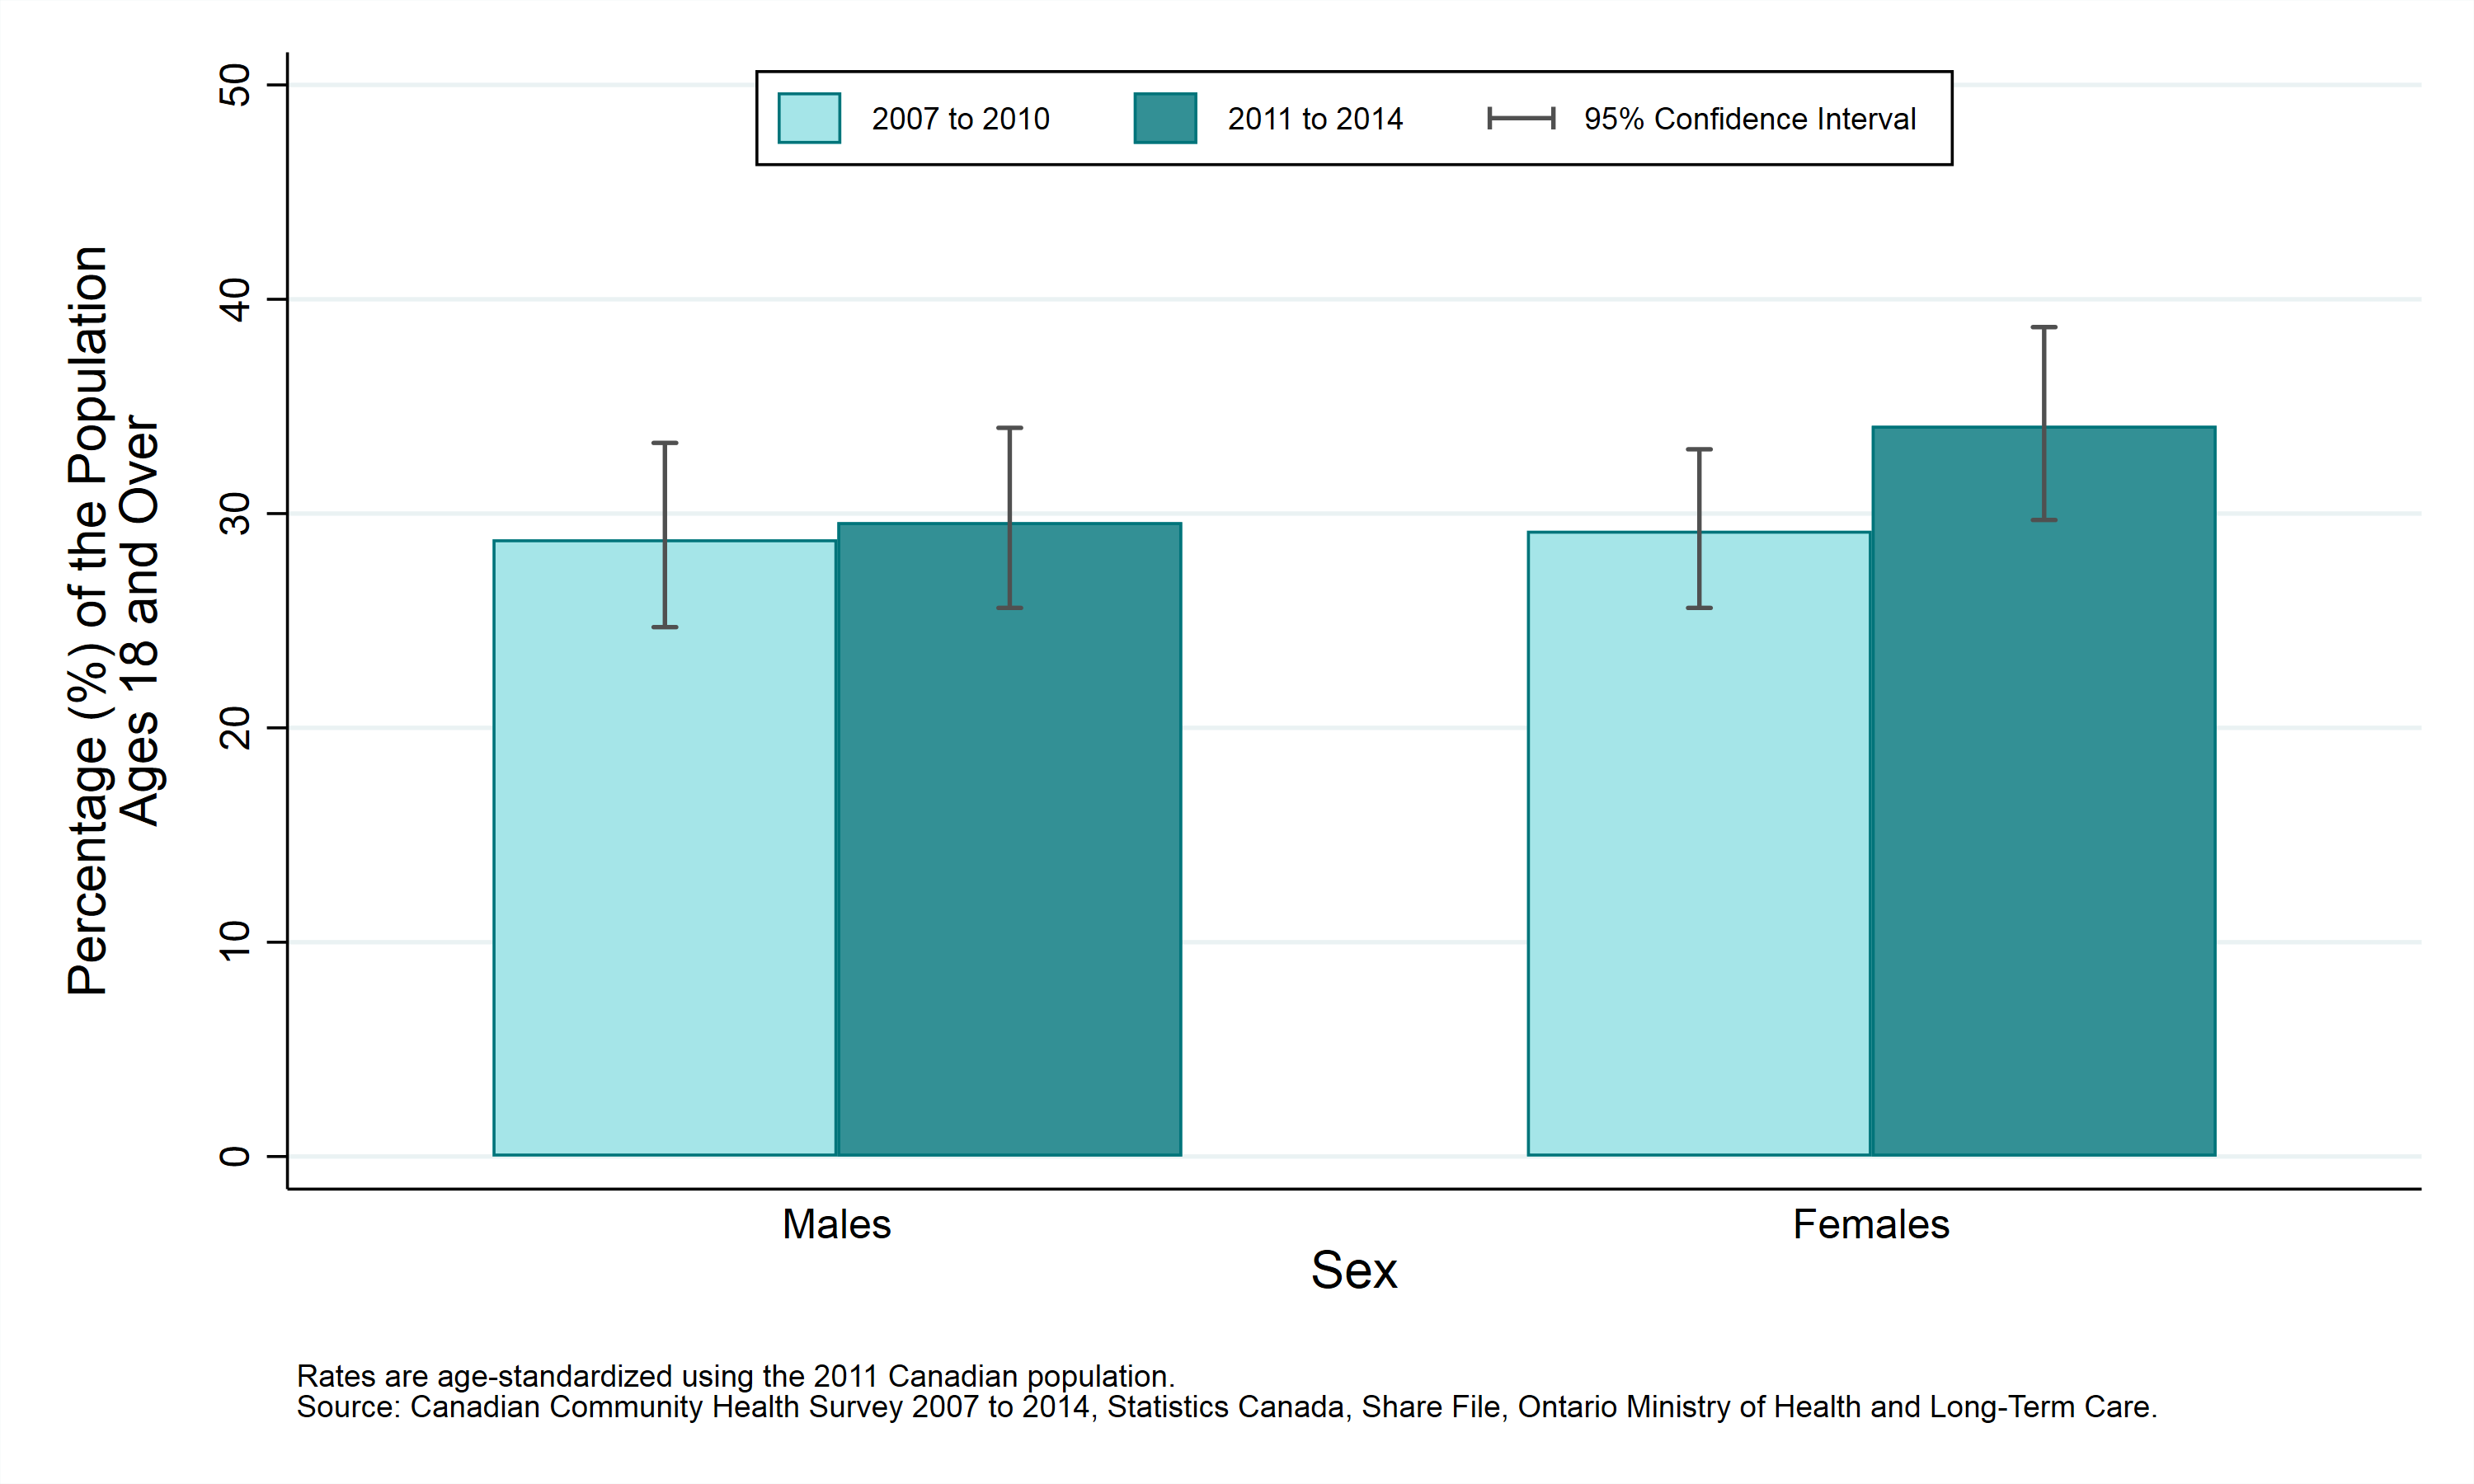
Table: Age-standardized prevalence rate, obesity (adjusted body mass index), by year and sex, ages 18+, 2007 to 2010 and 2011 to 2014
| Sex | Prevalence Rate, 2007 to 2010 | Prevalence Rate, 2011 to 2014 |
|---|---|---|
| Males | 28.8% (CI: 24.7% to 33.3%) | 29.6% (CI: 25.6% to 34.0%) |
| Females | 29.2% (CI: 25.6% to 33.0%) | 34.1% (CI: 29.7% to 38.7%) |
Obesity (adjusted body mass index) by age group
Key findings:
- Between 2011 and 2014, survey results indicated that the prevalence rate of obesity was not statistically different between age groups in Sudbury and districts.
- Between 2007 to 2010 and 2011 to 2014, the prevalence rate of obesity has not changed significantly within any age group.
Notes:
- Rates are for the population aged 18 years and older, excluding pregnant women, lactating women, and persons less than 3 feet tall or greater than 6 feet 11 inches.
- Rates have been adjusted to correct for a known bias in self-reported data on height (overestimation) and weight (underestimation).
- Data source: Canadian Community Health Survey (CCHS), 2007 to 2014, Statistics Canada, Share File, Ontario Ministry of Health and Long-Term Care.
Figure: Prevalence rate, obesity (adjusted body mass index), by year and age group, ages 18+, 2007 to 2010 and 2011 to 2014
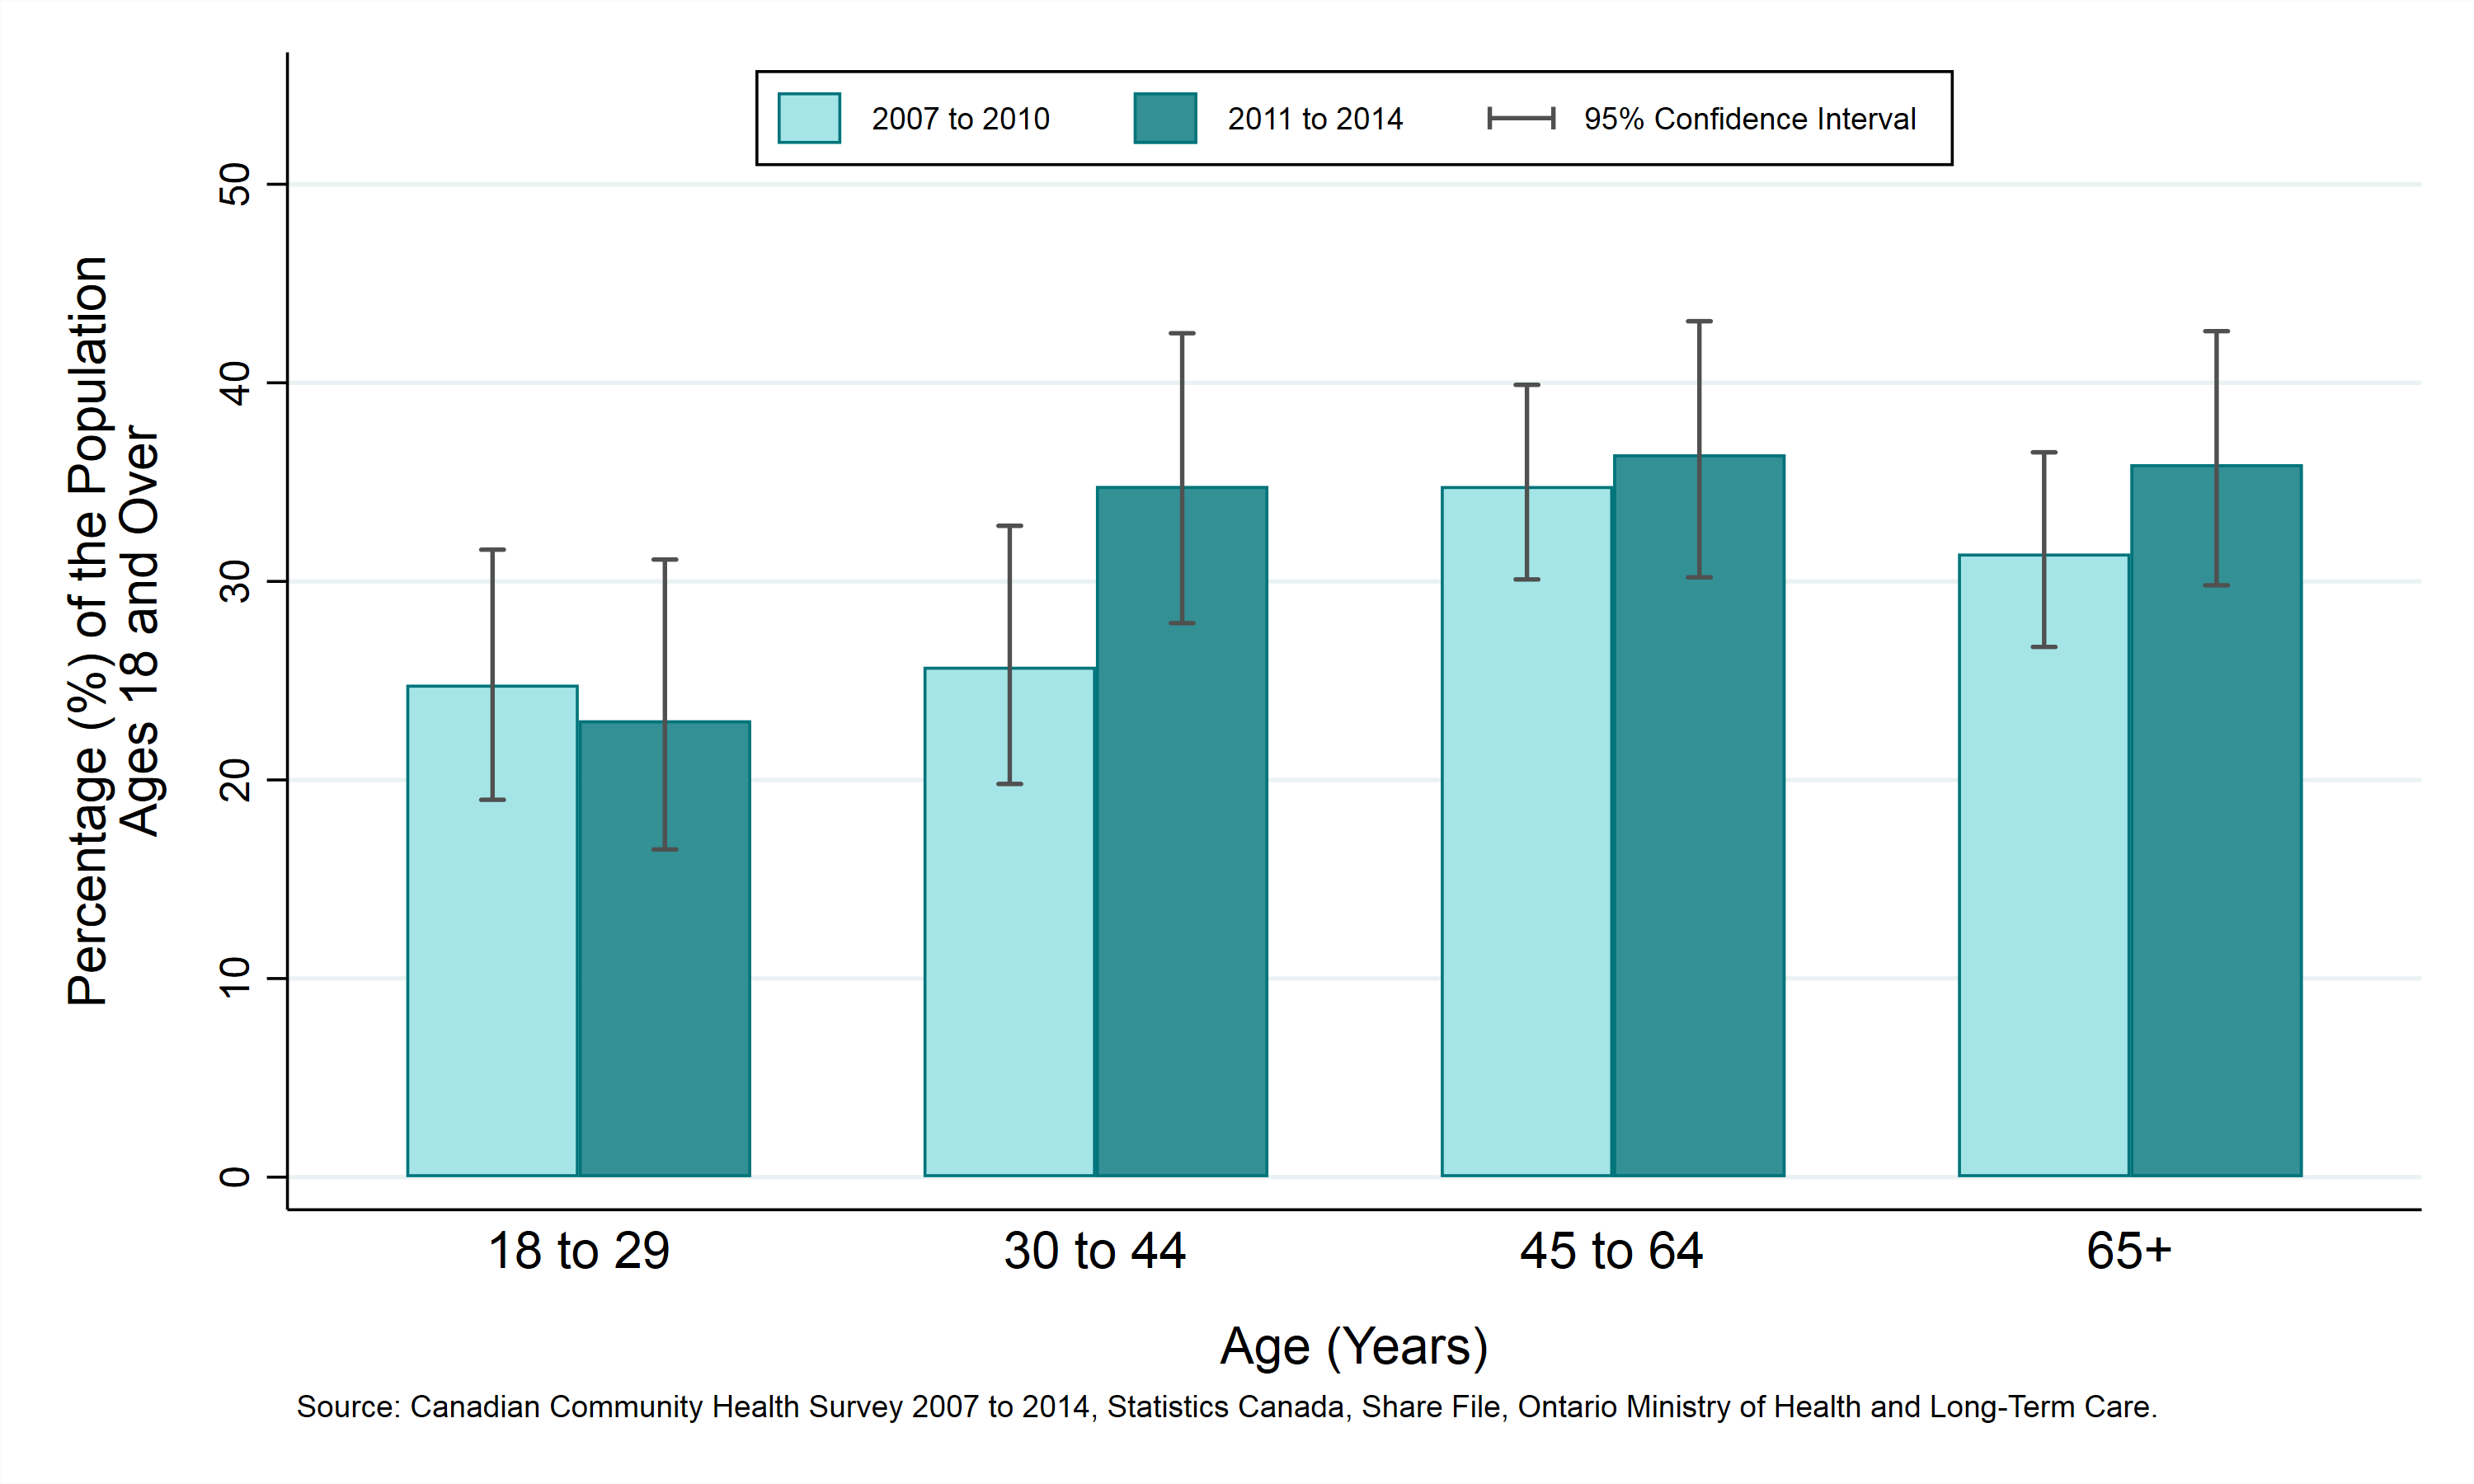
Table: Prevalence rate, obesity (adjusted body mass index), by year and age group, ages 18+, 2007 to 2010 and 2011 to 2014
| Age (Years) | Prevalence Rate, 2007 to 2010 | Prevalence Rate, 2011 to 2014 |
|---|---|---|
| 18 to 29 | 24.8% (CI: 19.0% to 31.6%) | 23.0% (CI: 16.5% to 31.1%) |
| 30 to 44 | 25.7% (CI: 19.8% to 32.8%) | 34.8% (CI: 27.9% to 42.5%) |
| 45 to 64 | 34.8% (CI: 30.1% to 39.9%) | 36.4% (CI: 30.2% to 43.1%) |
| 65+ | 31.4% (CI: 26.7% to 36.5%) | 35.9% (CI: 29.8% to 42.6%) |
Obesity (adjusted body mass index) by household income
Key findings:
- Between 2011 and 2014, survey results indicated that the prevalence rate of obesity was not statistically different between household income quintiles in Sudbury and districts.
- Between 2007 to 2010 and 2011 to 2014, the prevalence rate of obesity has not changed significantly within any household income quintile.
Notes:
- In this analysis, individuals are divided into “income quintiles”, or 5 groups of roughly equal size based on their reported household income. The groups are ranked, so that Quintile 1 represents the 20% of the population with the lowest incomes, and Quintile 5 represents the 20% with the highest incomes.
- Rates are age-standardized using the 2011 Canadian Population.
- Rates are for the population aged 18 years and older, excluding pregnant women, lactating women, and persons less than 3 feet tall or greater than 6 feet 11 inches.
- Rates have been adjusted to correct for a known bias in self-reported data on height (overestimation) and weight (underestimation).
- Data source: Canadian Community Health Survey (CCHS), 2007 to 2014, Statistics Canada, Share File, Ontario Ministry of Health and Long-Term Care.
Figure: Age-standardized prevalence rate, obesity (adjusted body mass index), by year and household income, ages 18+, 2007 to 2010 and 2011 to 2014
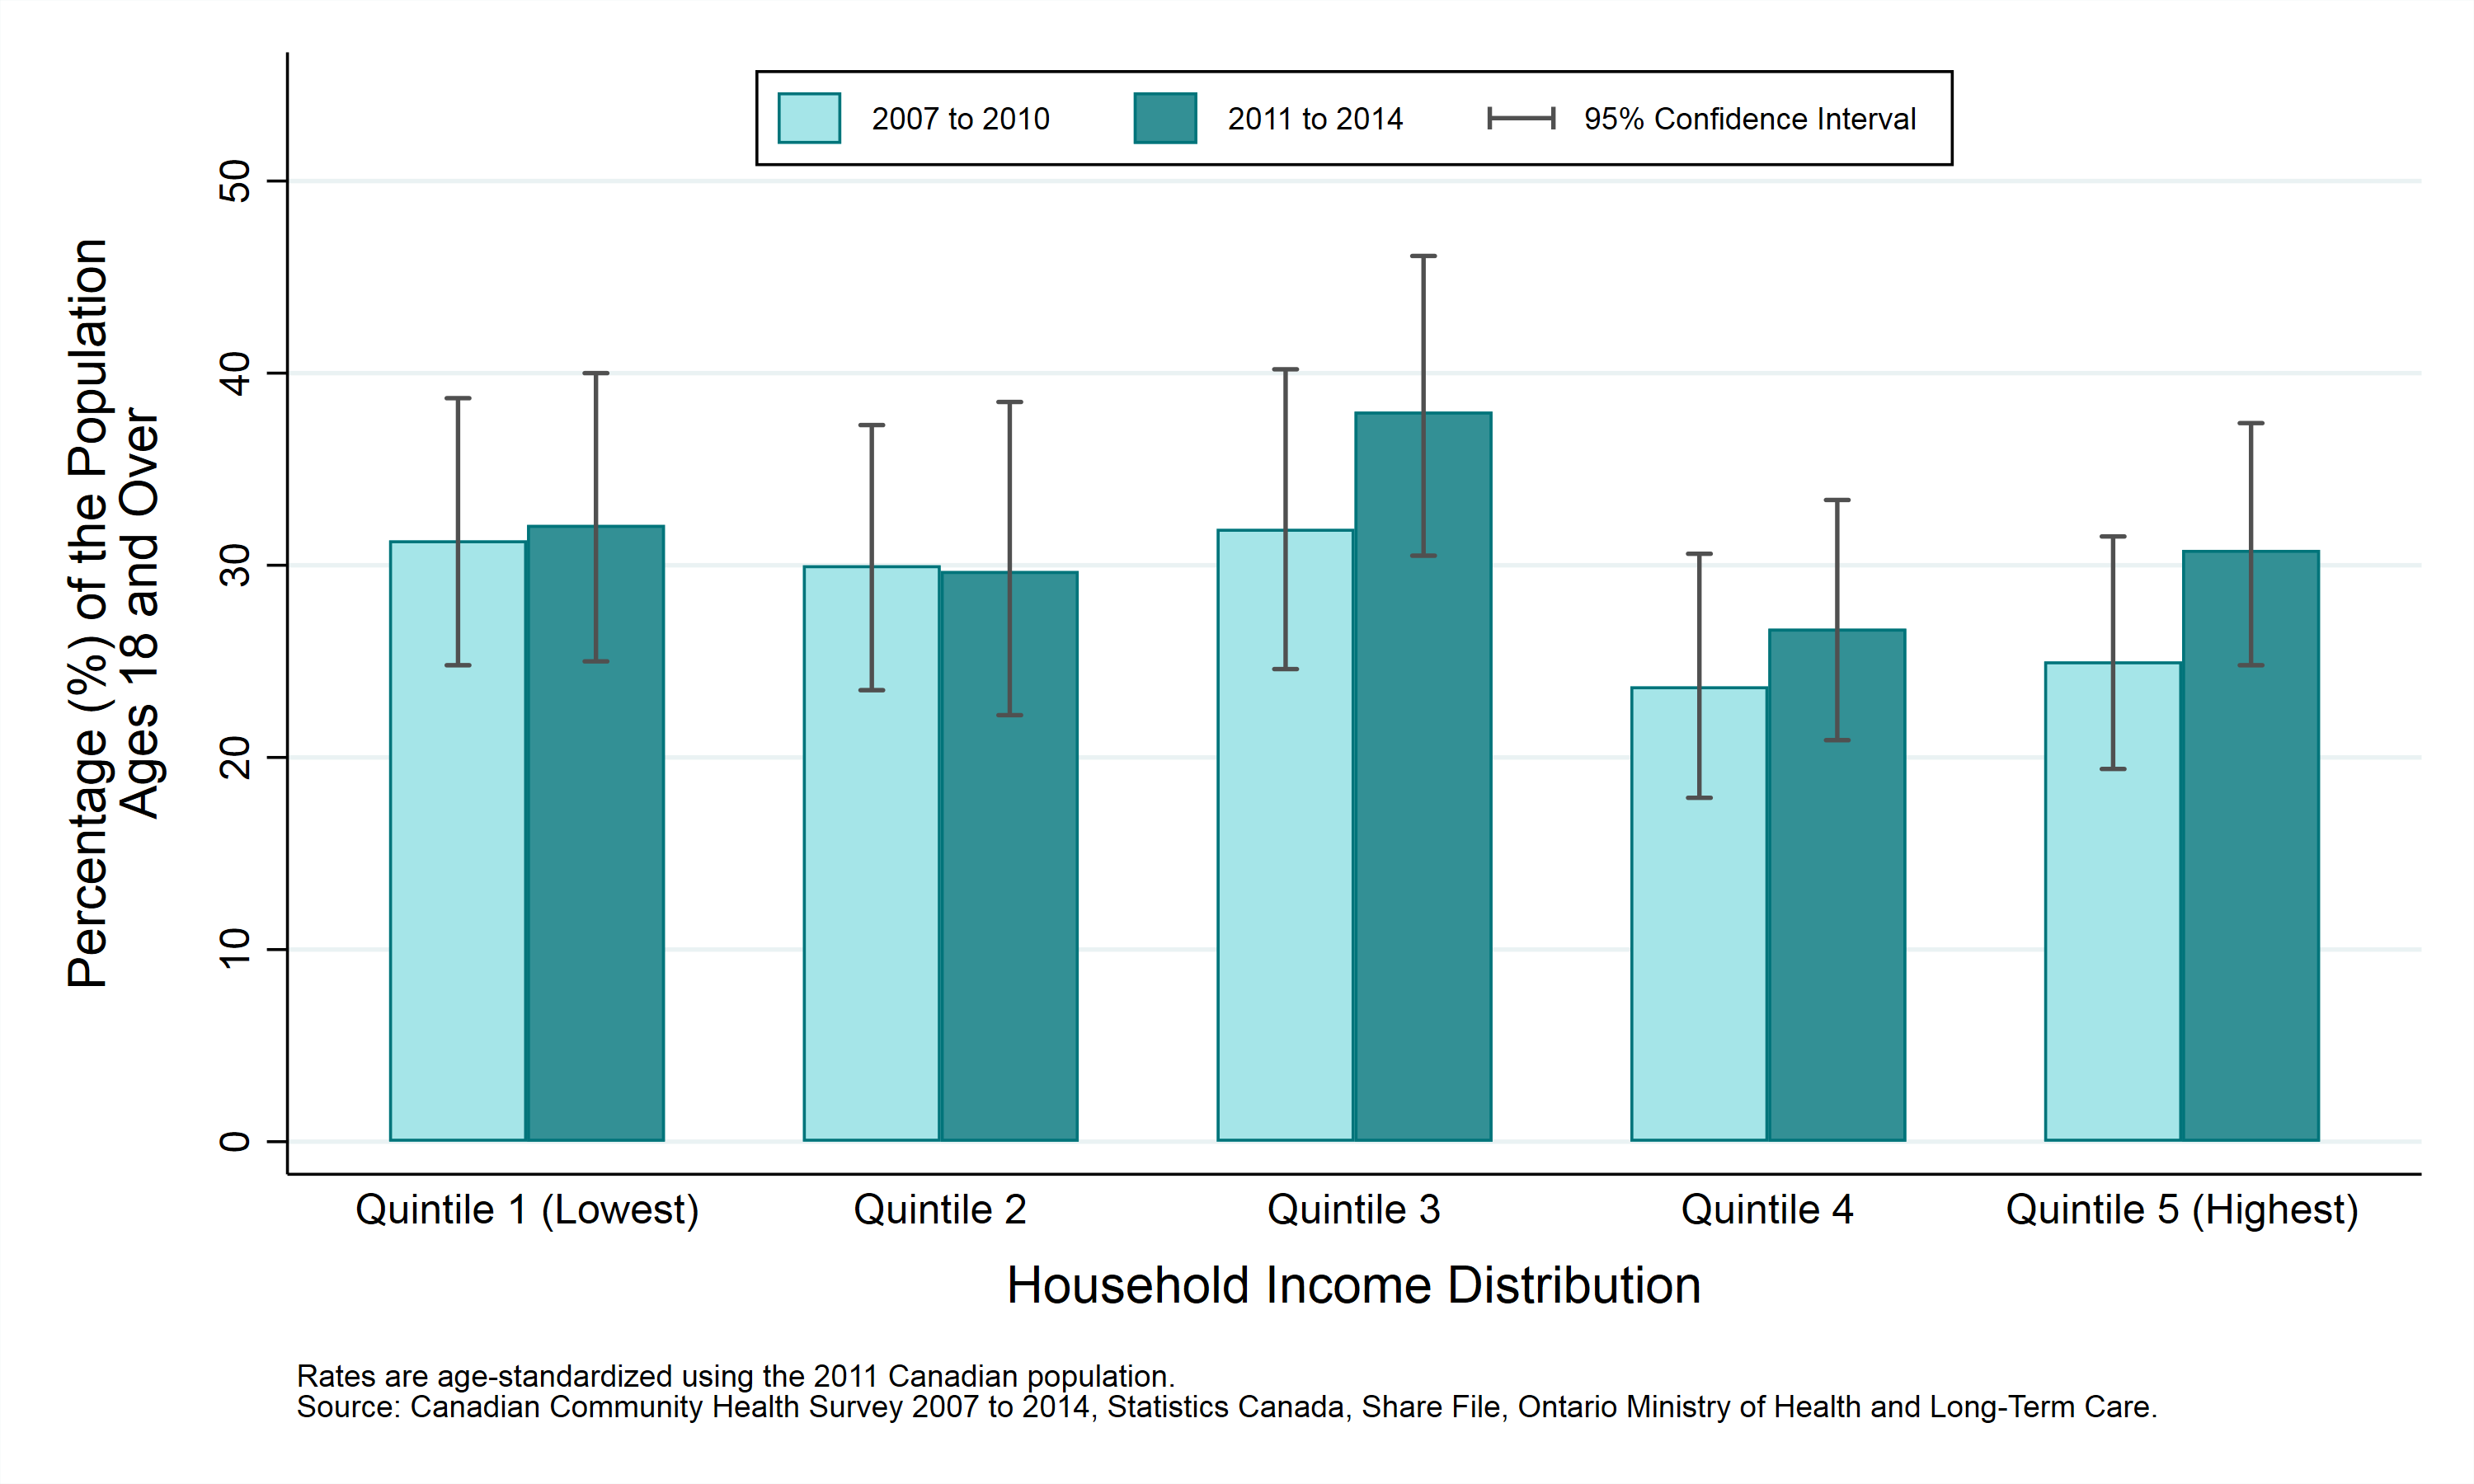
Table: Age-standardized prevalence rate, obesity (adjusted body mass index), by year and household income, ages 18+, 2007 to 2010 and 2011 to 2014
| Household Income Distribution | Prevalence Rate, 2007 to 2010 | Prevalence Rate, 2011 to 2014 |
|---|---|---|
| Quintile 1 (Lowest) | 31.3% (CI: 24.8% to 38.7%) | 32.1% (CI: 25.0% to 40.0%) |
| Quintile 2 | 30.0% (CI: 23.5% to 37.3%) | 29.7% (CI: 22.2% to 38.5%) |
| Quintile 3 | 31.9% (CI: 24.6% to 40.2%) | 38.0% (CI: 30.5% to 46.1%) |
| Quintile 4 | 23.7% (CI: 17.9% to 30.6%) | 26.7% (CI: 20.9% to 33.4%) |
| Quintile 5 (Highest) | 25.0% (CI: 19.4% to 31.5%) | 30.8% (CI: 24.8% to 37.4%) |
Obesity (adjusted body mass index) by education
Key findings:
- Between 2011 and 2014, survey results indicated that the prevalence rate of obesity was significantly lower among people with a university degree than in people with a trade, college or university diploma or certificate. No other statistical differences were observed.
- Between 2007 to 2010 and 2011 to 2014, the prevalence rate of obesity has not changed significantly within any education level group.
Notes:
- Rates are age-standardized using the 2011 Canadian Population.
- Rates are for the population aged 18 years and older, excluding pregnant women, lactating women, and persons less than 3 feet tall or greater than 6 feet 11 inches.
- Rates have been adjusted to correct for a known bias in self-reported data on height (overestimation) and weight (underestimation).
- Data source: Canadian Community Health Survey (CCHS), 2007 to 2014, Statistics Canada, Share File, Ontario Ministry of Health and Long-Term Care.
Figure: Age-standardized prevalence rate, obesity (adjusted body mass index), by year and education, ages 18+, 2007 to 2010 and 2011 to 2014
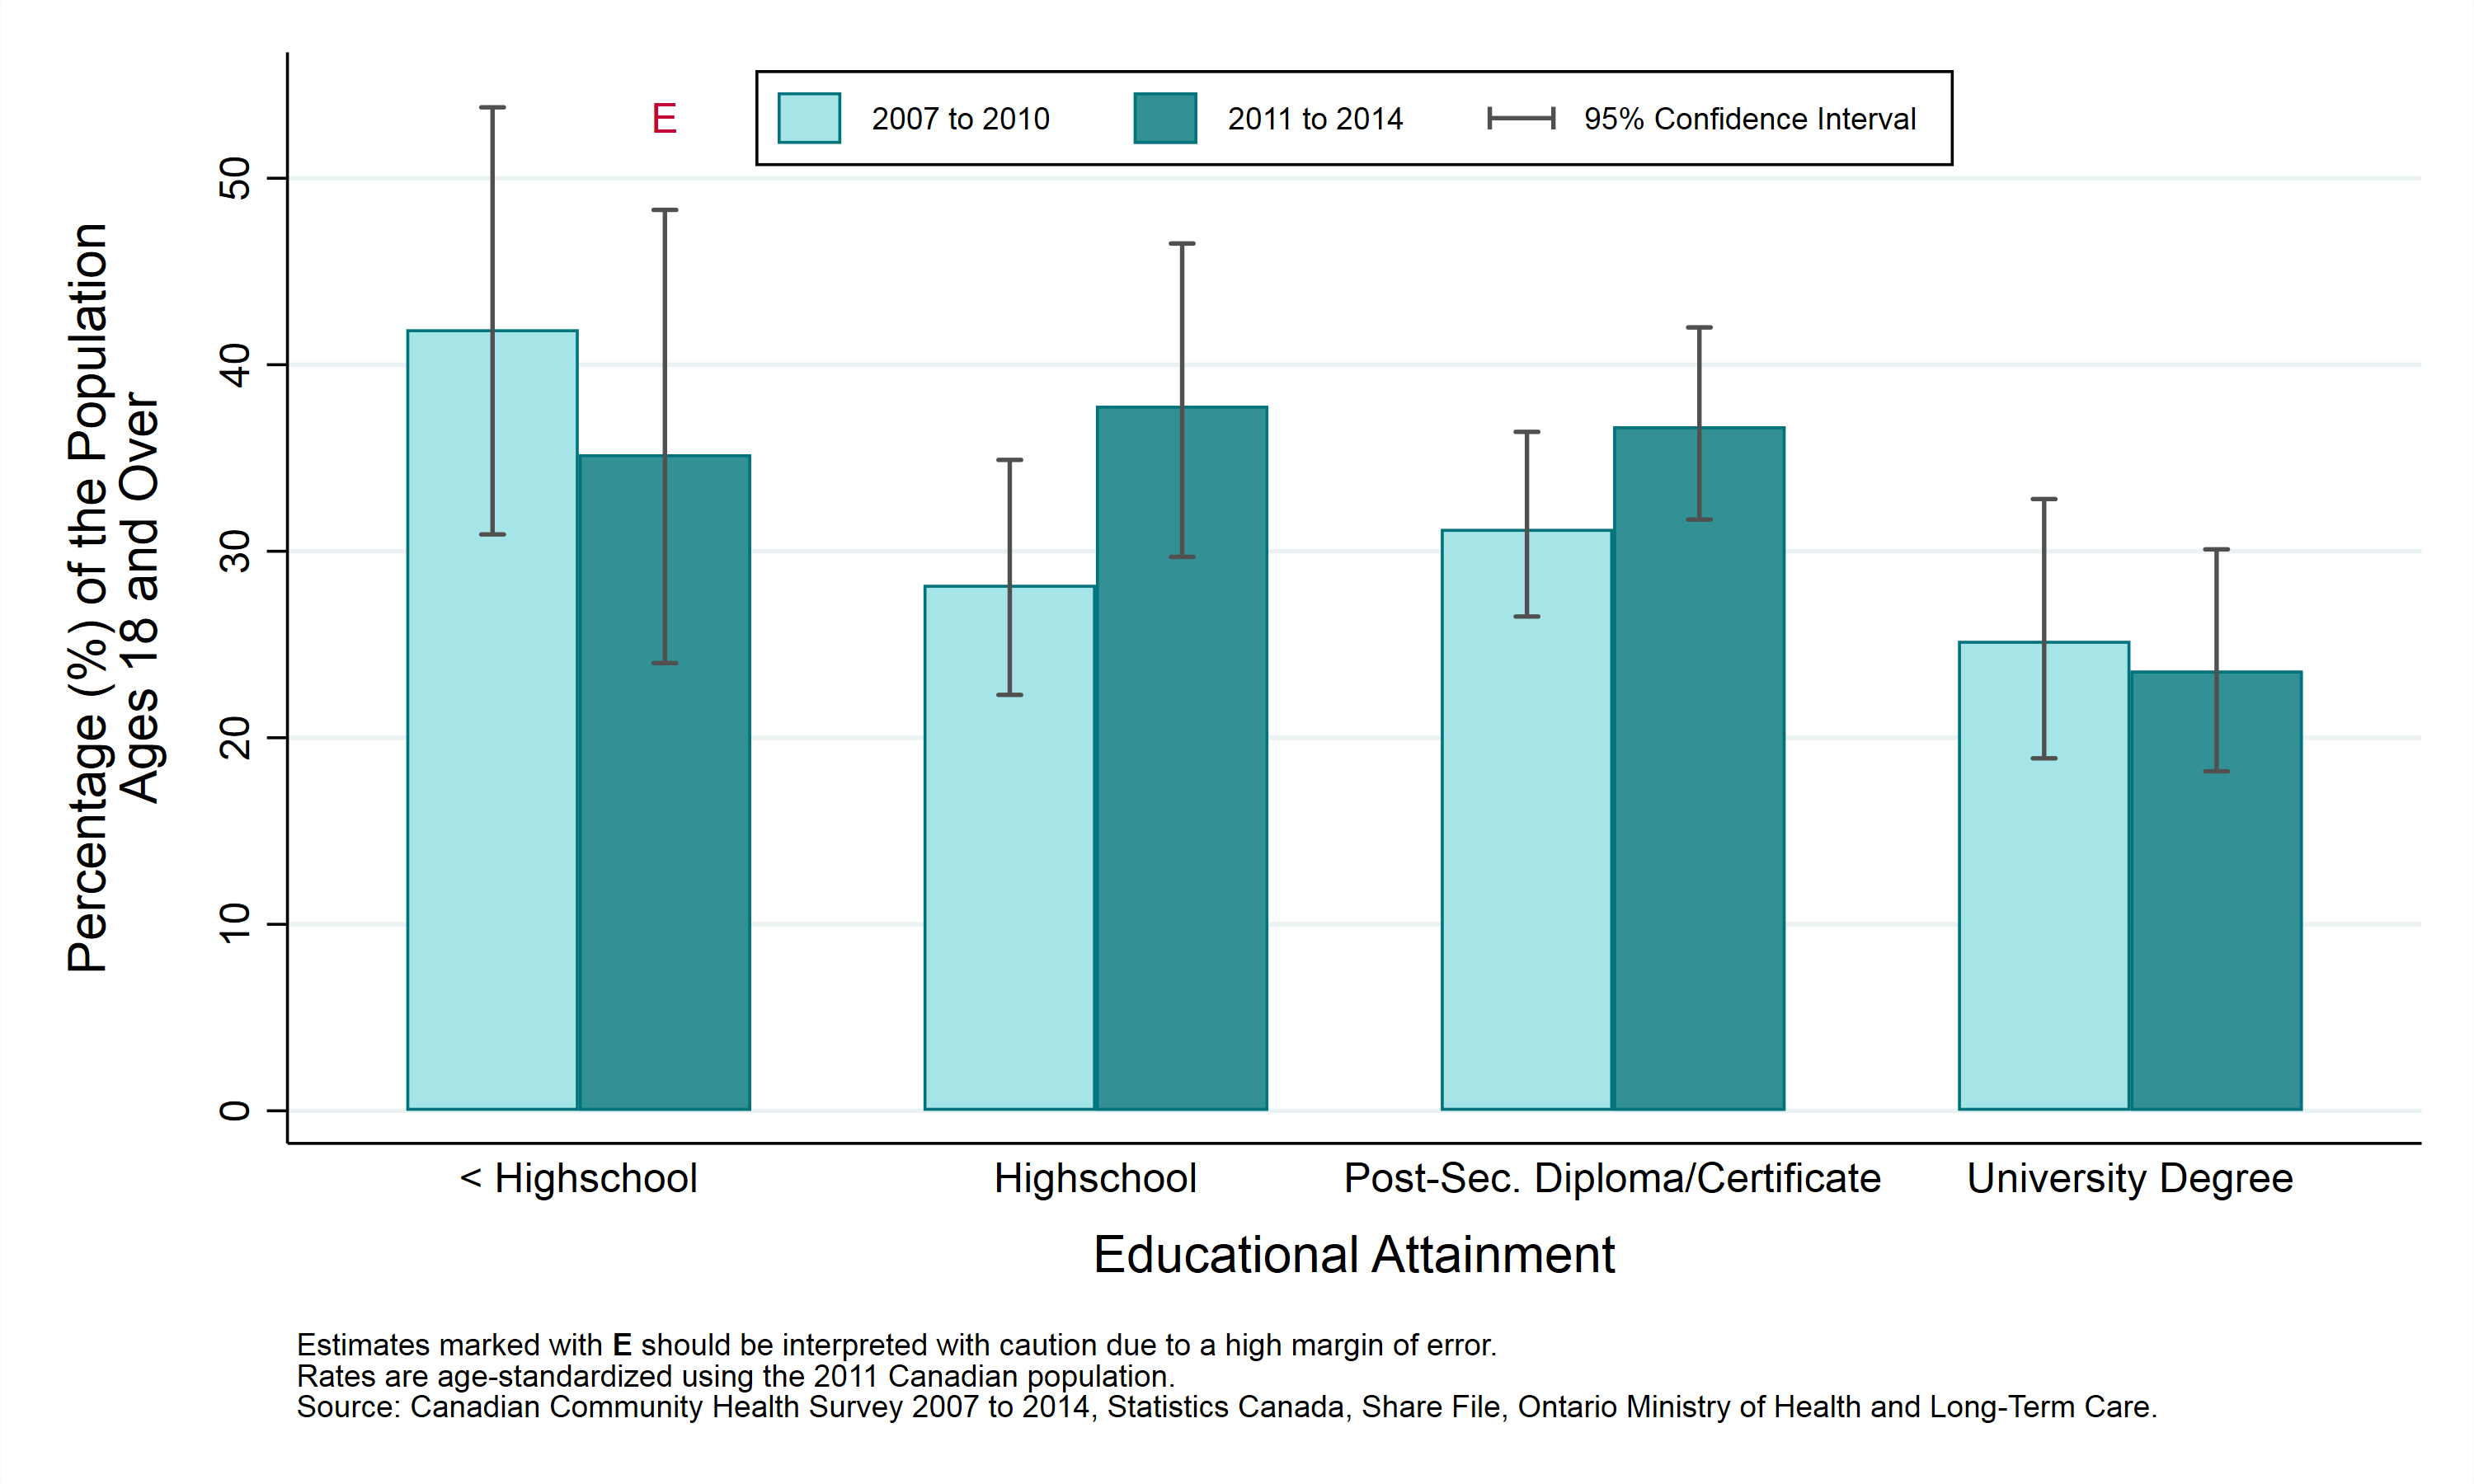
Table: Age-standardized prevalence rate, obesity (adjusted body mass index), by year and education, ages 18+, 2007 to 2010 and 2011 to 2014
| Education | Prevalence Rate, 2007 to 2010 | Prevalence Rate, 2011 to 2014 |
|---|---|---|
| < Highschool Diploma | 41.9% (CI: 30.9% to 53.8%) | 35.2% E (CI: 24.0% to 48.3%) |
| Highschool Diploma | 28.2% (CI: 22.3% to 34.9%) | 37.8% (CI: 29.7% to 46.5%) |
| Trade, College or University Diploma or Certificate | 31.2% (CI: 26.5% to 36.4%) | 36.7% (CI: 31.7% to 42.0%) |
| University Degree | 25.2% (CI: 18.9% to 32.8%) | 23.6% (CI: 18.2% to 30.1%) |
Obesity (adjusted body mass index) by first official language spoken
Key findings:
- Between 2011 and 2014, survey results indicated that the prevalence rate of obesity was not statistically different between the two official language groups in Sudbury and districts.
- Between 2007 to 2010 and 2011 to 2014, the prevalence rate of obesity has not changed significantly within either official language group.
Notes:
- Canada’s official languages are French and English. An individual’s “first official language spoken” is determined using their answers to a number of questions about the languages they speak. A small percentage of people are classified as having both French and English as their “first” official language spoken. Such individuals are included here as French. People speaking neither French nor English are excluded from this analysis.
- Rates are age-standardized using the 2011 Canadian Population.
- Rates are for the population aged 18 years and older, excluding pregnant women, lactating women, and persons less than 3 feet tall or greater than 6 feet 11 inches.
- Rates have been adjusted to correct for a known bias in self-reported data on height (overestimation) and weight (underestimation).
- Data source: Canadian Community Health Survey (CCHS), 2007 to 2014, Statistics Canada, Share File, Ontario Ministry of Health and Long-Term Care.
Figure: Age-standardized prevalence rate, obesity (adjusted body mass index), by year and first official language spoken, ages 18+, 2007 to 2010 and 2011 to 2014
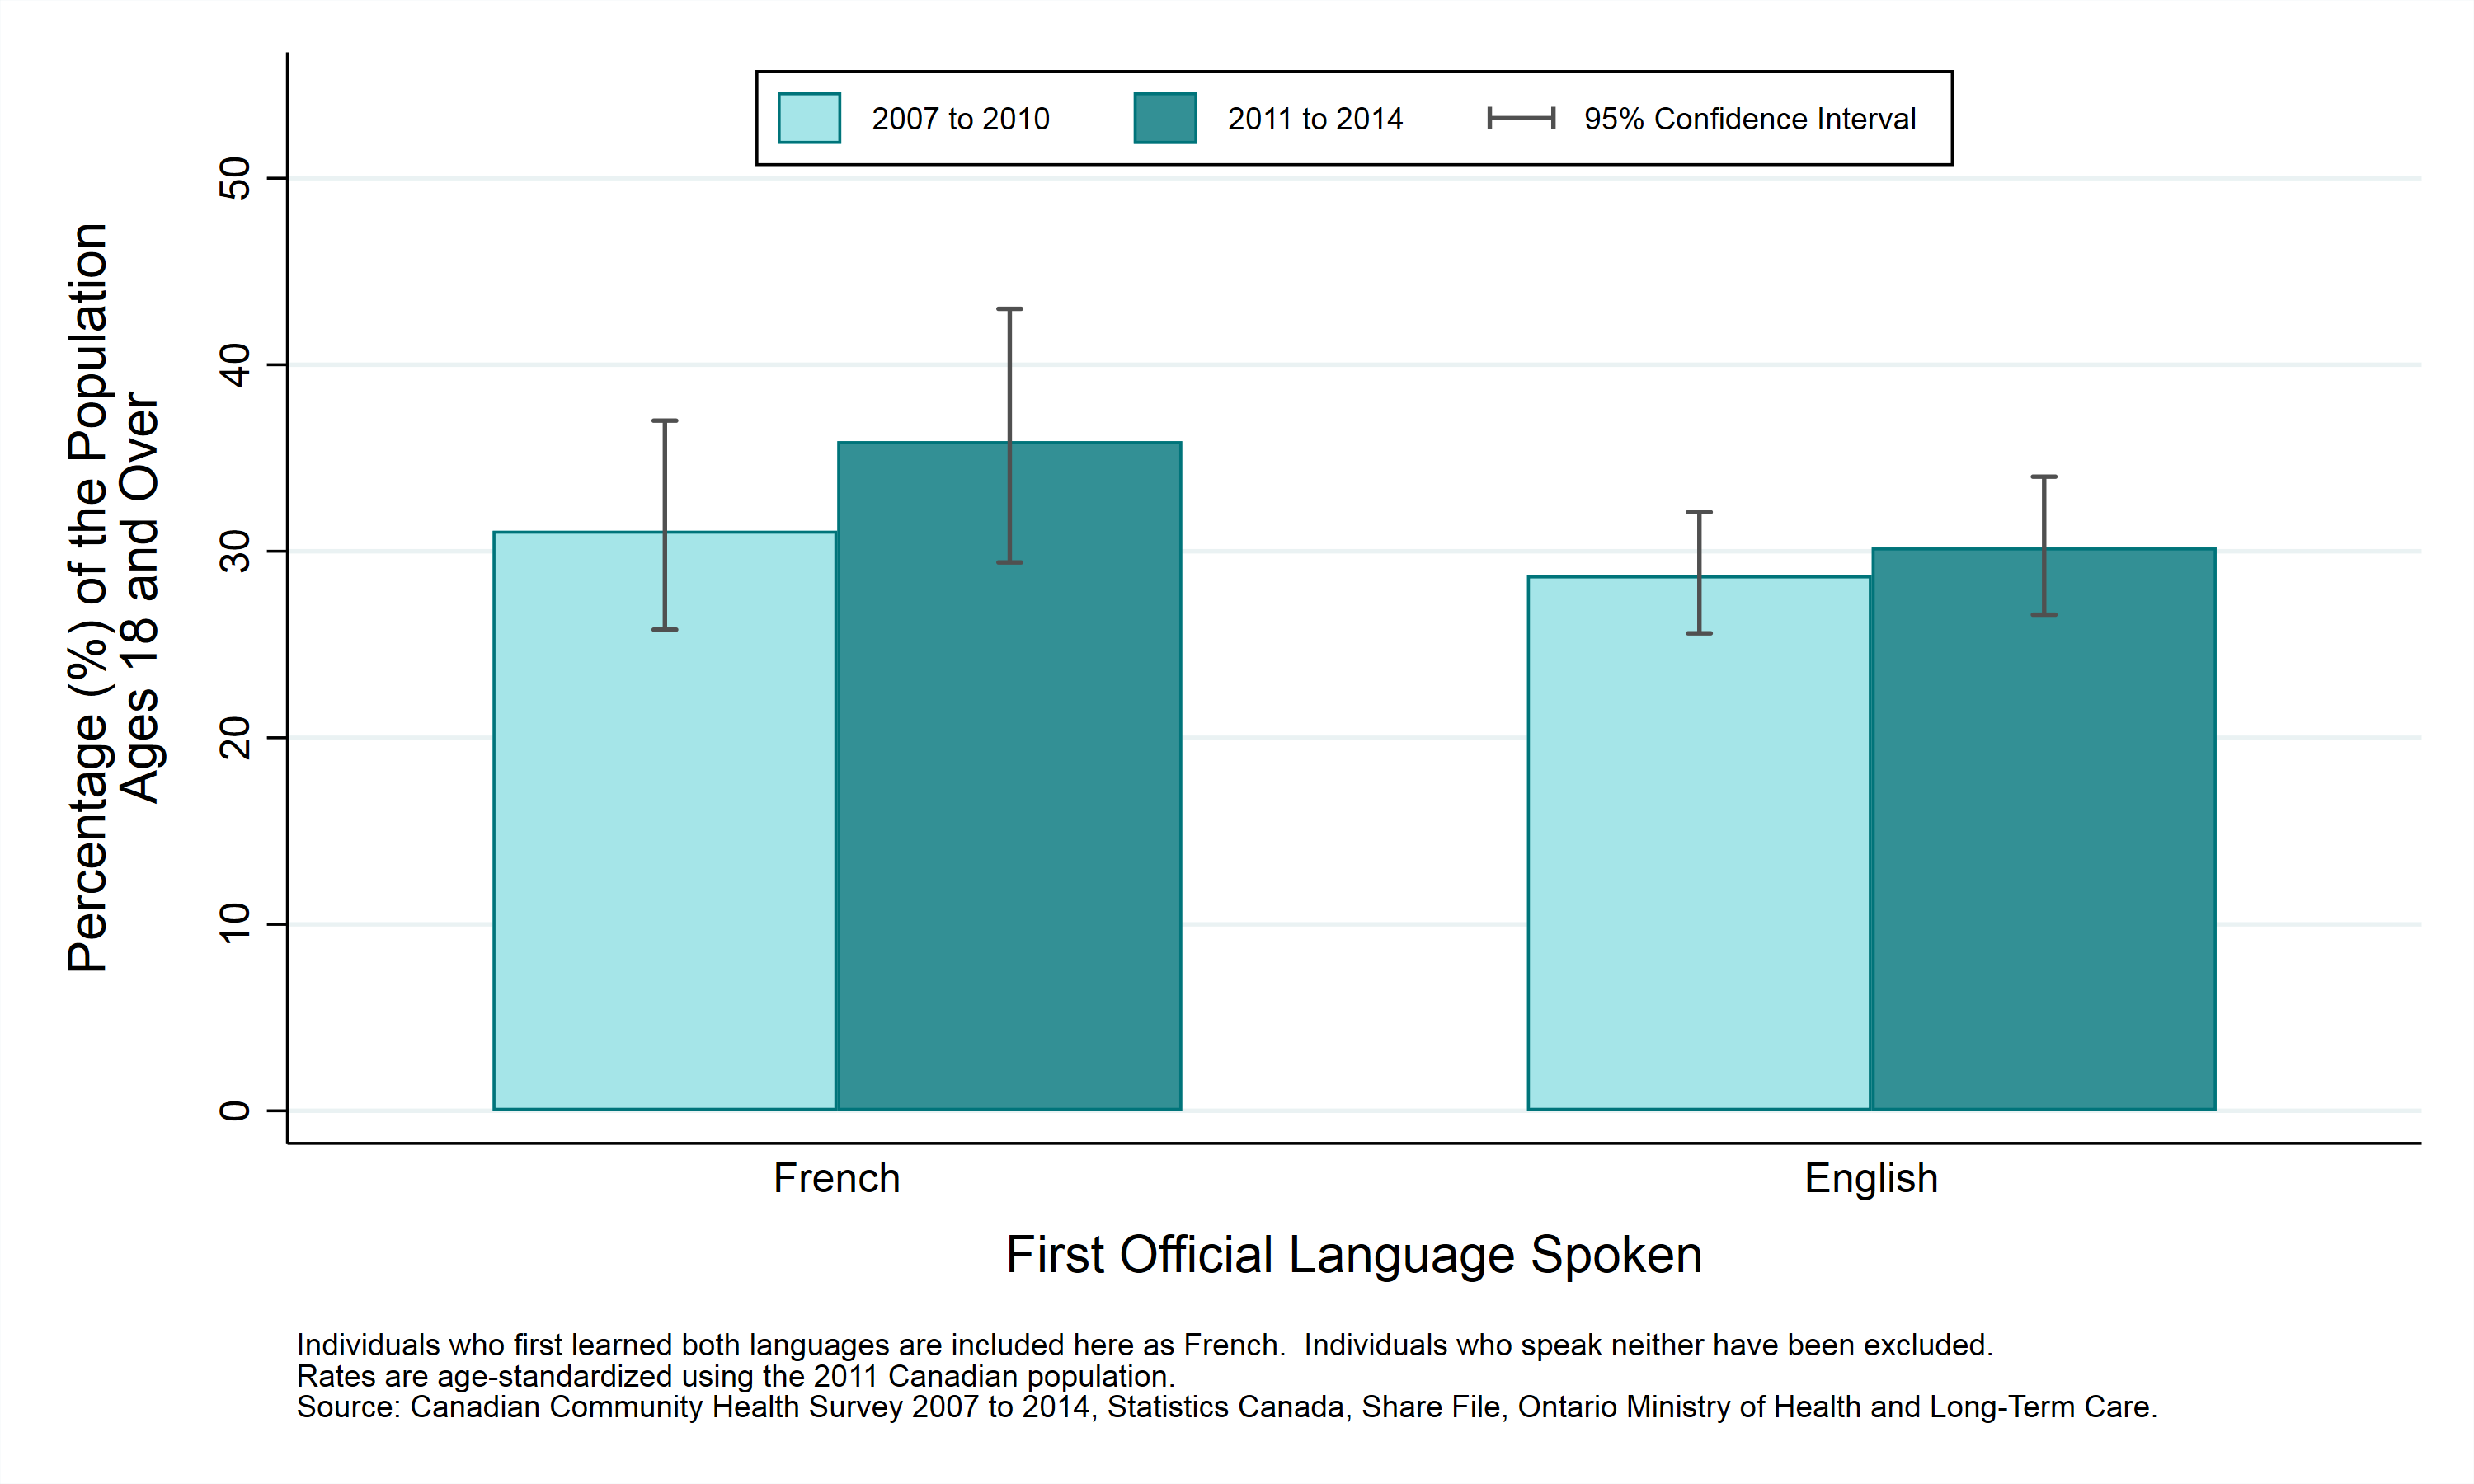
Table: Age-standardized prevalence rate, obesity (adjusted body mass index), by year and first official language spoken, ages 18+, 2007 to 2010 and 2011 to 2014
| First Official Language Spoken | Prevalence Rate, 2007 to 2010 | Prevalence Rate, 2011 to 2014 |
|---|---|---|
| French | 31.1% (CI: 25.8% to 37.0%) | 35.9% (CI: 29.4% to 43.0%) |
| English | 28.7% (CI: 25.6% to 32.1%) | 30.2% (CI: 26.6% to 34.0%) |
This item was last modified on March 13, 2019