Body Mass Index (adjusted)
Body weight is the result of a complicated set of factors, including biology, behaviours, income, society, and the environment. Engaging in health behaviours, such as eating well, being physically active and getting enough sleep, supports physical and mental well-being in people of all shapes and sizes.
BMI is calculated by dividing a person’s weight (in kilograms) by the square of their height (in meters). For adults, aged 18 and over, this score is grouped into the following categories: underweight (BMI <18.5), normal weight (BMI 18.5-24.9), overweight (BMI 25.0-29.9) and obese (BMI ≥ 30.0). Body Mass Index (BMI) is used to measure weight status at the population-level. However, weight is only one marker of health and a healthy weight is different for every person.
Body mass index scores based on self-reported height and weight are known to under-represent the true rate of overweight/obesity in the community. The rates of obesity presented in this section have been adjusted to correct for this underestimation.
Overall findings:
- In 2013/14, survey results indicated that the rate of overweight among the Sudbury and districts population aged 18 and older was 32%, while the rate of obesity was 33%.
- Between 2007/08 and 2013/14, the rate of overweight and obesity in Sudbury and districts has not changed significantly.
Notes:
- Rates are age-standardized using the 2011 Canadian population.
- Rates are for the population aged 18 years and older, excluding pregnant women, lactating women, and persons less than 3 feet tall or greater than 6 feet 11 inches.
- Rates have been adjusted to correct for a known bias in self-reported data on height (overestimation) and weight (underestimation).
- Rates of individuals classified as underweight could not be reported due to high sampling variability.
- Data source: Canadian Community Health Survey (CCHS), 2007 to 2014, Statistics Canada, Share File, Ontario Ministry of Health and Long-Term Care.
Figure: Age-standardized prevalence rate, body mass index (BMI) categories, Sudbury and districts, by year, ages 18 and older, 2007/08 to 2013/14
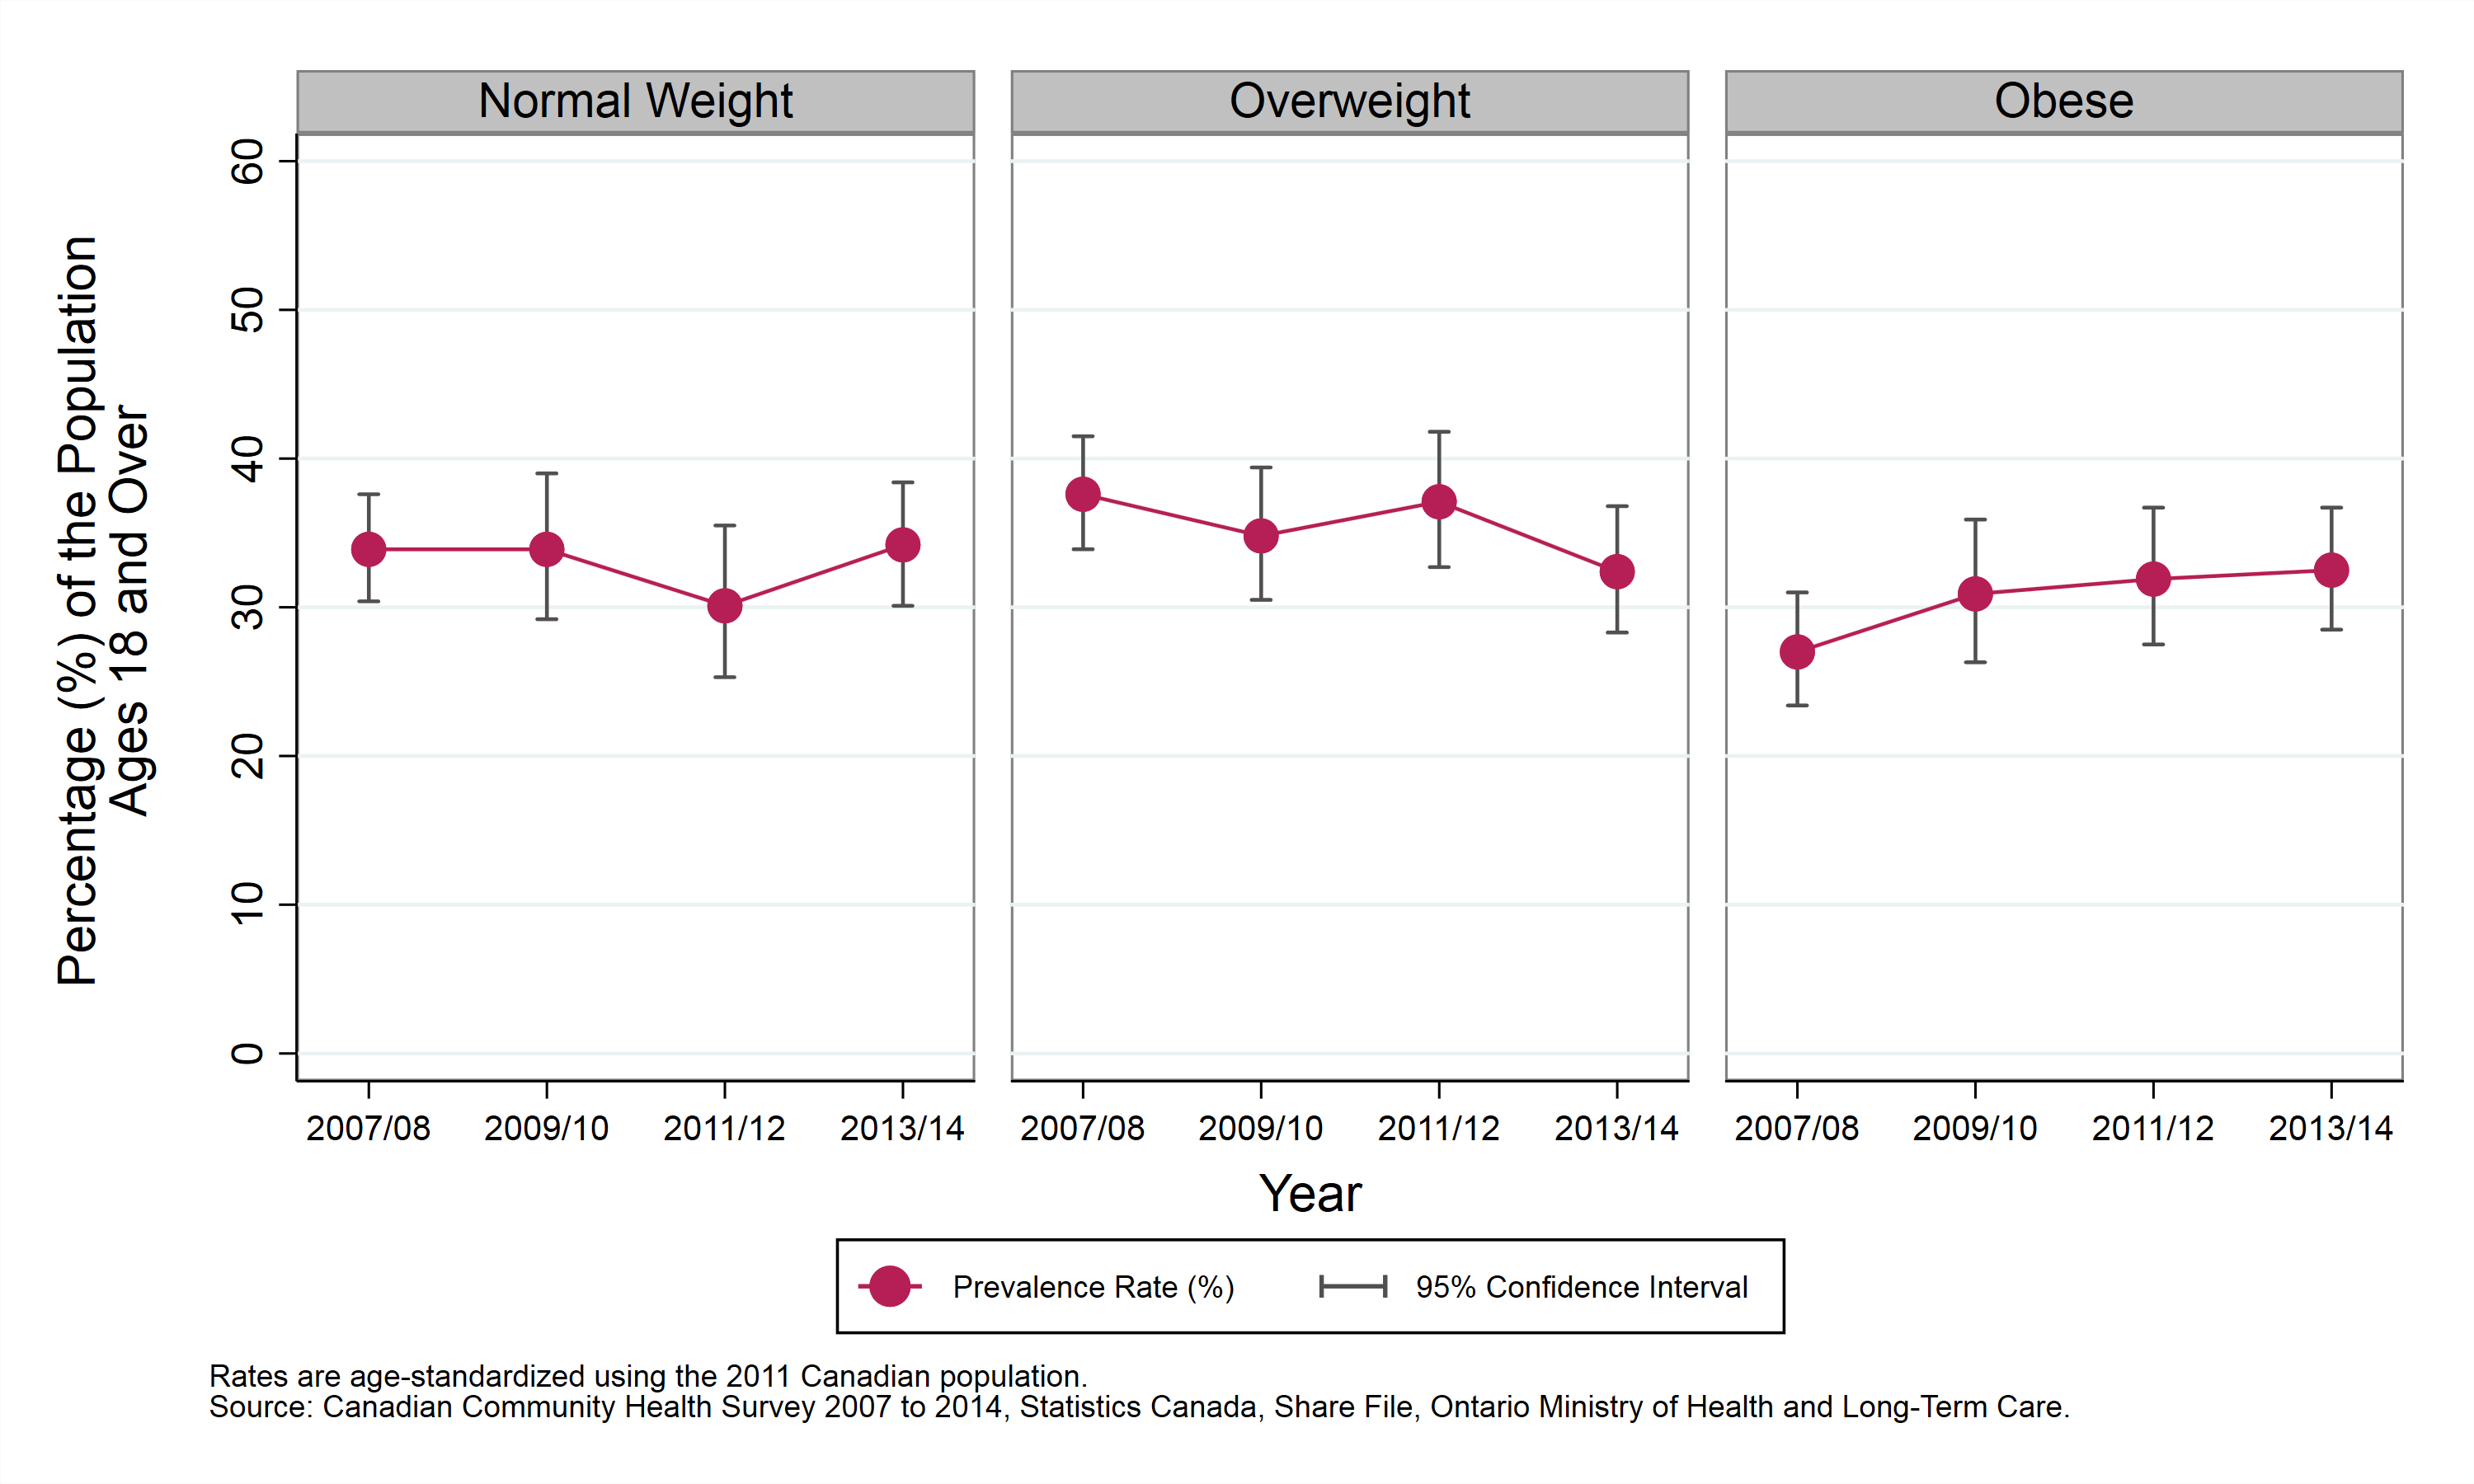
Table: Age-standardized prevalence rate, body mass index (BMI) categories, Sudbury and districts, by year, ages 18 and older, 2007/08 to 2013/14
| BMI Category | Prevalence Rate |
|---|---|
| Overweight | 34.9% (CI: 30.5% to 39.5%) |
| Obese | 32.7% (CI: 28.4% to 37.3%) |
This item was last modified on May 30, 2022