Assault
Injuries in this section include those resulting from an attempt by one or more persons to harm another person, through any means. Injuries due to legal interventions and operations of war are excluded.
Emergency department (ED) visits due to assault by geographic region
Key Findings:
- Among residents of the Sudbury & District Health Unit (SDHU) area, there were 568 emergency department (ED) visits due to assault in 2015.
- In 2015, the ED visits rate due to assault in the SDHU area was 299 per 100,000 population per year.
- The rate of ED visits due to assault in the SDHU area has been consistently lower than that of northeastern Ontario, yet both the SDHU area and northeastern Ontario rates are higher than the rate for Ontario overall.
- Between 2006 and 2015, the ED visits rate due to assault in the SDHU area decreased.
Notes:
- Geographic areas and/or time periods in which there is less access to walk-in clinics and other alternatives to the local ED can be expected to have higher rates of injury-related ED visits than they would otherwise.
- Rates are age-standardized using the 2011 Canadian population.
- Data Source: Ambulatory Emergency External Cause 2006 to 2015 (extracted June 6, 2016) and Population Estimates 2006 to 2015 (extracted October 7, 2016), Ontario Ministry of Health and Long-Term Care, IntelliHEALTH Ontario.
Figure: Annual age-standardized rate of emergency department visits, assault, by geographic region, 2006 to 2015
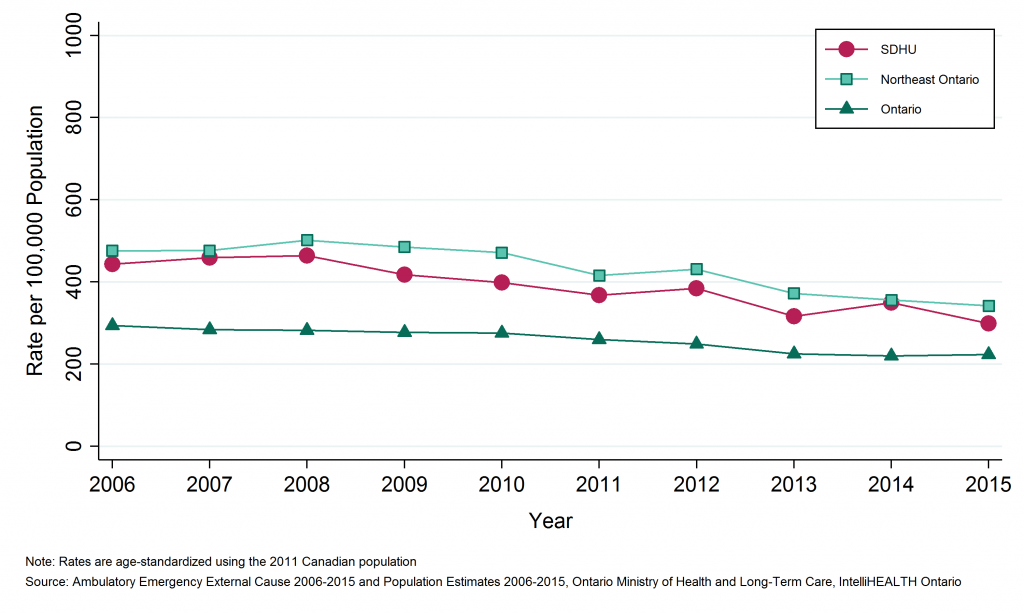
Table: Annual age-standardized rate of emergency department visits, assault, by geographic region, 2006 to 2015
| Geographic Region | 2006 | 2007 | 2008 | 2009 | 2010 | 2011 | 2012 | 2013 | 2014 | 2015 |
| SDHU | 443.1 | 459.5 | 464.6 | 417.9 | 399.0 | 368.3 | 384.7 | 316.3 | 349.3 | 299.0 |
| Northeast | 476.1 | 476.3 | 501.8 | 485.2 | 471.4 | 415.9 | 431.4 | 372.4 | 356.1 | 342.1 |
| Ontario | 294.1 | 284.4 | 282.3 | 277.7 | 275.7 | 260.3 | 249.5 | 225.2 | 219.9 | 223.5 |
Table: Annual number of emergency department visits, assault, by geographic region, 2006 to 2015
| Geographic Region | 2006 | 2007 | 2008 | 2009 | 2010 | 2011 | 2012 | 2013 | 2014 | 2015 |
| SDHU | 892 | 925 | 934 | 840 | 788 | 723 | 754 | 614 | 672 | 568 |
| Northeast | 2,678 | 2,668 | 2,781 | 2,672 | 2,558 | 2,247 | 2,306 | 1,965 | 1,865 | 1,761 |
| Ontario | 39,208 | 38,049 | 37,929 | 37,410 | 37,401 | 35,529 | 34,327 | 31,065 | 30,535 | 31,088 |
Emergency department (ED) visits due to assault by Greater Sudbury and outlying areas
Key Findings:
- Between 2011 and 2015, there were 2,442 emergency department (ED) visits due to assault among residents of Greater Sudbury and 889 among residents of the SDHU district office areas, an average of 488 and 178 per year, respectively.
- The rate of ED visits due to assault was 297 per 100,000 population per year in Greater Sudbury and 627 per 100,000 population per year in the SDHU district office areas between 2011 and 2015.
- The rate of ED visits due to assault among residents of Greater Sudbury has been consistently lower than among residents in the SDHU district office areas.
- The rates of ED visits due to assault among residents in both areas decreased between 2006 to 2010 and 2011 to 2015.
Notes:
- Geographic areas and/or time periods in which there is less access to walk-in clinics and other alternatives to the local ED can be expected to have higher rates of injury-related ED visits than they would otherwise.
- Rates are age-standardized using the 2011 Canadian population.
- Data Source: Ambulatory Emergency External Cause 2006 to 2015 (extracted June 6, 2016) and Population Estimates 2006 to 2015 (extracted October 7, 2016), Ontario Ministry of Health and Long-Term Care, IntelliHEALTH Ontario.
Figure: Annual age-standardized rate of emergency department visits, assault, by Greater Sudbury and outlying areas, 2006 to 2010 and 2011 to 2015
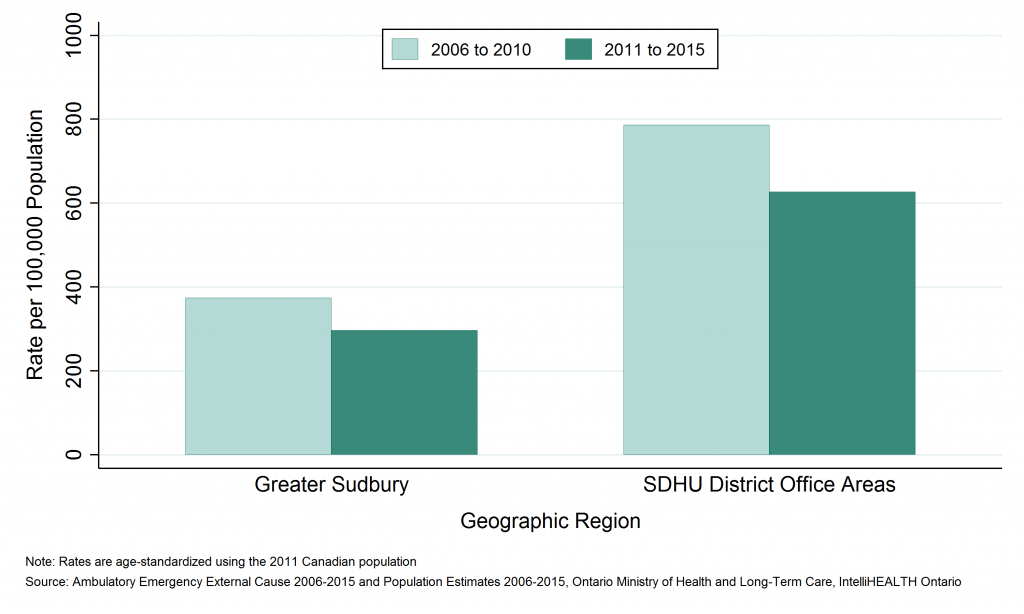
Table: Annual age-standardized rate of emergency department visits, assault, by Greater Sudbury and outlying areas, 2006 to 2010 and 2011 to 2015
| Geographic Region | Rate per 100000 2006 to 2010 | Rate per 100000 2011 to 2015 |
| Greater Sudbury | 374.0 | 296.6 |
| SDHU District Office Areas | 786.5 | 626.8 |
Table: Annual number of emergency department visits, assault, by Greater Sudbury and outlying areas, 2006 to 2010 and 2011 to 2015
| Geographic Region | Total Counts, 2006 to 2010 | Total Counts, 2011 to 2015 | Average Annual Counts, 2006 to 2010 | Average Annual Counts, 2011 to 2015 |
| Greater Sudbury | 3,155 | 2,442 | 631.0 | 488.4 |
| SDHU District Office Areas | 1,224 | 889 | 244.8 | 177.8 |
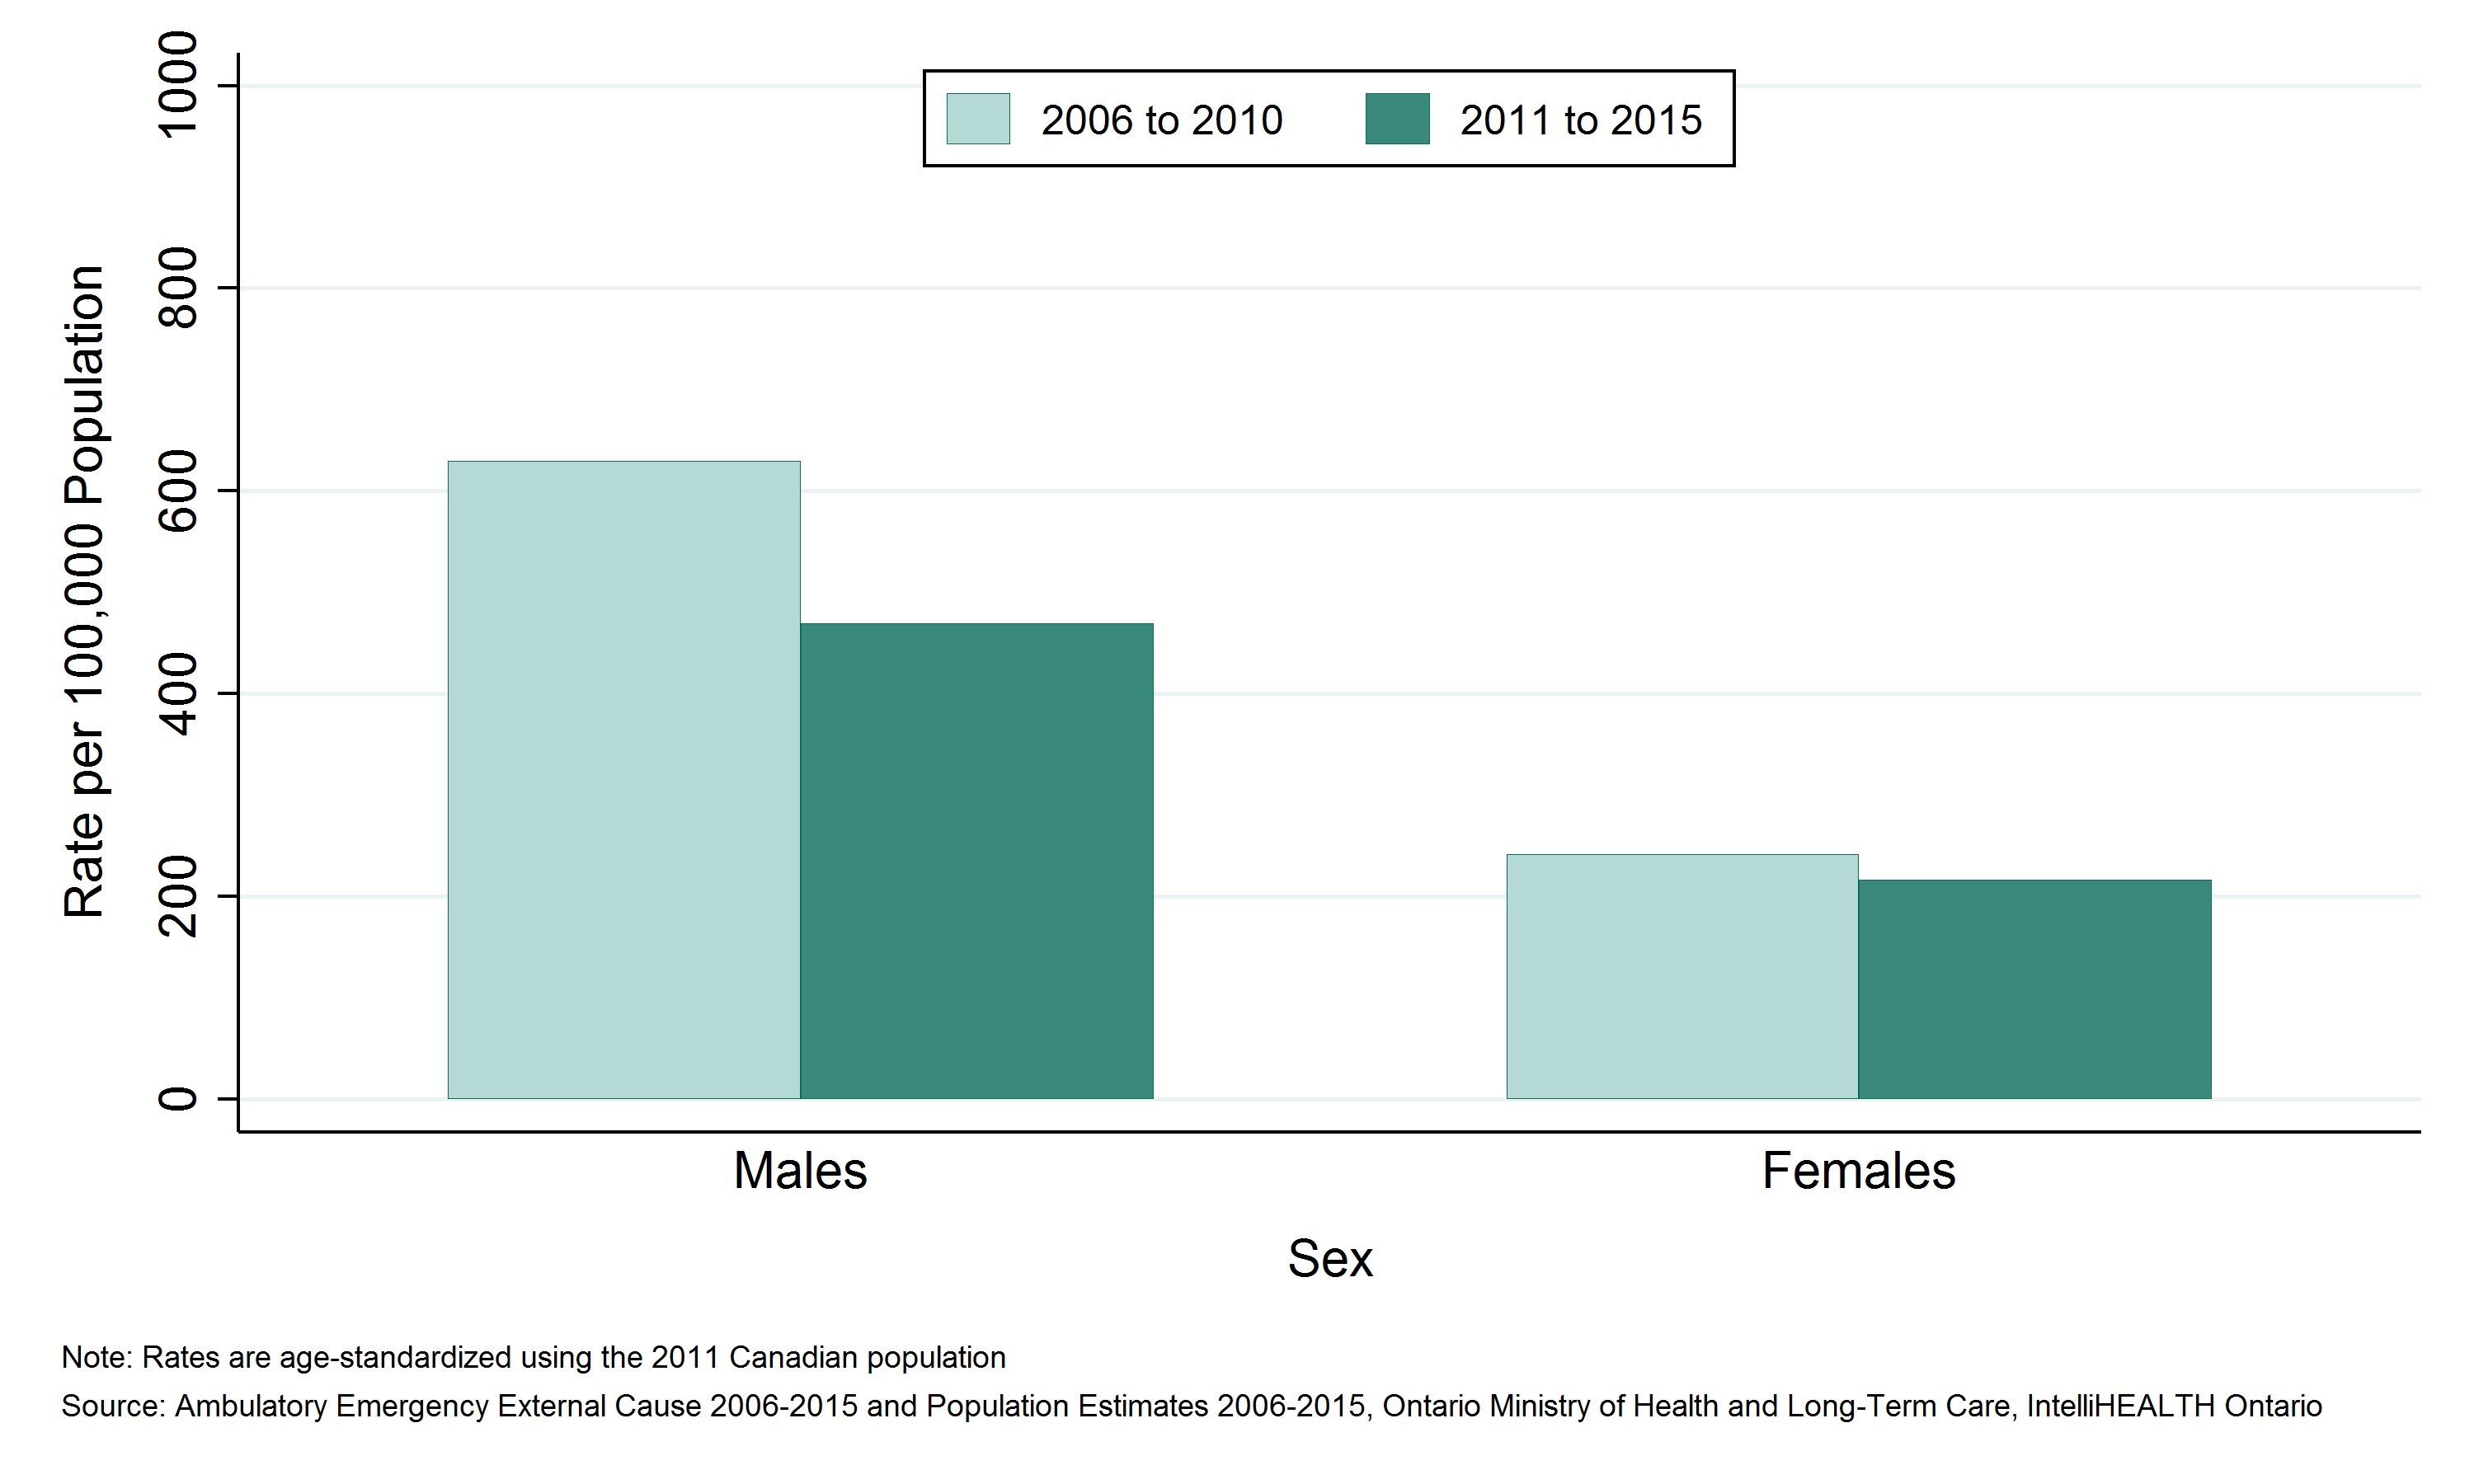
Emergency department (ED) visits due to assault by sex
Key Findings:
- Between 2011 and 2015, there were 2,292 emergency department (ED) visits due to assault among males, and 1,039 among females in the Sudbury & District Health Unit (SDHU) area, an average of 458 and 208 per year, respectively.
- The rate of ED visits due to assault was 469 per 100,000 males per year and 217 per 100,000 females per year in the SDHU area in 2015.
- The ED visits rate due to assault among males has been consistently higher than the rate among females.
- In the SDHU area, the rate of ED visits due to assault decreased among males over time between 2006 to 2010 and 2011 to 2015, while the rate among females remained stable.
Notes:
- Geographic areas and/or time periods in which there is less access to walk-in clinics and other alternatives to the local ED can be expected to have higher rates of injury-related ED visits than they would otherwise.
- Rates are age-standardized using the 2011 Canadian population.
- Data Source: Ambulatory Emergency External Cause 2006 to 2015 (extracted June 6, 2016) and Population Estimates 2006 to 2015 (extracted October 7, 2016), Ontario Ministry of Health and Long-Term Care, IntelliHEALTH Ontario.
Figure: Annual age-standardized rate of emergency department visits, assault, by sex, SDHU, 2006 to 2010 and 2011 to 2015

Table: Annual age-standardized rate of emergency department visits, assault, by sex, SDHU, 2006 to 2010 and 2011 to 2015
| Sex | Rate per 100,000, 2006 to 2010 | Rate per 100,000, 2011 to 2015 |
| Males | 629.4 | 469.1 |
| Females | 242.0 | 216.5 |
Table: Annual number of emergency department visits, assault, by sex, SDHU, 2006 to 2010 and 2011 to 2015
| Sex | Total Counts, 2006 to 2010 | Total Counts, 2011 to 2015 | Average Annual Counts, 2006 to 2010 | Average Annual Counts, 2011 to 2015 |
| Males | 3,171 | 2,292 | 634.2 | 458.4 |
| Females | 1,208 | 1,039 | 241.6 | 207.8 |
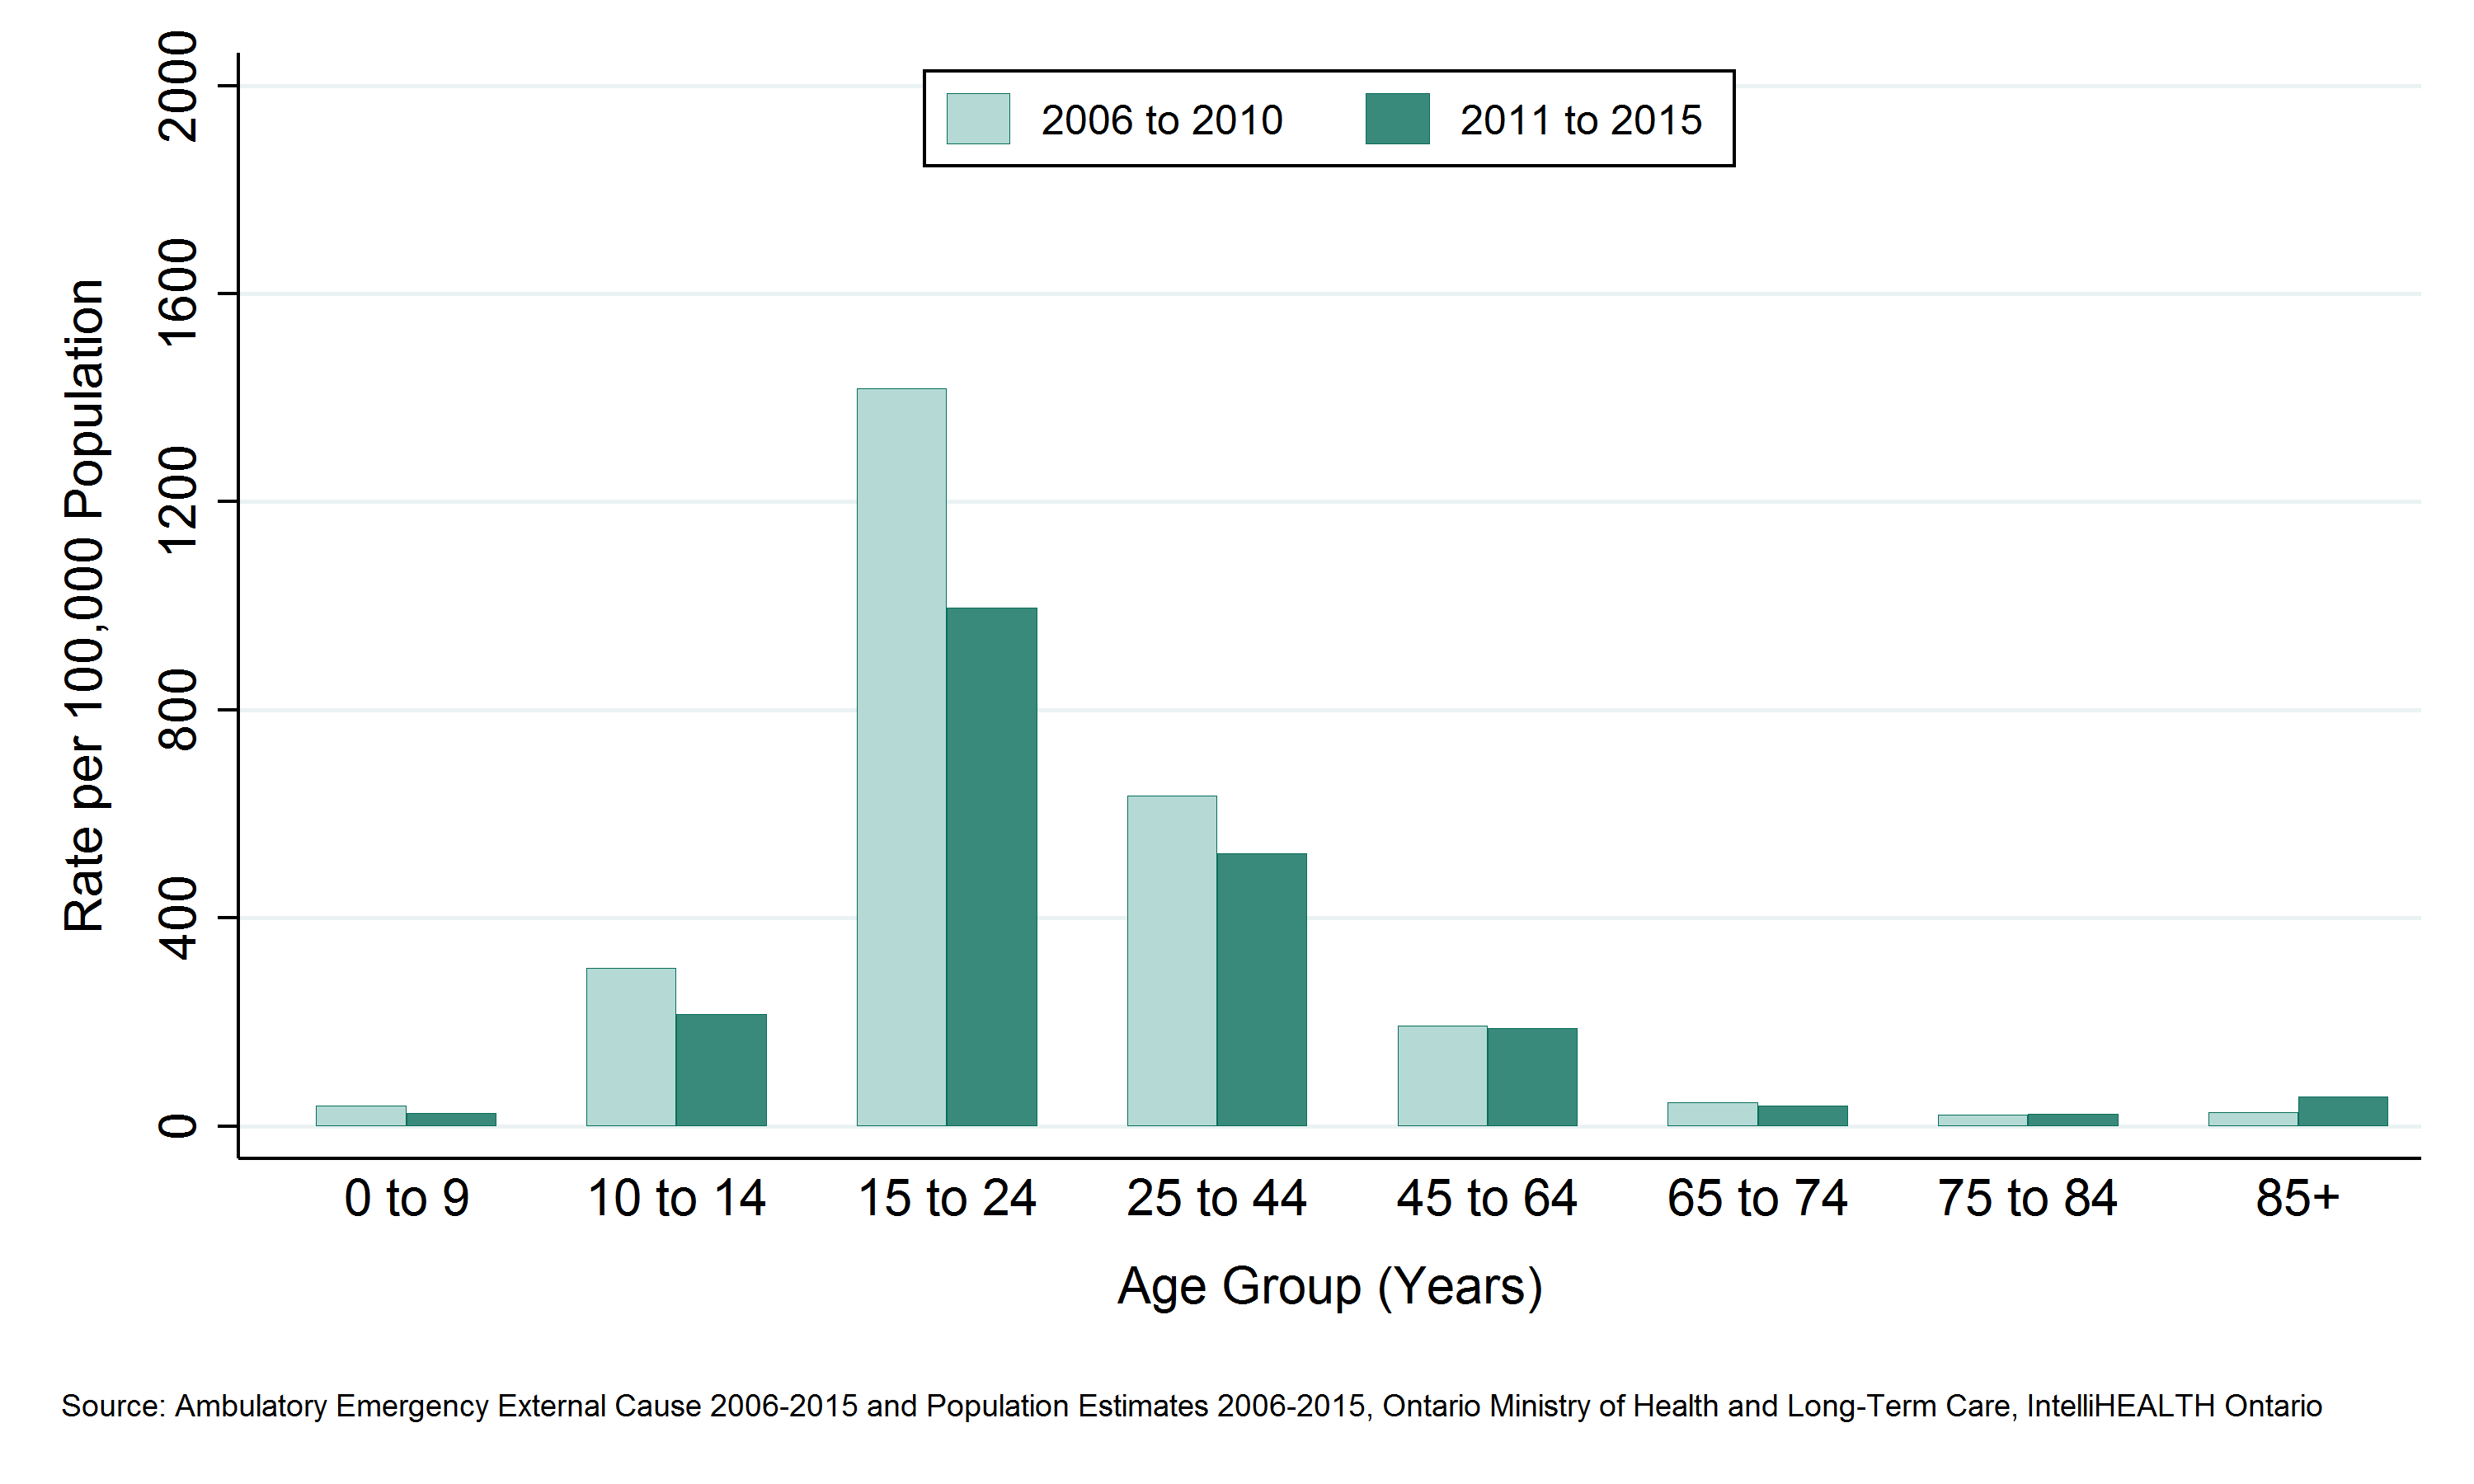
Emergency department (ED) visits due to assault by age group
Key Findings:
- Among residents of the Sudbury & District Health Unit (SDHU) area, the 15 to 24 and 45 to 64 year age groups visited the emergency department (ED) due to assault the most, with 1,282 and 1,280 ED visits respectively between 2011 and 2015, or 256 ED visits per year on average.
- Between 2011 and 2015, the 15 to 24 age group had the highest ED visits rate due to assault with 996 ED visits per 100,000 population per year.
- Rates of ED visits due to assault increase dramatically in ages 15 to 24, then decrease with age.
- In the SDHU area, the ED visits rate due to assault decreased over time in the 10 to 14, 15 to 24 and 25 to 44 year age groups between 2006 to 2010 and 2011 to 2015. They have remained stable for all other age groups.
Notes:
- Geographic areas and/or time periods in which there is less access to walk-in clinics and other alternatives to the local ED can be expected to have higher rates of injury-related ED visits than they would otherwise.
- Data Source: Ambulatory Emergency External Cause 2006 to 2015 (extracted June 6, 2016) and Population Estimates 2006 to 2015 (extracted October 7, 2016), Ontario Ministry of Health and Long-Term Care, IntelliHEALTH Ontario.
Figure: Annual rate of emergency department visits, assault, by age group, SDHU, 2006 to 2010 and 2011 to 2015

Table: Annual rate of emergency department visits, assault, by age group, SDHU, 2006 to 2010 and 2011 to 2015
| Age Group | Rate per 100000, 2006 to 2010 | Rate per 100000, 2011 to 2015 |
| 0 to 9 | 38.5 | 25.0 |
| 10 to 14 | 304.6 | 215.1 |
| 15 to 24 | 1,417.3 | 995.8 |
| 25 to 44 | 634.7 | 523.7 |
| 45 to 64 | 193.1 | 187.9 |
| 65 to 74 | 44.9 | 39.8 |
| 75 to 84 | 21.0 | 23.9 |
| 85+ | 26.0 | 56.0 |
Table: Annual rate of emergency department visits, assault, by age group, SDHU, 2006 to 2010 and 2011 to 2015
| Age Group | Total Counts, 2006 to 2010 | Total Counts, 2011 to 2015 | Average Annual Counts, 2006 to 2010 | Average Annual Counts, 2011 to 2015 |
| 0 to 9 | 38 | 24 | 7.6 | 4.8 |
| 10 to 14 | 184 | 111 | 36.8 | 22.2 |
| 15 to 24 | 1,885 | 1,282 | 377.0 | 256.4 |
| 25 to 44 | 1,645 | 1,280 | 329.0 | 256.0 |
| 45 to 64 | 574 | 571 | 114.8 | 114.2 |
| 65 to 74 | 38 | 39 | 7.6 | 7.8 |
| 75 to 84 | 11 | 13 | 2.2 | 2.6 |
| 85+ | 4 | 11 | 0.8 | 2.2 |
Deaths due to assault by geographic region
Key Findings:
- Among residents of the Sudbury & District Health Unit (SDHU) area, there was 22 deaths due to assault between 2007 and 2011, an average of 4 per year.
- Between 2006 and 2015, the mortality rate due to assault in the SDHU area was 2 deaths per 100,000 population per year.
- The mortality rates due to assault in the SDHU area, northeastern Ontario, and Ontario overall were similar.
- Between 2002 to 2006 and 2007 to 2011, the mortality rate due to assault in the SDHU area increased slightly.
Notes:
- Deaths in this section include those resulting from an attempt by one or more persons to harm another person, through any means.
Rates are age-standardized using the 2011 Canadian population.
- Data Source: Ontario Mortality Data 2002 to 2011 (extracted June 6, 2016) and Population Estimates 2006 to 2015 (extracted October 7, 2016), Ontario Ministry of Health and Long-Term Care, IntelliHEALTH Ontario.
Figure: Annual age-standardized mortality rate, assault, by geographic region, 2002 to 2006 and 2007 to 2011
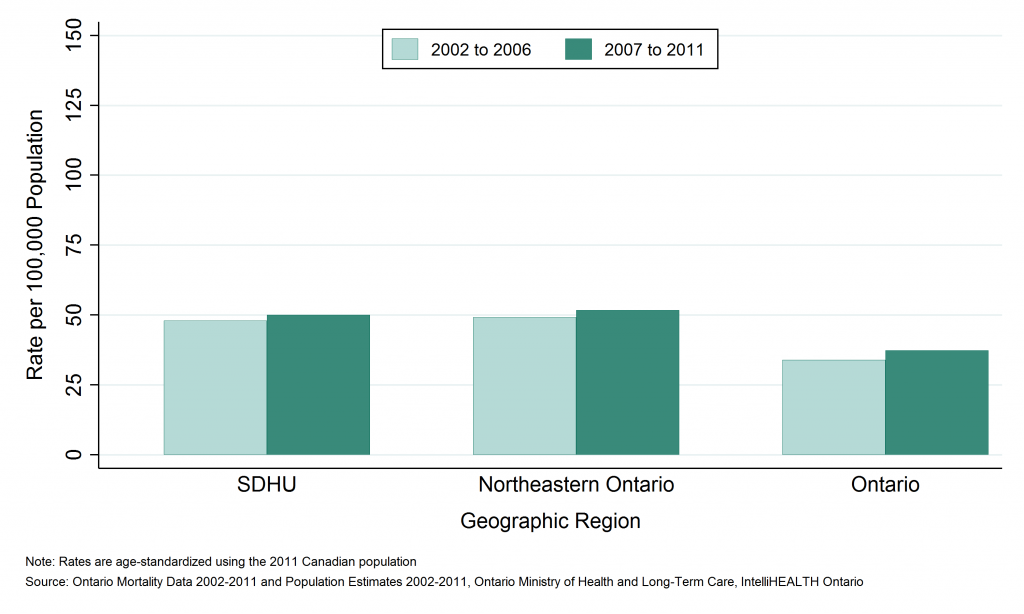
Table: Annual age-standardized mortality rate, assault, by geographic region, 2002 to 2006 and 2007 to 2011
| Geographic Region | Rate per 100,000 2002 to 2006 | Rate per 100,000 2007 to 2011 |
| SDHU | 1.2 | 2.2 |
| Northeast | 1.6 | 1.5 |
| Ontario | 1.3 | 1.3 |
Table: Annual number of deaths, assault, by geographic region, 2002 to 2006 and 2007 to 2011
| Geographic Region | Total Counts 2002 to 2006 | Total Counts 2007 to 2011 | Average Annual Counts, 2002 to 2006 | Average Annual Counts, 2007 to 2011 |
| SDHU | 12 | 22 | 2.4 | 4.4 |
| Northeast | 46 | 40 | 9.2 | 8.0 |
| Ontario | 836 | 852 | 167.2 | 170.4 |
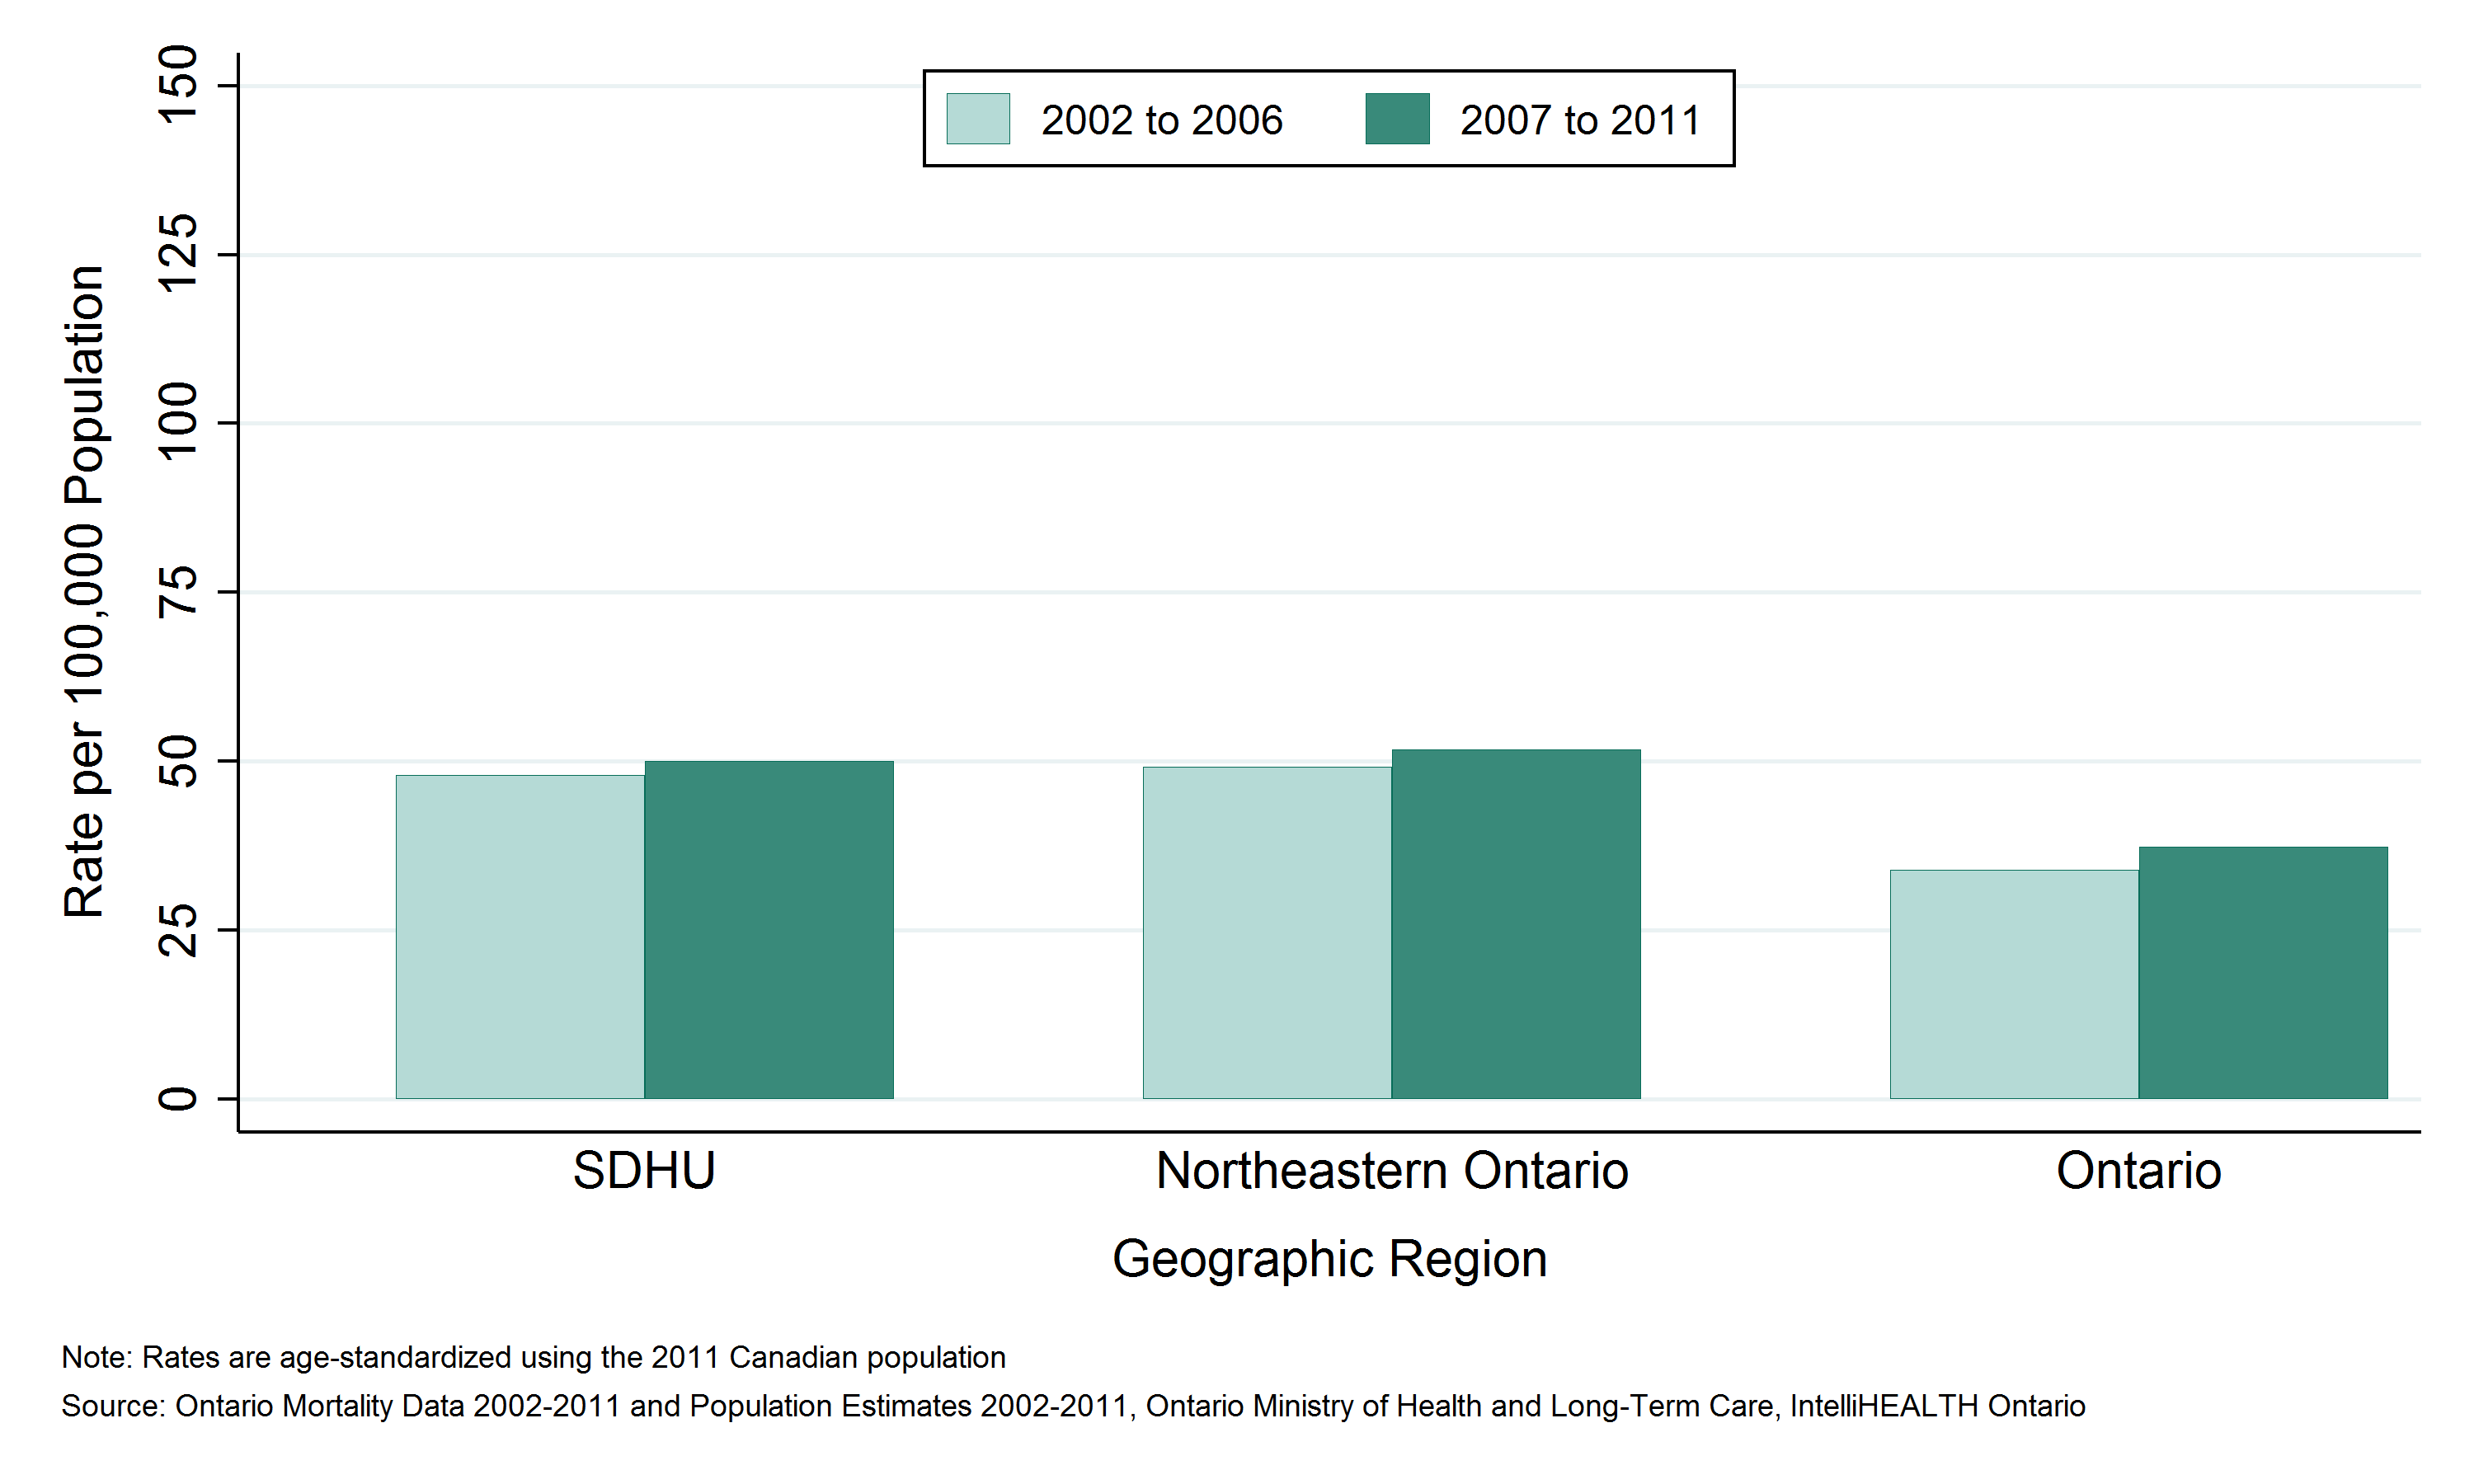
Potential years of life lost (PYLL) due to assault by geographic region
Key Findings:
- Between 2006 and 2015, Sudbury & District Health Unit (SDHU) area residents lost 820 years of potential life due to deaths from assault before the age of 75, an average of 164 per year.
- The rate of potential years of life lost (PYLL) in the SDHU area due to assault was 88 PYLL per 100,000 population per year.
- Between 2006 and 2015, the rate of PYLL due to assault in the SDHU area was higher than in northeastern Ontario and Ontario overall.
- Between 2002 to 2006 and 2007 to 2011, the rate of PYLL due to assault in the SDHU area increased.
Notes:
- Rates are age-standardized using the 2011 Canadian population.
- Data Source: Ontario Mortality Data 2002 to 2011 (extracted June 6, 2016) and Population Estimates 2006 to 2015 (extracted October 7, 2016), Ontario Ministry of Health and Long-Term Care, IntelliHEALTH Ontario.
Figure: Annual age-standardized rate of potential years of life lost (PYLL), assault, by geographic region, 2002 to 2006 and 2007 to 2011
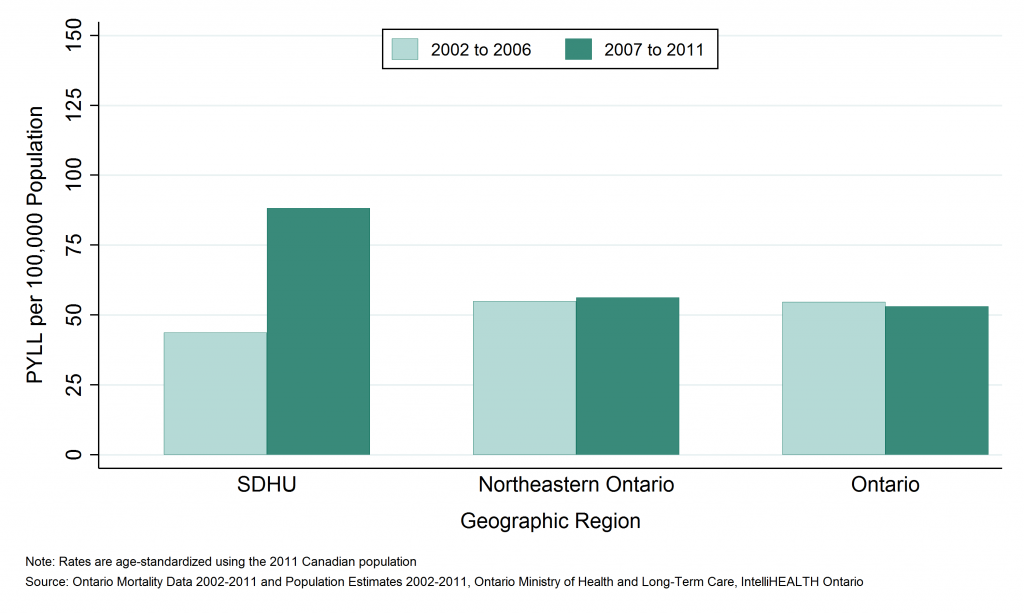
Table: Annual age-standardized rate of potential years of life lost (PYLL), assault, by geographic region, 2002 to 2006 and 2007 to 2011
| Geographic Region | Rate per 100,000, 2002 to 2006 | Rate per 100,000, 2007 to 2011 |
| SDHU | 961.7 | 968.4 |
| Northeast | 1,105.1 | 1,006.1 |
| Ontario | 561.2 | 615.4 |
Table: Annual number of potential years of life lost (PYLL), assault, by geographic region, 2002 to 2006 and 2007 to 2011
| Geographic Region | Total PYLL, 2002 to 2006 | Total PYLL, 2007 to 2011 | Average Annual Counts, 2002 to 2006 | Average Annual Counts, 2007 to 2011 |
| SDHU | 405 | 820 | 81.0 | 164.0 |
| Northeast | 1,444 | 1,432 | 288.8 | 286.4 |
| Ontario | 34,034 | 34,291 | 6,806.8 | 6,858.2 |
This item was last modified on July 25, 2017