Intentional Self-Harm
Injuries in this section include those resulting from an attempt by an individual to take their own life, or otherwise harm themselves, through any means.
Emergency department (ED) visits due to intentional self-harm by geographic region
Key Findings:
- Among residents of the Sudbury & District Health Unit (SDHU) area, there were 297 emergency department (ED) visits due to intentional self-harm in 2015.
- In 2015, the ED visits rate due to intentional self-harm in the SDHU area was 155 per 100,000 population per year.
- The rate of ED visits due to intentional self-harm in the SDHU area has been consistently lower than that of northeastern Ontario, yet both the SDHU and northeastern Ontario rates are higher than the rate for Ontario overall.
- Between 2006 and 2015, there was no clear trend in the ED visits rate due to intentional self-harm in the SDHU area.
Notes:
- Geographic areas and/or time periods in which there is less access to walk-in clinics and other alternatives to the local ED can be expected to have higher rates of injury-related ED visits than they would otherwise.
- Rates are age-standardized using the 2011 Canadian population.
- Data Source: Ambulatory Emergency External Cause 2006 to 2015 (extracted June 6, 2016) and Population Estimates 2006 to 2015 (extracted October 7, 2016), Ontario Ministry of Health and Long-Term Care, IntelliHEALTH Ontario.
Figure: Annual age-standardized rate of emergency department visits, intentional self-harm, by geographic region, 2006 to 2015
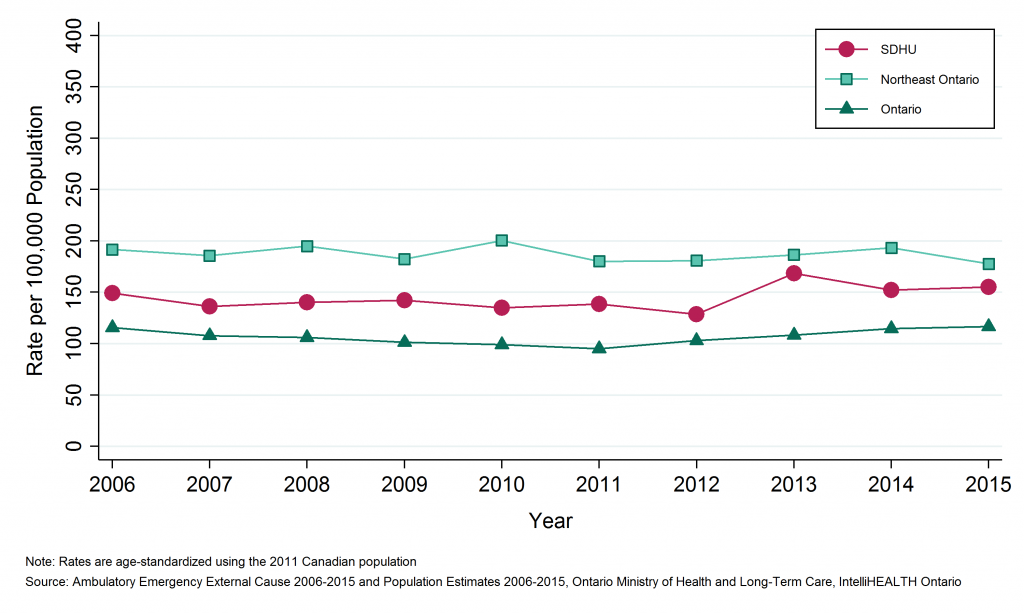
Table: Annual age-standardized rate of emergency department visits, intentional self-harm, by geographic region, 2006 to 2015
| Geographic Region | 2006 | 2007 | 2008 | 2009 | 2010 | 2011 | 2012 | 2013 | 2014 | 2015 |
| SDHU | 149.1 | 136.3 | 140.1 | 142.3 | 134.9 | 138.5 | 128.7 | 168.6 | 152.3 | 155.3 |
| Northeast | 191.6 | 185.6 | 195.0 | 182.3 | 200.4 | 180.2 | 180.7 | 186.4 | 193.2 | 177.6 |
| Ontario | 115.7 | 107.8 | 106.1 | 101.2 | 99.1 | 95.0 | 102.9 | 108.4 | 114.7 | 116.7 |
Table: Annual age-standardized rate of emergency department visits, intentional self-harm, by geographic region, 2006 to 2015
| Geographic Region | 2006 | 2007 | 2008 | 2009 | 2010 | 2011 | 2012 | 2013 | 2014 | 2015 |
| SDHU | 300 | 277 | 284 | 287 | 271 | 277 | 254 | 327 | 296 | 297 |
| Northeast | 1,091 | 1,055 | 1,094 | 1,013 | 1,107 | 988 | 978 | 994 | 1,025 | 923 |
| Ontario | 15,316 | 14,296 | 14,122 | 13,509 | 13,324 | 12,855 | 14,019 | 14,779 | 15,708 | 15,980 |
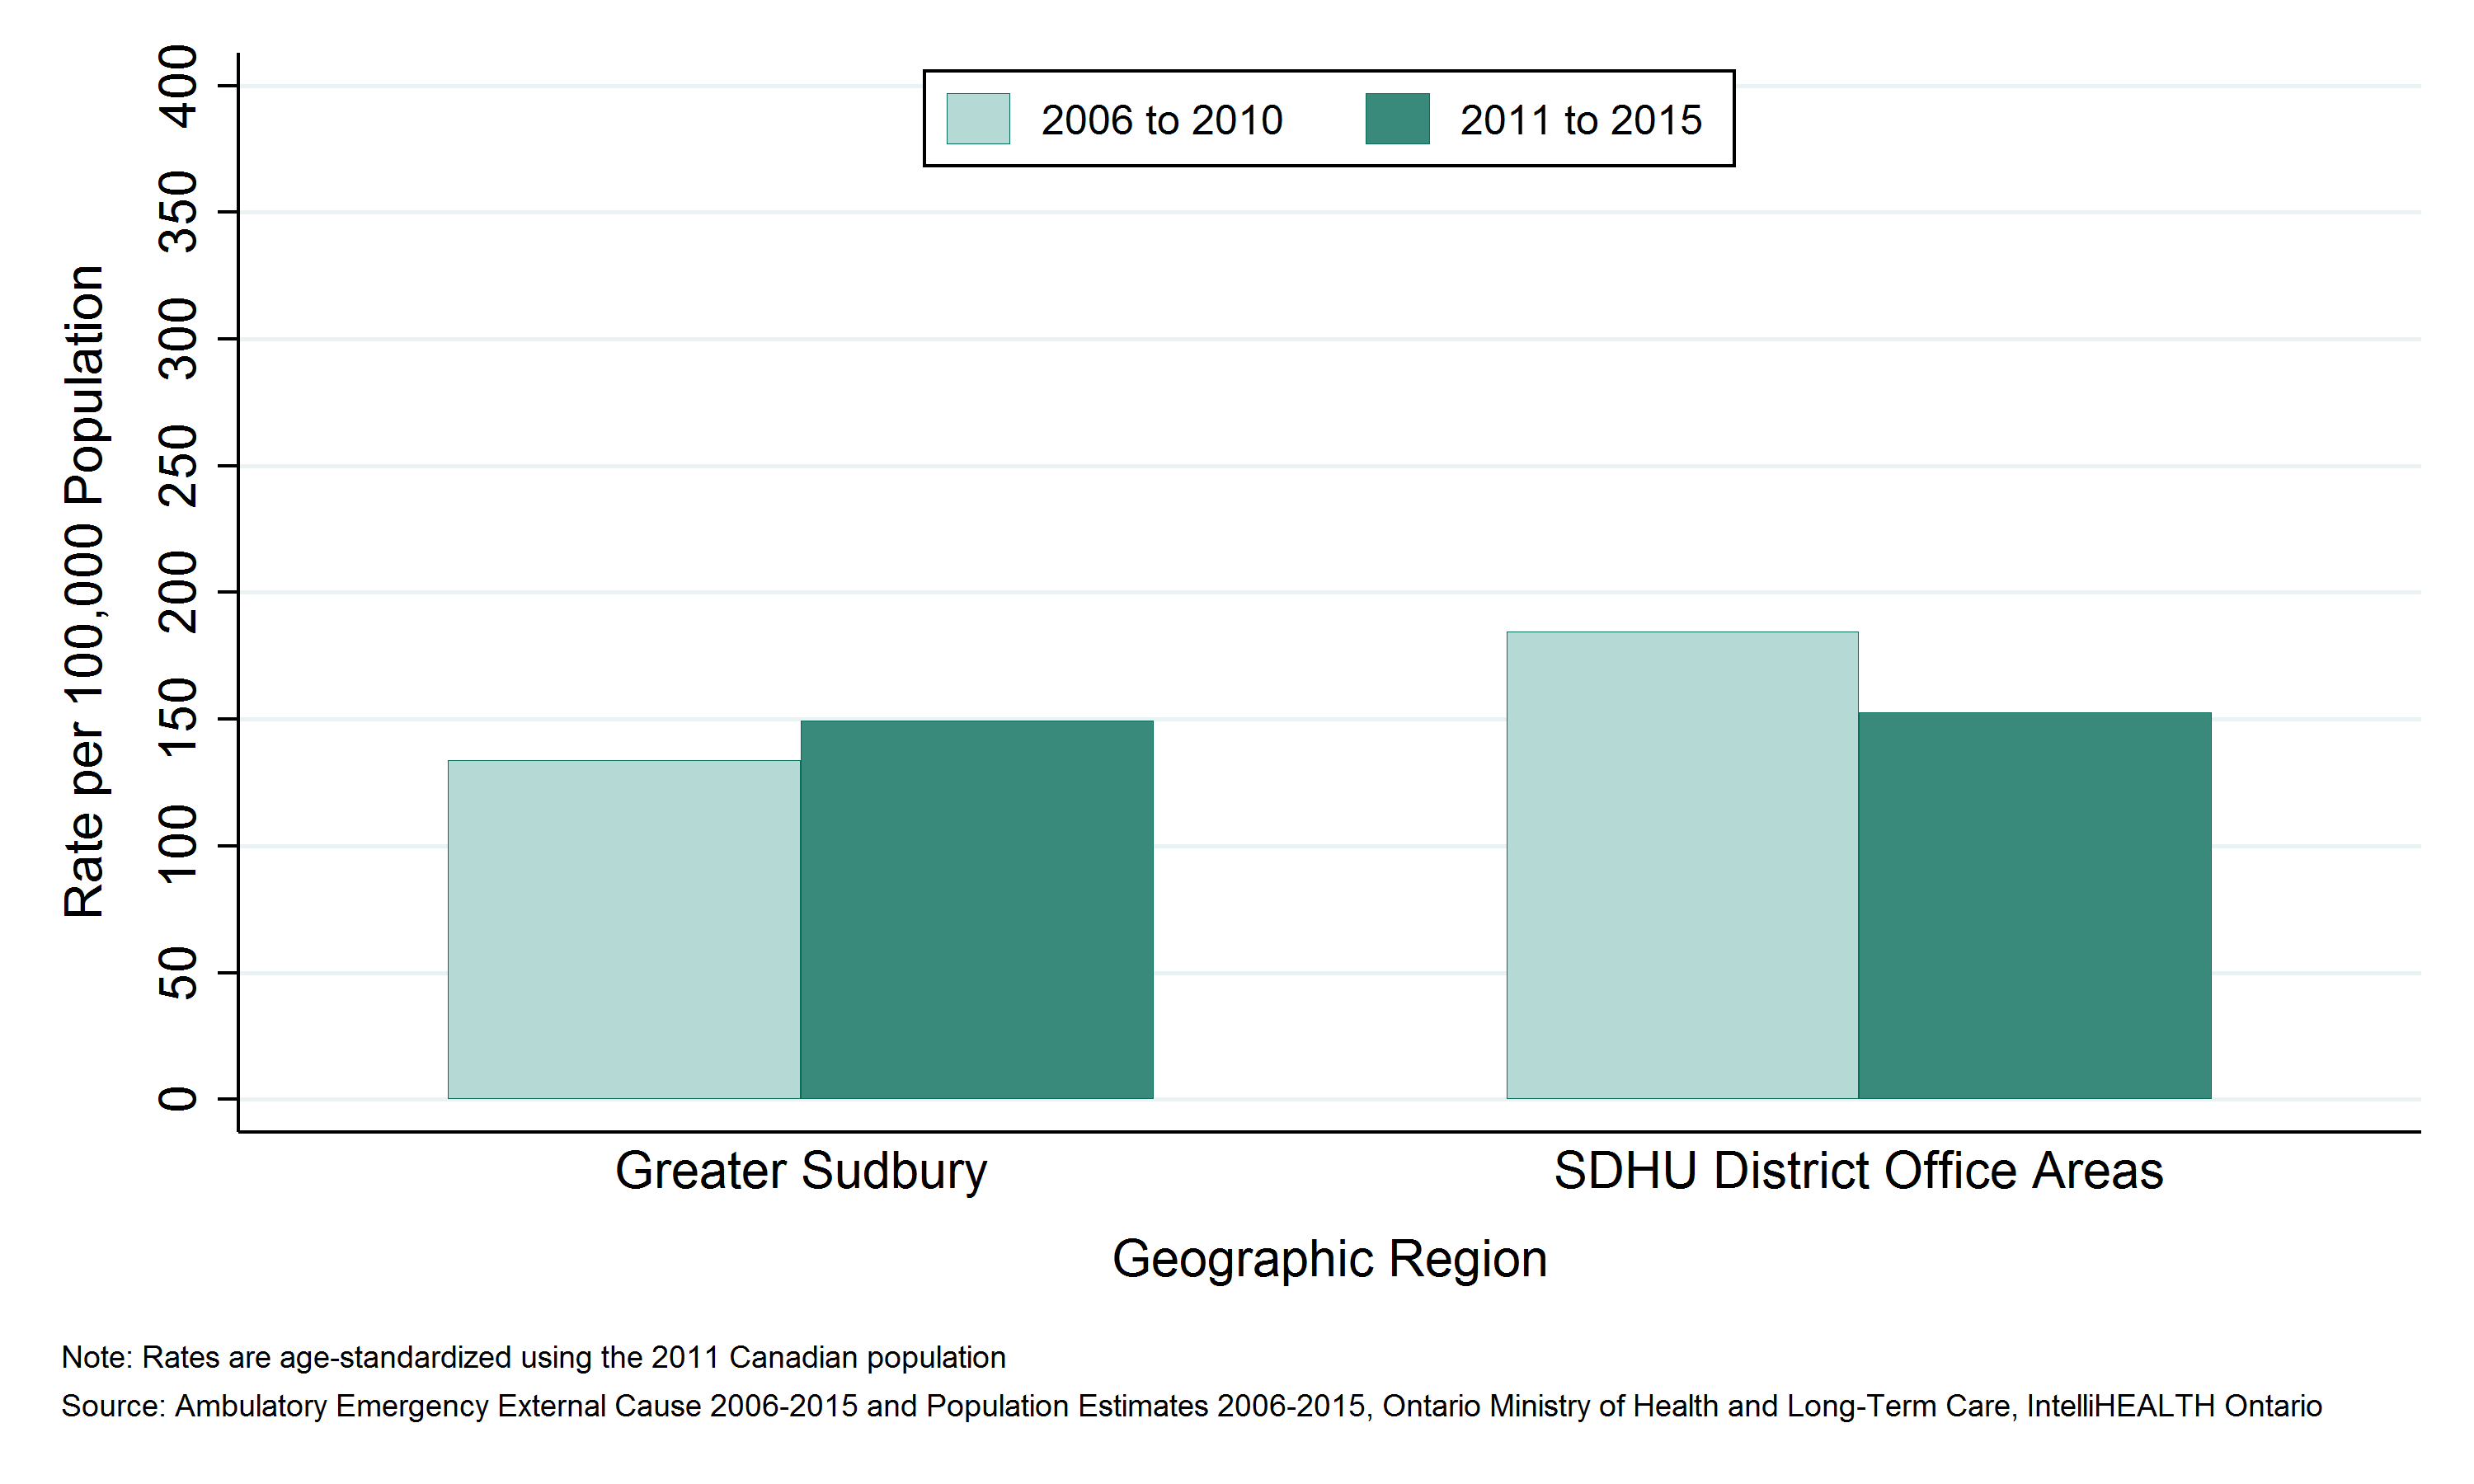
Emergency department (ED) visits due to intentional self-harm by Greater Sudbury and outlying areas
Key Findings:
- Between 2011 and 2015, there were 1,226 emergency department (ED) visits due to intentional self-harm among residents of Greater Sudbury and 225 among residents of the SDHU district office areas, an average of 245 and 45 per year, respectively.
- The rate of ED visits due to intentional self-harm was 150 per 100,000 population per year in Greater Sudbury and 152 per 100,000 population per year in the SDHU district office areas between 2011 and 2015.
- The rate of ED visits due to intentional self-harm among residents of Greater Sudbury has been similar to the rate among residents in the SDHU district office areas.
- The rate of ED visits due to intentional self-harm among residents in Greater Sudbury increased over time between 2006 to 2010 and 2011 to 2015, while rate among residents in the SDHU district office areas decreased over the same time period.
Notes:
- Geographic areas and/or time periods in which there is less access to walk-in clinics and other alternatives to the local ED can be expected to have higher rates of injury-related ED visits than they would otherwise.
- Rates are age-standardized using the 2011 Canadian population.
- Data Source: Ambulatory Emergency External Cause 2006 to 2015 (extracted June 6, 2016) and Population Estimates 2006 to 2015 (extracted October 7, 2016), Ontario Ministry of Health and Long-Term Care, IntelliHEALTH Ontario.
Figure: Annual age-standardized rate of emergency department visits, intentional self-harm, by Greater Sudbury and outlying areas, 2006 to 2010 and 2011 to 2015

Table: Annual age-standardized rate of emergency department visits, intentional self-harm, by Greater Sudbury and outlying areas, 2006 to 2010 and 2011 to 2015
| Geographic Region | Rate per 100000 2006 to 2010 | Rate per 100000 2011 to 2015 |
| Greater Sudbury | 133.9 | 149.5 |
| SDHU District Office Areas | 184.6 | 152.5 |
Table: Annual number of emergency department visits, intentional self-harm, by Greater Sudbury and outlying areas, 2006 to 2010 and 2011 to 2015
| Geographic Region | Total Counts, 2006 to 2010 | Total Counts, 2011 to 2015 | Average Annual Counts, 2006 to 2010 | Average Annual Counts, 2011 to 2015 |
| Greater Sudbury | 1,128 | 1,226 | 225.6 | 245.2 |
| SDHU District Office Areas | 291 | 225 | 58.2 | 45.0 |
Emergency department (ED) visits due to intentional self-harm by sex
Key Findings:
- Between 2011 and 2015, there were 533 emergency department (ED) visits due to intentional self-harm among males, and 918 among females in the Sudbury & District Health Unit (SDHU) area, an average of 107 and 184 per year, respectively.
- The rate of ED visits due to intentional self-harm was 108 per 100,000 males per year and 191 per 100,000 females per year in the SDHU area in 2015.
- The ED visits rate due to intentional self-harm among females has been consistently higher than the rate among males.
- Among females in the SDHU area, the rate of ED visits due to intentional self-harm increased slightly over time between 2006 to 2010 and 2011 to 2015, while the rate among males remained stable over the same time period.
Notes:
- Geographic areas and/or time periods in which there is less access to walk-in clinics and other alternatives to the local ED can be expected to have higher rates of injury-related ED visits than they would otherwise.
- Rates are age-standardized using the 2011 Canadian population.
- Data Source: Ambulatory Emergency External Cause 2006 to 2015 (extracted June 6, 2016) and Population Estimates 2006 to 2015 (extracted October 7, 2016), Ontario Ministry of Health and Long-Term Care, IntelliHEALTH Ontario.
Figure: Annual age-standardized rate of emergency department visits, intentional self-harm, by sex, SDHU, 2006 to 2010 and 2011 to 2015
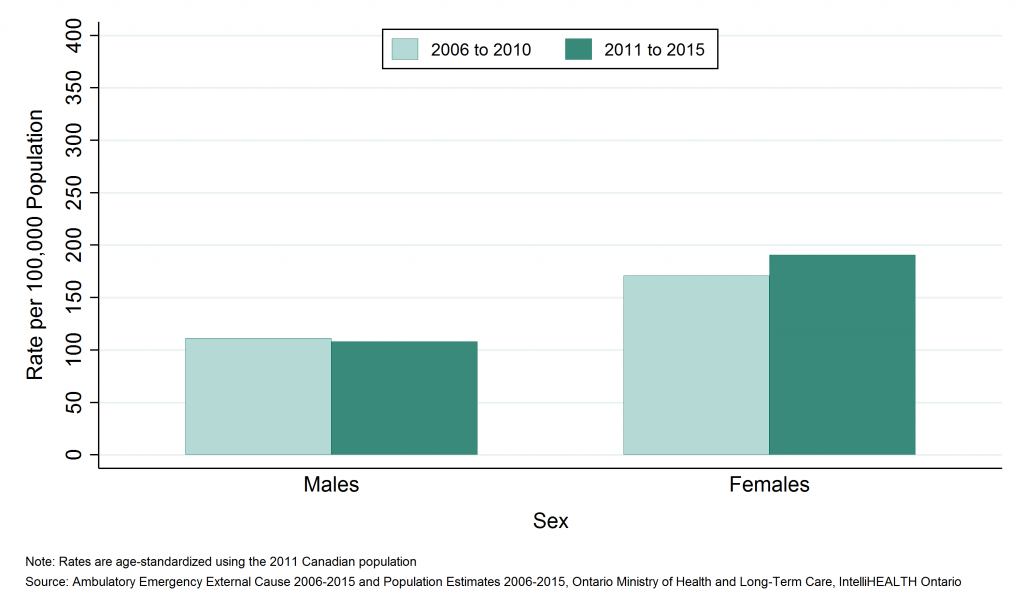
Table: Annual age-standardized rate of emergency department visits, intentional self-harm, by sex, SDHU, 2006 to 2010 and 2011 to 2015
| Sex | Rate per 100,000, 2006 to 2010 | Rate per 100,000, 2011 to 2015 |
| Males | 111.2 | 108.0 |
| Females | 171.0 | 190.6 |
Table: Annual age-standardized rate of emergency department visits, intentional self-harm, by sex, SDHU, 2006 to 2010 and 2011 to 2015
| Sex | Total Counts, 2006 to 2010 | Total Counts, 2011 to 2015 | Average Annual Counts, 2006 to 2010 | Average Annual Counts, 2011 to 2015 |
| Males | 556 | 533 | 111.2 | 106.6 |
| Females | 863 | 918 | 172.6 | 183.6 |
Emergency department (ED) visits due to intentional self-harm by age group
Key Findings:
- Among residents of the Sudbury & District Health Unit (SDHU) area, the 15 to 24 age group visited the emergency department (ED) due to intentional self-harm the most, with 572 ED visits between 2011 and 2015, or 114 ED visits per year on average.
- Between 2011 and 2015, the 15 to 24 age group had the highest ED visits rate due to intentional self-harm with 444 ED visits per 100,000 population per year.
- Rates of ED visits due to intentional self-harm are increase through youth and young adulthood, then decrease with age.
- In the SDHU area, the ED visits rate due to intentional self-harm increased over time among 10 to 14, 15 to 24, 65 to 74 and 75 to 84 year age groups between 2006 to 2010 and 2011 to 2015, yet decreased in the 25 to 44 and 45 to 64 year age group during the same time period. Rates remained stable for all other age groups.
Notes:
- Geographic areas and/or time periods in which there is less access to walk-in clinics and other alternatives to the local ED can be expected to have higher rates of injury-related ED visits than they would otherwise.
- Data Source: Ambulatory Emergency External Cause 2006 to 2015 (extracted June 6, 2016) and Population Estimates 2006 to 2015 (extracted October 7, 2016), Ontario Ministry of Health and Long-Term Care, IntelliHEALTH Ontario.
Figure: Annual rate of emergency department visits, intentional self-harm, by age group, SDHU, 2006 to 2010 and 2011 to 2015
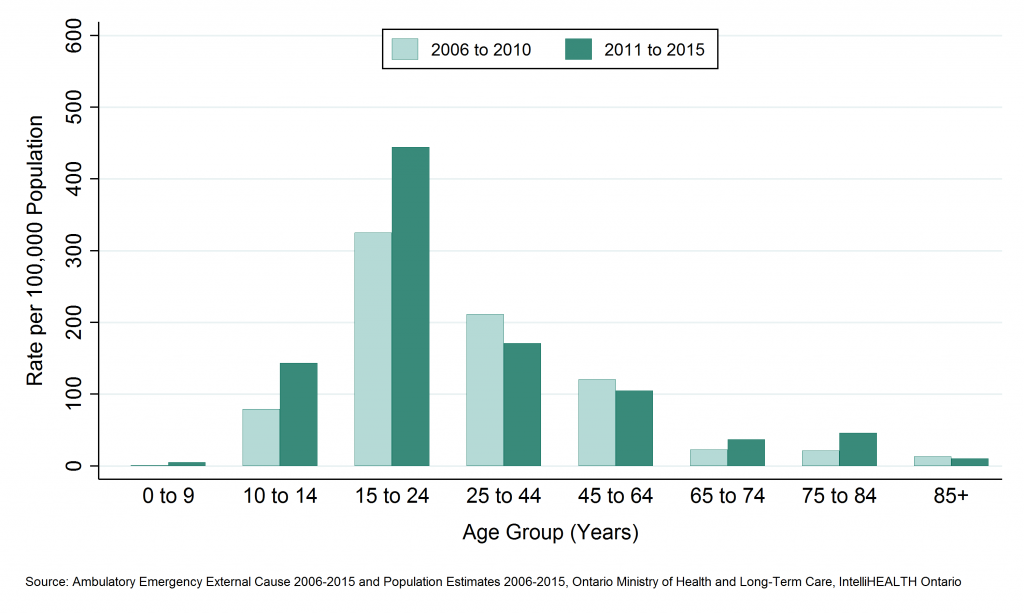
Table: Annual rate of emergency department visits, intentional self-harm, by age group, SDHU, 2006 to 2010 and 2011 to 2015
| Age Group | Rate per 100000, 2006 to 2010 | Rate per 100000, 2011 to 2015 |
| 0 to 9 | 1.0 | 5.2 |
| 10 to 14 | 79.5 | 143.4 |
| 15 to 24 | 324.8 | 444.3 |
| 25 to 44 | 211.4 | 171.0 |
| 45 to 64 | 120.5 | 105.0 |
| 65 to 74 | 22.5 | 36.7 |
| 75 to 84 | 21.0 | 45.9 |
| 85+ | 13.0 | 10.2 |
Table: Annual number of emergency department visits, intentional self-harm, by age group, SDHU, 2006 to 2010 and 2011 to 2015
| Age Group | Total Counts, 2006 to 2010 | Total Counts, 2011 to 2015 | Average Annual Counts, 2006 to 2010 | Average Annual Counts, 2011 to 2015 |
| 0 to 9 | 1 | 5 | 0.2 | 1.0 |
| 10 to 14 | 48 | 74 | 9.6 | 14.8 |
| 15 to 24 | 432 | 572 | 86.4 | 114.4 |
| 25 to 44 | 548 | 418 | 109.6 | 83.6 |
| 45 to 64 | 358 | 319 | 71.6 | 63.8 |
| 65 to 74 | 19 | 36 | 3.8 | 7.2 |
| 75 to 84 | 11 | 25 | 2.2 | 5.0 |
| 85+ | 2 | 2 | 0.4 | 0.4 |
Deaths due to intentional self-harm by geographic region
Key Findings:
- Among residents of the Sudbury & District Health Unit (SDHU) area, there were 121 deaths due to intentional self-harm between 2007 and 2011, an average of 24 per year.
- In 2011, the mortality rate due to intentional self-harm in the SDHU area was 10 deaths per 100,000 population per year.
- The mortality rates due to intentional self-harm in the SDHU area and northeastern Ontario have generally been similar, and both rates were slightly higher than the rate in Ontario overall.
- Between 2002 to 2006 and 2007 to 2011, the mortality rate due to intentional self-harm in the SDHU area decreased slightly.
Notes:
- Rates are age-standardized using the 2011 Canadian population.
- Data Source: Ontario Mortality Data 2002 to 2011 (extracted June 6, 2016) and Population Estimates 2006 to 2015 (extracted October 7, 2016), Ontario Ministry of Health and Long-Term Care, IntelliHEALTH Ontario.
Figure: Annual age-standardized rate of emergency department visits, intentional self-harm, by geographic region, 2002 to 2006 and 2007 to 2011
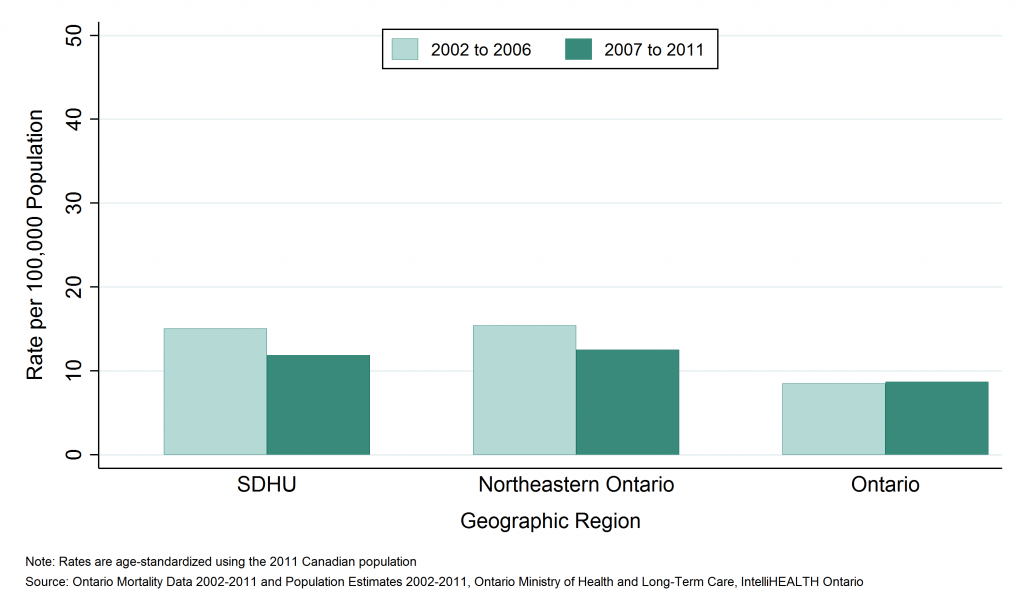
Table: Annual age-standardized rate of emergency department visits, intentional self-harm, by geographic region, 2002 to 2006 and 2007 to 2011
| Geographic Region | Rate per 100,000 2002 to 2006 | Rate per 100,000 2007 to 2011 |
| SDHU | 15.1 | 11.9 |
| Northeast | 15.4 | 12.5 |
| Ontario | 8.5 | 8.7 |
Table: Annual number of emergency department visits, intentional self-harm, by geographic region, 2002 to 2006 and 2007 to 2011
| Geographic Region | Total Counts 2002 to 2006 | Total Counts 2007 to 2011 | Average Annual Counts, 2002 to 2006 | Average Annual Counts, 2007 to 2011 |
| SDHU | 147 | 121 | 29.4 | 24.2 |
| Northeast | 441 | 366 | 88.2 | 73.2 |
| Ontario | 5,129 | 5,643 | 1,025.8 | 1,128.6 |
Potential years of life lost (PYLL) due to intentional self-harm by geographic region
Key Findings:
- Between 2006 and 2015, Sudbury & District Health Unit (SDHU) area residents lost 3,272 years of potential life due to deaths from intentional self-harm before the age of 75, an average of 654 per year.
- The rate of potential years of life lost (PYLL) in the SDHU area due to intentional self-harm was 339 PYLL per 100,000 population per year.
- The rate of PYLL due to intentional self-harm in the SDHU area has generally been lower than that in northeastern Ontario, while rates in both areas have been higher than the rate in Ontario overall.
- Between 2002 to 2006 and 2007 to 2011, the rate of PYLL due to intentional self-harm decreased.
Notes:
- Rates are age-standardized using the 2011 Canadian population.
- Data Source: Ontario Mortality Data 2002 to 2011 (extracted June 6, 2016) and Population Estimates 2006 to 2015 (extracted October 7, 2016), Ontario Ministry of Health and Long-Term Care, IntelliHEALTH Ontario.
Figure: Annual age-standardized rate of potential years of life lost (PYLL), intentional self-harm, by geographic region, 2002 to 2006 and 2007 to 2011
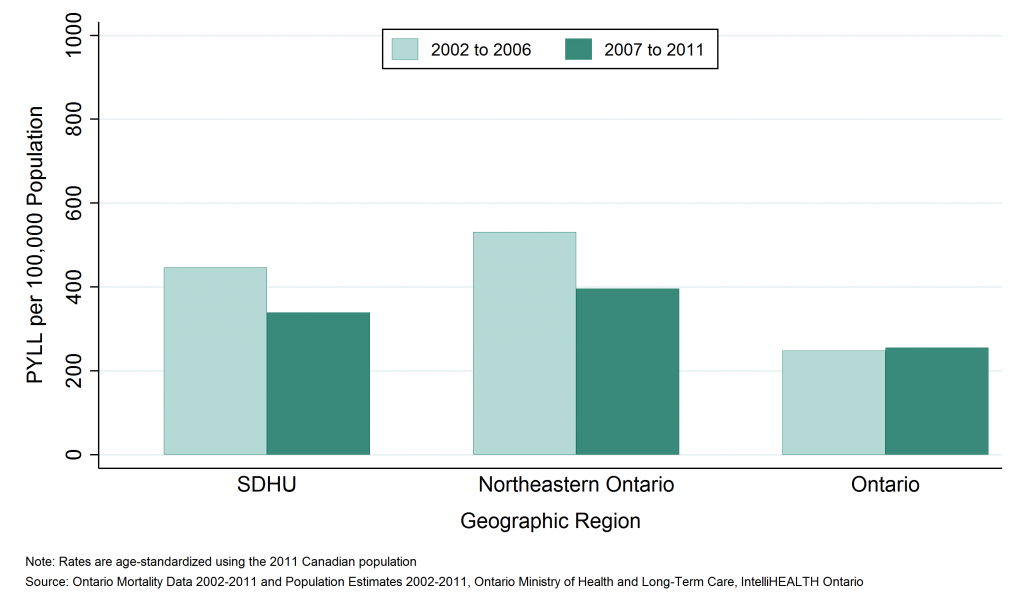
Table: Annual age-standardized rate of potential years of life lost (PYLL), intentional self-harm, by geographic region, 2002 to 2006 and 2007 to 2011
| Geographic Region | Rate per 100,000, 2002 to 2006 | Rate per 100,000, 2007 to 2011 |
| SDHU | 446.5 | 339.3 |
| Northeast | 531.6 | 396.2 |
| Ontario | 247.9 | 255.9 |
Table: Annual number of potential years of life lost (PYLL), intentional self-harm, by geographic region, 2002 to 2006 and 2007 to 2011
| Geographic Region | Total PYLL, 2002 to 2006 | Total PYLL, 2007 to 2011 | Average Annual Counts, 2002 to 2006 | Average Annual Counts, 2007 to 2011 |
| SDHU | 4,268 | 3,272 | 853.6 | 654.4 |
| Northeast | 14,617 | 10,673 | 2,923.4 | 2,134.6 |
| Ontario | 152,773 | 163,646 | 30,554.6 | 32,729.2 |
This item was last modified on February 27, 2025