Medkit
Icon in the shape of a medkit
Clipboard
Icon in the shape of a medkit
Chat
Icon in the shape of two speach bubbles
Bar chart
Icon in the shape of a bar chart
Icon in the shape of three stacked lines
Description
Cancel
Icon in the shape of a cancel button
Warning
Icon in the shape of a warning sign
Facebook
Icon in the shape of the facebook logo
Print
Icon in the shape of the Twitter logo
YouTube
Iocn in the shape of the YouTube logo
Print
Icon in the shape of a printer
Skip to main content
Resources
News & Alerts
Research & Statistics
FAQs
Clinics, Classes & Events
Features & Services
Health Topics & Programs
Professionals
About
Join Us
Contact
Resources
News & Alerts
Research & Statistics
FAQs
Français
search
Clinics, Classes & Events
Features & Services
Health Topics & Programs
Professionals
About
Join Us
Contact
Home
» »
Ressources
»
Recherche et statistiques
»
Statistiques sur la santé
»
Possibilités pour tous : Le chemin vers l’équité en matière de santé (points culminants)
»
Possibilités pour tous : Le chemin vers l’équité en matière de santé (rapport)
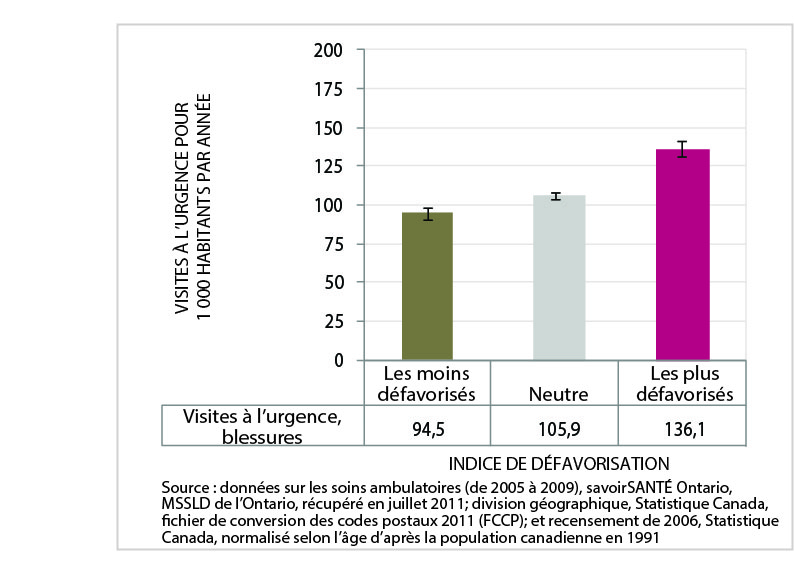
» Figure_8_injuries and poisoning ED visits_FR
Figure_8_injuries and poisoning ED visits_FR
This item was last modified on March 27, 2015
↑
WordPress Appliance
- Powered by
TurnKey Linux