Immigration Status
This section focuses on the immigration status of the population of Sudbury and districts.
Immigrant refers to a person who is or has ever been a landed immigrant/permanent resident. This person has been granted the right to live in Canada permanently by immigration authorities. Some immigrants have resided in Canada for a number of years, while others have arrived recently. Some immigrants are Canadian citizens, while others are not. Most immigrants are born outside Canada, but a small number are born in Canada.
Highlights
- A much lower proportion of the overall population consisted of immigrants in Sudbury District (4%), Manitoulin District (4%) and Greater Sudbury (6%) compared to Ontario (29%).
Source: 2016 Census, Statistics Canada.
Table 5.1: Immigration status, by geographic area, 2016
| Immigration status | Manitoulin District | Sudbury District | Greater Sudbury | Sudbury and districts | Ontario |
|---|---|---|---|---|---|
| Non-immigrants | 12,405 95.8% | 20,440 96.2% | 148,785 93.7% | 181,630 94.1% | 9,188,815 69.4% |
| Immigrants | 500 3.9% | 790 3.7% | 9,290 5.9% | 10,580 5.5% | 3,852,145 29.1% |
| Non-permanent residents | 55 0.4% | 10 0.0% | 710 0.4% | 775 0.4% | 201,200 1.5% |
Source: 2016 Census, Statistics Canada.
Highlights
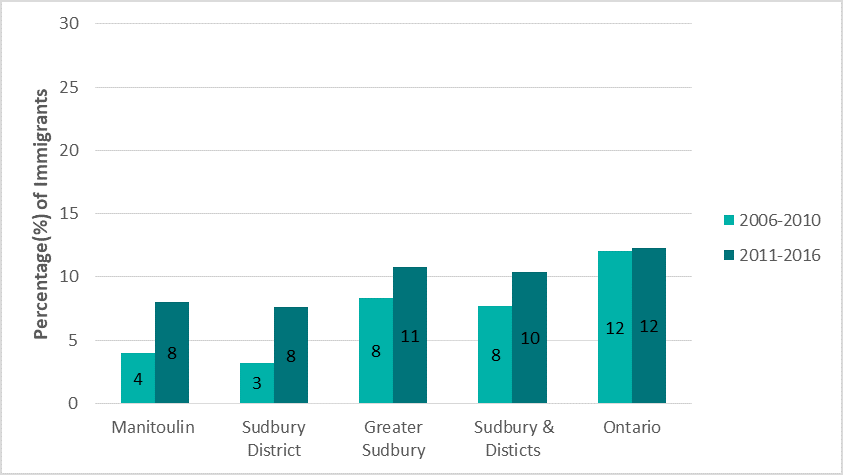
- Within Sudbury and districts, among all immigrants, a lower proportion (18%) immigrated between 2006 and 2016 compared to Ontario (24%).
- In Sudbury and districts the proportion of recent immigrants (2011 to 2016) is higher than those who immigrated between 2006–2010, which is not the case in Ontario overall.
Source: 2016 Census, Statistics Canada.
Figure 5.1: Period of immigration 2006–2010 and 2011–2016 among all immigrants, by geographic area
Data table for Figure 5.2: Period of immigration 2006–2010 and 2011–2016 among all immigrants, by geographic area
| Manitoulin District | Sudbury District | Greater Sudbury | Sudbury and districts | Ontario | |
|---|---|---|---|---|---|
| 2006 to 2010 | 4.0 | 3.2 | 8.3 | 7.7 | 12.0 |
| 2011 to 2016 | 8.0 | 7.6 | 10.8 | 10.4 | 12.3 |
Source: Statistics Canada, 2016 Census.
Highlights
- In Sudbury and districts, a higher proportion of immigrants, approximately (62%) reported being 24 years or younger at the time of immigration compared to Ontario (50%).
Statistics Canada, 2016 Census
Table 5.3: Age at immigration, by geographic area, 2016
| Age at immigration | Manitoulin District | Sudbury District | Greater Sudbury | Sudbury and districts | Ontario |
|---|---|---|---|---|---|
| Total immigrant population by age at immigration (% of total population) | 500 | 790 | 9,290 | 10,580 | 3,852,145 |
| Under 5 years (% of immigrant population) | 70 14.0% | 175 22.2% | 1,260 13.6% | 1,505 14.2% | 369,955 9.6% |
| 5 to 14 years (% of immigrant population) | 120 24.0% | 220 27.8% | 1,800 19.4% | 2,140 20.2% | 685,085 17.8% |
| 15 to 24 years (% of immigrant population) | 120 24.0% | 160 20.3% | 2,665 28.7% | 2,945 27.8% | 855,475 22.2% |
| 25 to 44 years (% of immigrant population) | 150 30.0% | 205 25.9% | 3,170 34.1% | 3,525 33.3% | 1,579,500 41.0% |
| 45 years + (% of immigrant population) | 40 8.0% | 35 4.4% | 400 4.3% | 475 4.5% | 362,130 9.4% |
Source: Statistics Canada, 2016 Census.
Highlights
- In Sudbury and districts, the largest percentage of immigrants were third generation or more (84%) compared to Ontario (46%); and only 6% within Sudbury and districts were first generation compared to 31% in Ontario.
In the table below, first generation includes persons who were born outside of Canada. For the most part, these are people who are now, or have ever been, immigrants to Canada. Second generation includes persons who were born in Canada and had at least one parent born outside Canada. Third generation or more includes persons who were born in Canada with both parents born in Canada.
Statistics Canada, 2016 Census
Table 5.4: Generation status, by geographic area, 2016
| Manitoulin District | Sudbury District | Greater Sudbury | Sudbury and districts | Ontario | |
|---|---|---|---|---|---|
| First generation | 605 4.7% | 850 4.0% | 10,380 6.5% | 11,835 6.1% | 4,122,840 31.1% |
| Second generation | 1,160 9.0% | 1,545 7.3% | 17,080 10.8% | 19,785 10.3% | 3,049,835 23.0% |
| Third generation or more | 11,190 86.4% | 18,845 88.7% | 131,320 82.7% | 161,355 83.6% | 6,069,485 45.8% |
Source: Statistics Canada, 2016 Census.
This item was last modified on November 20, 2018