Population
This section focuses on the Sudbury & Districts land area and the population distribution within that area. It also presents changes in the population age structure and size from 2011 to 2016.
Highlights
- Between 2011 and 2016, the populations of the Manitoulin District, Sudbury District, Greater Sudbury, and the entire Sudbury & Districts all increased.
- The Sudbury District comprises approximately 86% of the Sudbury & Districts land area.
- Approximately 82% of the Sudbury & Districts population lived within Greater Sudbury in 2016.
- The Sudbury & Districts has a low population density of four persons per square kilometre, compared to Ontario, at 15 persons per square kilometre.
Note: Refer to Table 2.7 for a list of Census Subdivisions within each of the Sudbury & Districts Census Divisions.
Source: 2016 Censuses, Statistics Canada
Table 2.1: Land Area, population and population percentage change by census division, 2011 to 2016
| Geographic Area | Land Area (km2) | Population, 2011 | Population, 2016 | % Population Change 2011 to 2016 |
|---|---|---|---|---|
| Sudbury & Districts | 46,551.0 | 194,620 | 196,448 | 0.9 |
| Manitoulin District | 3,107.2 | 13,048 | 13,255 | 1.6 |
| Sudbury District | 40,204.8 | 21,196 | 21,546 | 1.7 |
| Greater Sudbury | 3,239.0 | 160,376 | 161,647 | 0.8 |
Public Health Sudbury & Districts service area
Highlights
Between 2011 and 2016:
- The population aged 0 to 19 declined by 4%.
- The population aged 20 to 44 declined by 1%.
- The adult population aged 45 to 64 declined by 2%.
- The adult population aged 65+ increased by 17%.
- Those aged 0 to 14 years comprised about 15% of the population in 2016.
- Baby boomers (45 to 64 years of age) formed approximately 30% of the population.
- Seniors aged 65+ comprised about 19% of the population.
Note: Numbers may not add up to the total due to random rounding up or down to units of 5. The percentages presented above are percentage of the total population.
Source: 2016 Census, Statistics Canada
Figure 2.1: Population percentage (%) change by sex and age group, Sudbury & Districts, 2011 to 2016
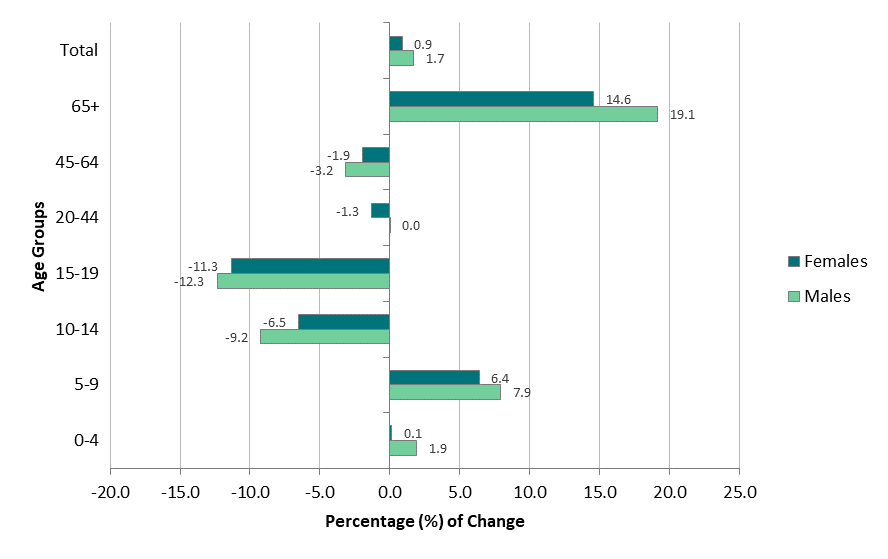
Source: 2011 and 2016 Censuses, Statistics Canada
Data Table for Figure 2.1: Population percentage (%) change by sex and age group, Sudbury & Districts, 2011 to 2016
| Age group | Percentage, males (%) | Percentage, females (%) | Percentage, total (%) |
|---|---|---|---|
| 0-4 | 1.9 | 0.1 | 1.1 |
| 5-9 | 7.9 | 6.4 | 7.1 |
| 10-14 | -9.2 | -6.5 | -7.9 |
| 15-19 | -12.3 | -11.3 | -11.8 |
| 20-44 | 0.0 | -1.3 | -0.8 |
| 45-64 | -3.2 | -1.9 | -2.5 |
| 65+ | 19.1 | 14.6 | 16.6 |
| Total | 1.7 | 0.9 | 0.9 |
Table 2.2a: Percentage, population distribution by age and sex, Sudbury & Districts, 2016
| Age Group | Population, males (% of total population) | Population, females (% of total population) | Population, total (%) |
|---|---|---|---|
| 0-4 | 2.6 | 2.4 | 5.0 |
| 5-9 | 2.7 | 2.5 | 5.3 |
| 10-14 | 2.6 | 2.5 | 5.1 |
| 15-19 | 2.9 | 2.8 | 5.7 |
| 20-44 | 14.8 | 14.8 | 29.6 |
| 45-64 | 14.8 | 15.4 | 30.2 |
| 65+ | 8.8 | 10.3 | 19.1 |
| Total | 49.2 | 50.8 | 100.0 |
Table 2.2b: Count, population distribution by age and sex, Sudbury & Districts, 2016
| Age Group | Population, males (% of total population) | Population, females (% of total population) | Population, total (%) |
|---|---|---|---|
| 0-4 | 5,035 | 4,720 | 9,755 |
| 5-9 | 5,330 | 5,005 | 10,325 |
| 10-14 | 5,115 | 4,945 | 10,065 |
| 15-19 | 5,720 | 5,450 | 11,180 |
| 20-44 | 29,010 | 29,160 | 58,200 |
| 45-64 | 29,010 | 30,320 | 59,340 |
| 65+ | 17,290 | 20,305 | 37,590 |
| Total | 96,575 | 99,905 | 196,455 |
Sudbury & Districts and Ontario
Highlights
- Even though the overall age and sex distribution of the population in the Sudbury & Districts was similar to Ontario, there was a higher proportion of individuals ages 50 and over in Sudbury & Districts compared to Ontario.
- The population aged 65+ is higher in the Sudbury & Districts (19.1%) compared to Ontario (16.8%).
- In the Sudbury & Districts and in the province, the proportion of females in older age groups (65+ years) was greater than that of males.
Notes:
- The percentages presented are percentage of the total population.
- Numbers in counts tables may not add up to the total due to random rounding up or down to units of 5.
- Source: 2016 Census, Statistics Canada
Figure 2.2: Population distribution by age and sex, Sudbury & Districts and Ontario, 2016
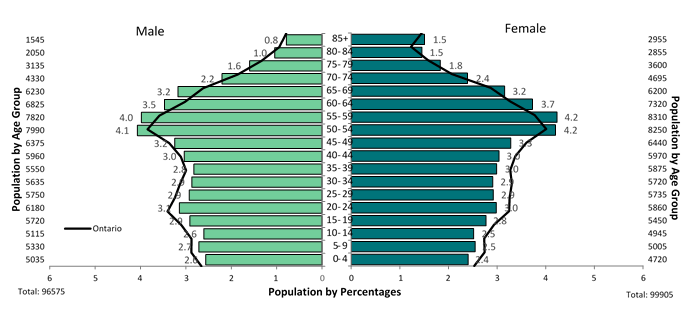
Source: 2016 Census, Statistics Canada
Table 2.3a: Percentage, population distribution by age and sex, Sudbury & Districts and Ontario, 2016
| Age Group | Sudbury & Districts Males (% of total population) | Sudbury & Districts Females (% of total population) | Sudbury & Districts Total (% of total population) | Ontario Males (% of total population) | Ontario Females (% of total population) | Ontario Total (% of total population) |
|---|---|---|---|---|---|---|
| 0–4 | 2.6 | 2.4 | 5.0 | 2.7 | 2.5 | 5.2 |
| 5–9 | 2.7 | 2.5 | 5.3 | 2.9 | 2.7 | 5.6 |
| 10–14 | 2.6 | 2.5 | 5.1 | 2.9 | 2.7 | 5.6 |
| 15–19 | 2.9 | 2.8 | 5.7 | 3.1 | 2.9 | 6.0 |
| 20–24 | 3.1 | 3.0 | 6.1 | 3.4 | 3.2 | 6.7 |
| 25–29 | 2.9 | 2.9 | 5.8 | 3.2 | 3.3 | 6.5 |
| 30–34 | 2.9 | 2.9 | 5.8 | 3.1 | 3.3 | 6.4 |
| 35–39 | 2.8 | 3.0 | 5.8 | 3 | 3.3 | 6.3 |
| 40–44 | 3.0 | 3.0 | 6.1 | 3.1 | 3.4 | 6.5 |
| 45–49 | 3.2 | 3.3 | 6.5 | 3.4 | 3.6 | 7.0 |
| 50–54 | 4.1 | 4.2 | 8.3 | 3.8 | 4.0 | 7.9 |
| 55–59 | 4.0 | 4.2 | 8.2 | 3.6 | 3.8 | 7.4 |
| 60–64 | 3.5 | 3.7 | 7.2 | 3.0 | 3.3 | 6.3 |
| 65–69 | 3.2 | 3.2 | 6.3 | 2.6 | 2.9 | 5.5 |
| 70–74 | 2.2 | 2.4 | 4.6 | 1.9 | 2.1 | 3.9 |
| 75–79 | 1.6 | 1.8 | 3.4 | 1.3 | 1.6 | 2.9 |
| 80–84 | 1.0 | 1.5 | 2.5 | 0.9 | 1.2 | 2.2 |
| 85+ | 0.8 | 1.5 | 2.3 | 0.8 | 1.4 | 2.2 |
| TOTAL | 49.2 | 50.8 | 100 | 48.8 | 51.2 | 100 |
Table 2.3b: Count, population distribution by age and sex, Sudbury & Districts and Ontario, 2016
| Age Group | Sudbury & Districts Males | Sudbury & Districts Females | Sudbury & Districts Total | Ontario Males | Ontario Females | Ontario Total |
|---|---|---|---|---|---|---|
| 0–4 | 5,035 | 4,720 | 9,755 | 357,300 | 340,055 | 697,360 |
| 5–9 | 5,330 | 5,005 | 10,325 | 387,320 | 368,765 | 756,085 |
| 10–14 | 5,115 | 4,945 | 10,065 | 387,000 | 367,530 | 754,530 |
| 15–19 | 5,720 | 5,450 | 11,180 | 416,730 | 394,495 | 811,670 |
| 20–24 | 6,180 | 5,860 | 12,035 | 457,815 | 436,570 | 894,390 |
| 25–29 | 5,750 | 5,735 | 11,480 | 436,345 | 438,010 | 874,350 |
| 30–34 | 5,635 | 5,720 | 11,350 | 420,800 | 443,965 | 864,765 |
| 35–39 | 5,550 | 5,875 | 11,420 | 402,900 | 439,585 | 842,485 |
| 40–44 | 5,960 | 5,970 | 11,915 | 418,465 | 453,415 | 871,875 |
| 45–49 | 6,375 | 6,440 | 12,810 | 453,105 | 484,275 | 937,385 |
| 50–54 | 7,990 | 8,250 | 16,250 | 517,170 | 539,175 | 1,056,345 |
| 55–59 | 7,820 | 8,310 | 16,130 | 482,280 | 507,180 | 989,460 |
| 60–64 | 6,825 | 7,320 | 14,150 | 406,505 | 439,640 | 846,145 |
| 65–69 | 6,230 | 6,200 | 12,420 | 352,475 | 385,270 | 737,745 |
| 70–74 | 4,330 | 4,695 | 9,025 | 250,455 | 278,185 | 528,645 |
| 75–79 | 3,135 | 3,600 | 6,735 | 179,810 | 213,195 | 393,010 |
| 80–84 | 2,050 | 2,855 | 4,905 | 126,825 | 165,360 | 291,185 |
| 85+ | 1,545 | 2,955 | 4,505 | 106,090 | 194,985 | 301,075 |
Greater Sudbury
Highlights
- The population distribution of Greater Sudbury is similar to that of the Sudbury & Districts
- There is a higher proportion of females aged 65+ (19.9%) compared to males aged 65+ (16.8%) (data not shown).
- The most prominent age group among both males (16.0%) and females (16.2%) was the 50 to 59 age group. The median age of the population in Greater Sudbury was 43.3 years.
Notes:
- Refer to Table 2.7 for a list of Census Subdivisions within Greater Sudbury Census Division.
- The percentages presented are percentage of the total population.
- Numbers in counts tables may not add up to the total due to random rounding up or down to units of 5.
- Source: 2016 Census, Statistics Canada
Figure 2.3: Population distribution by age and sex, Greater Sudbury, 2016
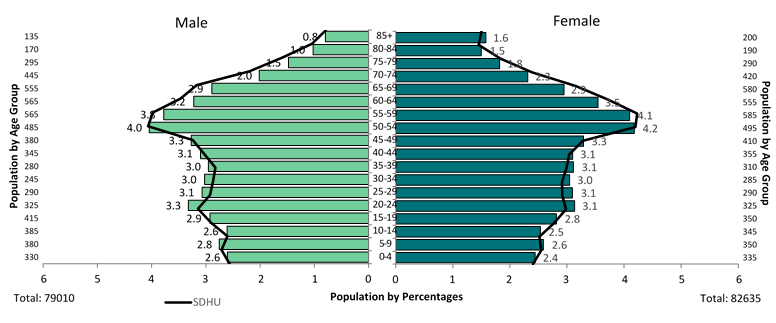
Source: 2016 Census, Statistics Canada
Table 2.4a: Percentage, population distribution by age and sex, Greater Sudbury, 2016
| Age Group | Males (% of total population) | Females (% of total population) | Total (%) |
|---|---|---|---|
| 0-4 | 2.6 | 2.4 | 5.0 |
| 5-9 | 2.8 | 2.6 | 5.4 |
| 10-14 | 2.6 | 2.5 | 5.1 |
| 15-19 | 2.9 | 2.8 | 5.7 |
| 20-24 | 3.3 | 3.1 | 6.4 |
| 25-29 | 3.1 | 3.1 | 6.2 |
| 30-34 | 3.0 | 3.0 | 6.0 |
| 35-39 | 3.0 | 3.1 | 6.1 |
| 40-44 | 3.1 | 3.1 | 6.2 |
| 45-49 | 3.3 | 3.3 | 6.6 |
| 50-54 | 4.0 | 4.2 | 8.2 |
| 55-59 | 3.8 | 4.1 | 7.9 |
| 60-64 | 3.2 | 3.5 | 6.7 |
| 65-69 | 2.9 | 2.9 | 5.8 |
| 70-74 | 2.0 | 2.3 | 4.3 |
| 75-79 | 1.5 | 1.8 | 3.3 |
| 80-84 | 1.0 | 1.5 | 2.5 |
| 85+ | 0.8 | 1.6 | 2.4 |
| TOTAL | 48.9 | 51.1 | 100 |
Table 2.4b: Count, population distribution by age and sex, Greater Sudbury, 2016
| Age Group | Males | Females | Total |
|---|---|---|---|
| 0-4 | 4,210 | 3,945 | 8,155 |
| 5-9 | 4,450 | 4,180 | 8,625 |
| 10-14 | 4,220 | 4,095 | 8,315 |
| 15-19 | 4,730 | 4,550 | 9,280 |
| 20-24 | 5,370 | 5,065 | 10,435 |
| 25-29 | 4,960 | 5,000 | 9,955 |
| 30-34 | 4,885 | 4,925 | 9,805 |
| 35-39 | 4,775 | 5,030 | 9,800 |
| 40-44 | 5,010 | 5,010 | 10,025 |
| 45-49 | 5,285 | 5,320 | 10,605 |
| 50-54 | 6,540 | 6,755 | 13,300 |
| 55-59 | 6,105 | 6,625 | 12,730 |
| 60-64 | 5,210 | 5,725 | 10,945 |
| 65-69 | 4,670 | 4,765 | 9,435 |
| 70-74 | 3,260 | 3,740 | 7,000 |
| 75-79 | 2,390 | 2,940 | 5,325 |
| 80-84 | 1,655 | 2,420 | 4,080 |
| 85+ | 1,285 | 2,550 | 3,835 |
| TOTAL | 79,010 | 82,635 | 161,650 |
Sudbury District
Highlights
- Overall, the Sudbury District has a higher proportion older individual ages 50 and over compared to Sudbury & Districts.
- There are similar proportions of females (20.9%) and males (22.1%) aged 65+ in the Sudbury District.
- The most prominent age group among males was the 55 to 69 age group and among females it was the 50 to 64 age group with approximately 29% of the population.
- The proportion of males and females aged 20 to 34 (13%) in the Sudbury District is lower than in the Sudbury & Districts overall (18%).
- The median age of the population in the Sudbury District was 50.4 years.
Notes:
- Refer to Table 2.7 for a list of Census Subdivisions within Sudbury District Census Division.
- The percentages presented are percentage of the total population.
- Numbers in counts tables may not add up to the total due to random rounding up or down to units of 5.
- Source: 2016 Census, Statistics Canada
Figure 2.4: Population distribution by age and sex, Sudbury District, 2016
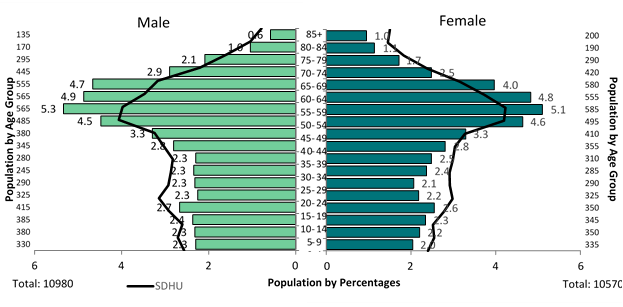
Source: 2016 Census, Statistics Canada
Table 2.5a: Percentage, population distribution by age and sex, Sudbury District, 2016
| Age Group | Males (% of total population) | Females (% of total population) | Total (%) |
|---|---|---|---|
| 0-4 | 2.3 | 2.0 | 4.3 |
| 5-9 | 2.3 | 2.2 | 4.5 |
| 10-14 | 2.4 | 2.3 | 4.7 |
| 15-19 | 2.7 | 2.6 | 5.3 |
| 20-24 | 2.3 | 2.2 | 4.5 |
| 25-29 | 2.3 | 2.1 | 4.4 |
| 30-34 | 2.3 | 2.4 | 4.7 |
| 35-39 | 2.3 | 2.5 | 4.8 |
| 40-44 | 2.8 | 2.8 | 5.6 |
| 45-49 | 3.3 | 3.3 | 6.6 |
| 50-54 | 4.5 | 4.6 | 9.1 |
| 55-59 | 5.3 | 5.1 | 10.4 |
| 60-64 | 4.9 | 4.8 | 9.7 |
| 65-69 | 4.7 | 4.0 | 8.7 |
| 70-74 | 2.9 | 2.5 | 5.4 |
| 75-79 | 2.1 | 1.7 | 3.8 |
| 80-84 | 1.0 | 1.1 | 2.1 |
| 85+ | 0.6 | 1.0 | 1.6 |
| TOTAL | 51 | 49 | 100 |
Table 2.5b: Count, population distribution by age and sex, Sudbury District, 2016
| Age Group | Males | Females | Total |
|---|---|---|---|
| 0-4 | 495 | 440 | 935 |
| 5-9 | 500 | 475 | 975 |
| 10-14 | 510 | 505 | 1,020 |
| 15-19 | 575 | 550 | 1,130 |
| 20-24 | 485 | 470 | 955 |
| 25-29 | 500 | 445 | 945 |
| 30-34 | 505 | 510 | 1,015 |
| 35-39 | 495 | 535 | 1,030 |
| 40-44 | 605 | 605 | 1,185 |
| 45-49 | 710 | 710 | 1,415 |
| 50-54 | 965 | 1,000 | 1,970 |
| 55-59 | 1,150 | 1,100 | 2,250 |
| 60-64 | 1,050 | 1,040 | 2,085 |
| 65-69 | 1,005 | 855 | 1,855 |
| 70-74 | 625 | 535 | 1,160 |
| 75-79 | 450 | 370 | 820 |
| 80-84 | 225 | 245 | 470 |
| 85+ | 125 | 205 | 330 |
| TOTAL | 10,980 | 10,570 | 21,550 |
Manitoulin District
Highlights
- Overall, the Manitoulin District has a higher proportion older individual ages 50 and over compared to Sudbury & Districts.
- There is a slightly higher proportion of females (25.3%) than males (24.2%) aged 65+ in the Manitoulin District.
- The most prominent age group among both males (25.6%) and females (25.8%) was the 55 to 69 age group.
- The proportion of males and females aged 20 to 34 (13%) in the Manitoulin District is lower than in the Sudbury & Districts overall (18%).
- The median age of the population in Manitoulin District was 49.5 years.
Notes:
- Refer to Table 2.7 for a list of Census Subdivisions within Sudbury District Census Division.
- The percentages presented are percentage of the total population.
- Numbers in counts tables may not add up to the total due to random rounding up or down to units of 5.
- Source: 2016 Census, Statistics Canada
Figure 2.5: Population distribution by age and sex, Manitoulin District, 2016
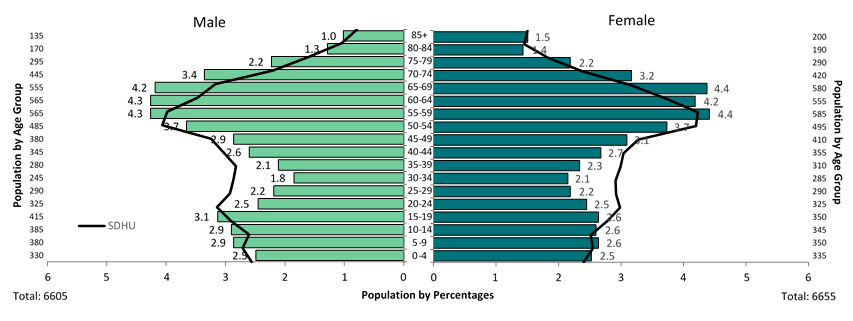
Source: 2016 Census, Statistics Canada
Table 2.6a: Percentage, population distribution by age and sex, Manitoulin District, 2016
| Age Group | Males (% of total population) | Females (% of total population) | Total (%) |
|---|---|---|---|
| 0-4 | 2.5 | 2.5 | 5.0 |
| 5-9 | 2.9 | 2.6 | 5.5 |
| 10-14 | 2.9 | 2.6 | 5.5 |
| 15-19 | 3.1 | 2.6 | 5.7 |
| 20-24 | 2.5 | 2.5 | 5.0 |
| 25-29 | 2.2 | 2.2 | 4.4 |
| 30-34 | 1.8 | 2.1 | 3.9 |
| 35-39 | 2.1 | 2.3 | 4.4 |
| 40-44 | 2.6 | 2.7 | 5.3 |
| 45-49 | 2.9 | 3.1 | 6.0 |
| 50-54 | 3.7 | 3.7 | 7.4 |
| 55-59 | 4.3 | 4.4 | 8.7 |
| 60-64 | 4.3 | 4.2 | 8.5 |
| 65-69 | 4.2 | 4.4 | 8.6 |
| 70-74 | 3.4 | 3.2 | 6.6 |
| 75-79 | 2.2 | 2.2 | 4.4 |
| 80-84 | 1.3 | 1.4 | 2.7 |
| 85+ | 1.0 | 1.5 | 2.5 |
| TOTAL | 49.8 | 50.2 | 100.0 |
Table 2.6b: Count, population distribution by age and sex, Manitoulin District, 2016
| Age Group | Males | Females | Total |
|---|---|---|---|
| 0-4 | 330 | 335 | 665 |
| 5-9 | 380 | 350 | 725 |
| 10-14 | 385 | 345 | 730 |
| 15-19 | 415 | 350 | 770 |
| 20-24 | 325 | 325 | 645 |
| 25-29 | 290 | 290 | 580 |
| 30-34 | 245 | 285 | 530 |
| 35-39 | 280 | 310 | 590 |
| 40-44 | 345 | 355 | 705 |
| 45-49 | 380 | 410 | 790 |
| 50-54 | 485 | 495 | 980 |
| 55-59 | 565 | 585 | 1,150 |
| 60-64 | 565 | 555 | 1,120 |
| 65-69 | 555 | 580 | 1,130 |
| 70-74 | 445 | 420 | 865 |
| 75-79 | 295 | 290 | 590 |
| 80-84 | 170 | 190 | 355 |
| 85+ | 135 | 200 | 340 |
| TOTAL | 6,605 | 6,655 | 13,255 |
This item was last modified on November 21, 2018