Journey to work
This section describes commuting destination for the employed labour force aged 15 years and over in private households with a usual place of work, in addition to main mode of commuting, commuting duration and time leaving for work for the Sudbury and districts labour force.
Census Division (CD) is the general term for provincially legislated areas (such as county and regional district) joined together for the purposes of regional planning and managing common services (such as police or ambulance services). Census divisions are intermediate geographic areas between the province/territory level and the municipality (census subdivision).
Census subdivision (CSD) is the general term for municipalities (as determined by provincial/territorial governments) or areas treated as municipal equivalents for statistical purposes (e.g., Indian reserves, Indian settlements and unorganized territories). Municipal status is defined by laws in effect in each province and territory in Canada.
Highlights
- Manitoulin District had a higher prevalence of people commuting to a different CSD within CD (37%) than Sudbury and districts (17%) or Greater Sudbury (0.1%).
- Sudbury District had a higher prevalence of people commuting to a different CSD and CD (39%) than Manitoulin District (9%) or Greater Sudbury (3%).
Source: Statistics Canada, 2016 Census.
Table 10.1: Commuting destination, by geographic area, aged 15+, 2016
| Commuting destination | Manitoulin District | Sudbury District | Greater Sudbury | Sudbury and districts | Ontario |
|---|---|---|---|---|---|
| Commute within CSD | 2,040 | 3,215 | 63,100 | 68,355 | 3,109,070 |
| Commute to a different CSD within CD | 1,380 36.8% | 1,230 16.9% | 35 0.1% | 2,645 3.5% | 857,565 16.0% |
| Commute to a different CSD and CD within a province/territory | 310 8.3% | 2,815 38.7% | 1,840 2.8% | 4,965 6.5% | 1,350,375 25.2% |
| Commute to a different province or territory | 10 0.3% | 15 0.2% | 220 0.3% | 245 0.3% | 38,990 0.7% |
Source: Statistics Canada, 2016 Census.
Highlights
- In Sudbury and districts, a higher proportion of the employed labour force drove to work (83%) compared to Ontario (72%).
- In Ontario, 15% of the employed labour force took public transit to work which is 3.5 times higher than in Sudbury and districts.
Source: Statistics Canada, 2016 Census.
Figure 10.1: Mode of transportation to work, by geographic area, aged 15+, 2016
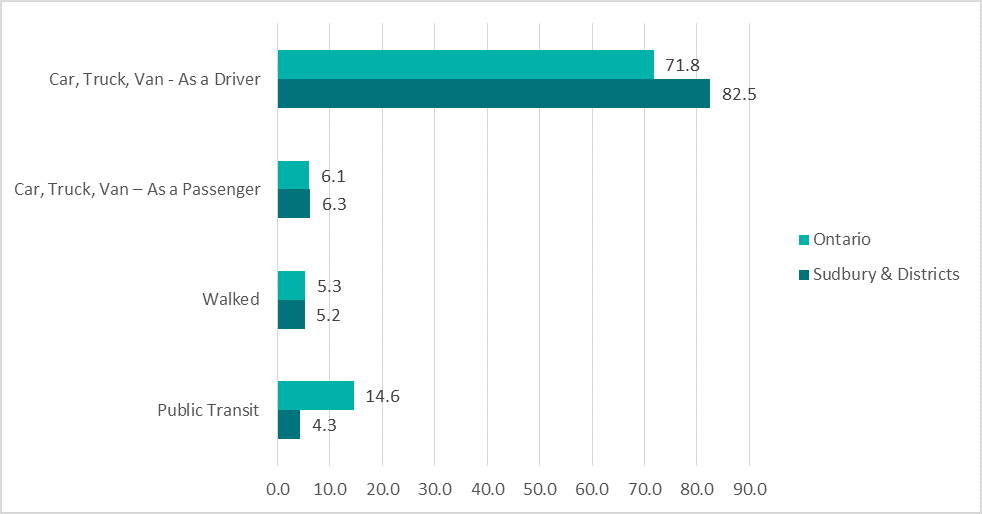
Source: Statistics Canada, 2016 Census.
Data table for Figure 10.1: Percentage (%) of mode of transportation to work, by geographic area, aged 15+, 2016
| Mode of transportation | Sudbury and districts | Ontario |
|---|---|---|
| Car, truck, van – as a driver | 82.5 | 71.8 |
| Car, truck, van – as a passenger | 6.3 | 6.1 |
| Walked | 5.2 | 5.3 |
| Public transit | 4.3 | 14.6 |
Highlights
- Manitoulin District had a higher prevalence of people commuting less than 15 minutes (51%) compared to Sudbury and districts overall (35%) and Ontario (24%).
- Overall, Sudbury and districts had a lower proportion of people commuting 45 minutes and over (10%) compared to Ontario (23%).
Source: Statistics Canada, 2016 Census.
Table 10.2: Commuting duration, by geographic area, aged 15+, 2016
| Commuting duration | Manitoulin District | Sudbury District | Greater Sudbury | Sudbury and districts | Ontario |
|---|---|---|---|---|---|
| Less than 15 minutes | 2,210 51.3% | 3,485 41.0% | 24,735 33.7% | 30,430 35.3% | 1,463,845 24.0% |
| 15 to 29 minutes | 1,005 23.3% | 1,710 20.1% | 30,770 41.9% | 33,485 38.8% | 1,964,690 32.2% |
| 30 to 44 minutes | 645 15.0% | 1,160 13.6% | 12,050 16.4% | 13,855 16.1% | 1,295,375 21.3% |
| 45 to 59 minutes | 245 5.7% | 1,080 12.7% | 3,560 4.8% | 4,885 5.7% | 612,415 10.1% |
| 60 minutes and over | 195 4.5% | 1,070 12.6% | 2,350 3.2% | 3,615 4.2% | 756,385 12.4% |
Source: Statistics Canada, 2016 Census.
Highlights
- Manitoulin District had a higher prevalence of people leaving for work between 7 and 9 a.m. (66%) than Sudbury and districts (49%) or Ontario (48%).
- Sudbury District had a higher prevalence of people leaving for work between 5 and 7 a.m. (34%) than Sudbury and districts (28%) or Ontario (24%)
Source: Statistics Canada, 2016 Census.
Table 10.3: Time leaving for work, by geographic area, aged 15+, 2016
| Time leaving for work | Manitoulin District | Sudbury District | Greater Sudbury | Sudbury and districts | Ontario |
|---|---|---|---|---|---|
| Between 5 and 6:59 am | 650 15.1% | 2855 33.6% | 20,220 27.5% | 23,725 27.5% | 1,452,770 23.8% |
| Between 7 and 9 a.m. | 2850 66.2% | 3635 42.7% | 35,605 48.5% | 42,090 48.8% | 2,929,100 48.1% |
| Any time after 9 a.m. | 800 18.6% | 2015 23.7% | 17,650 24.0% | 20,465 23.7% | 1,713,845 28.1% |
Source: Statistics Canada, 2016 Census.
This item was last modified on November 22, 2018