All cancers
The following section of the report has information on selected types of cancers, except non-melanoma skin cancers which are not tracked by cancer registries in Canada.
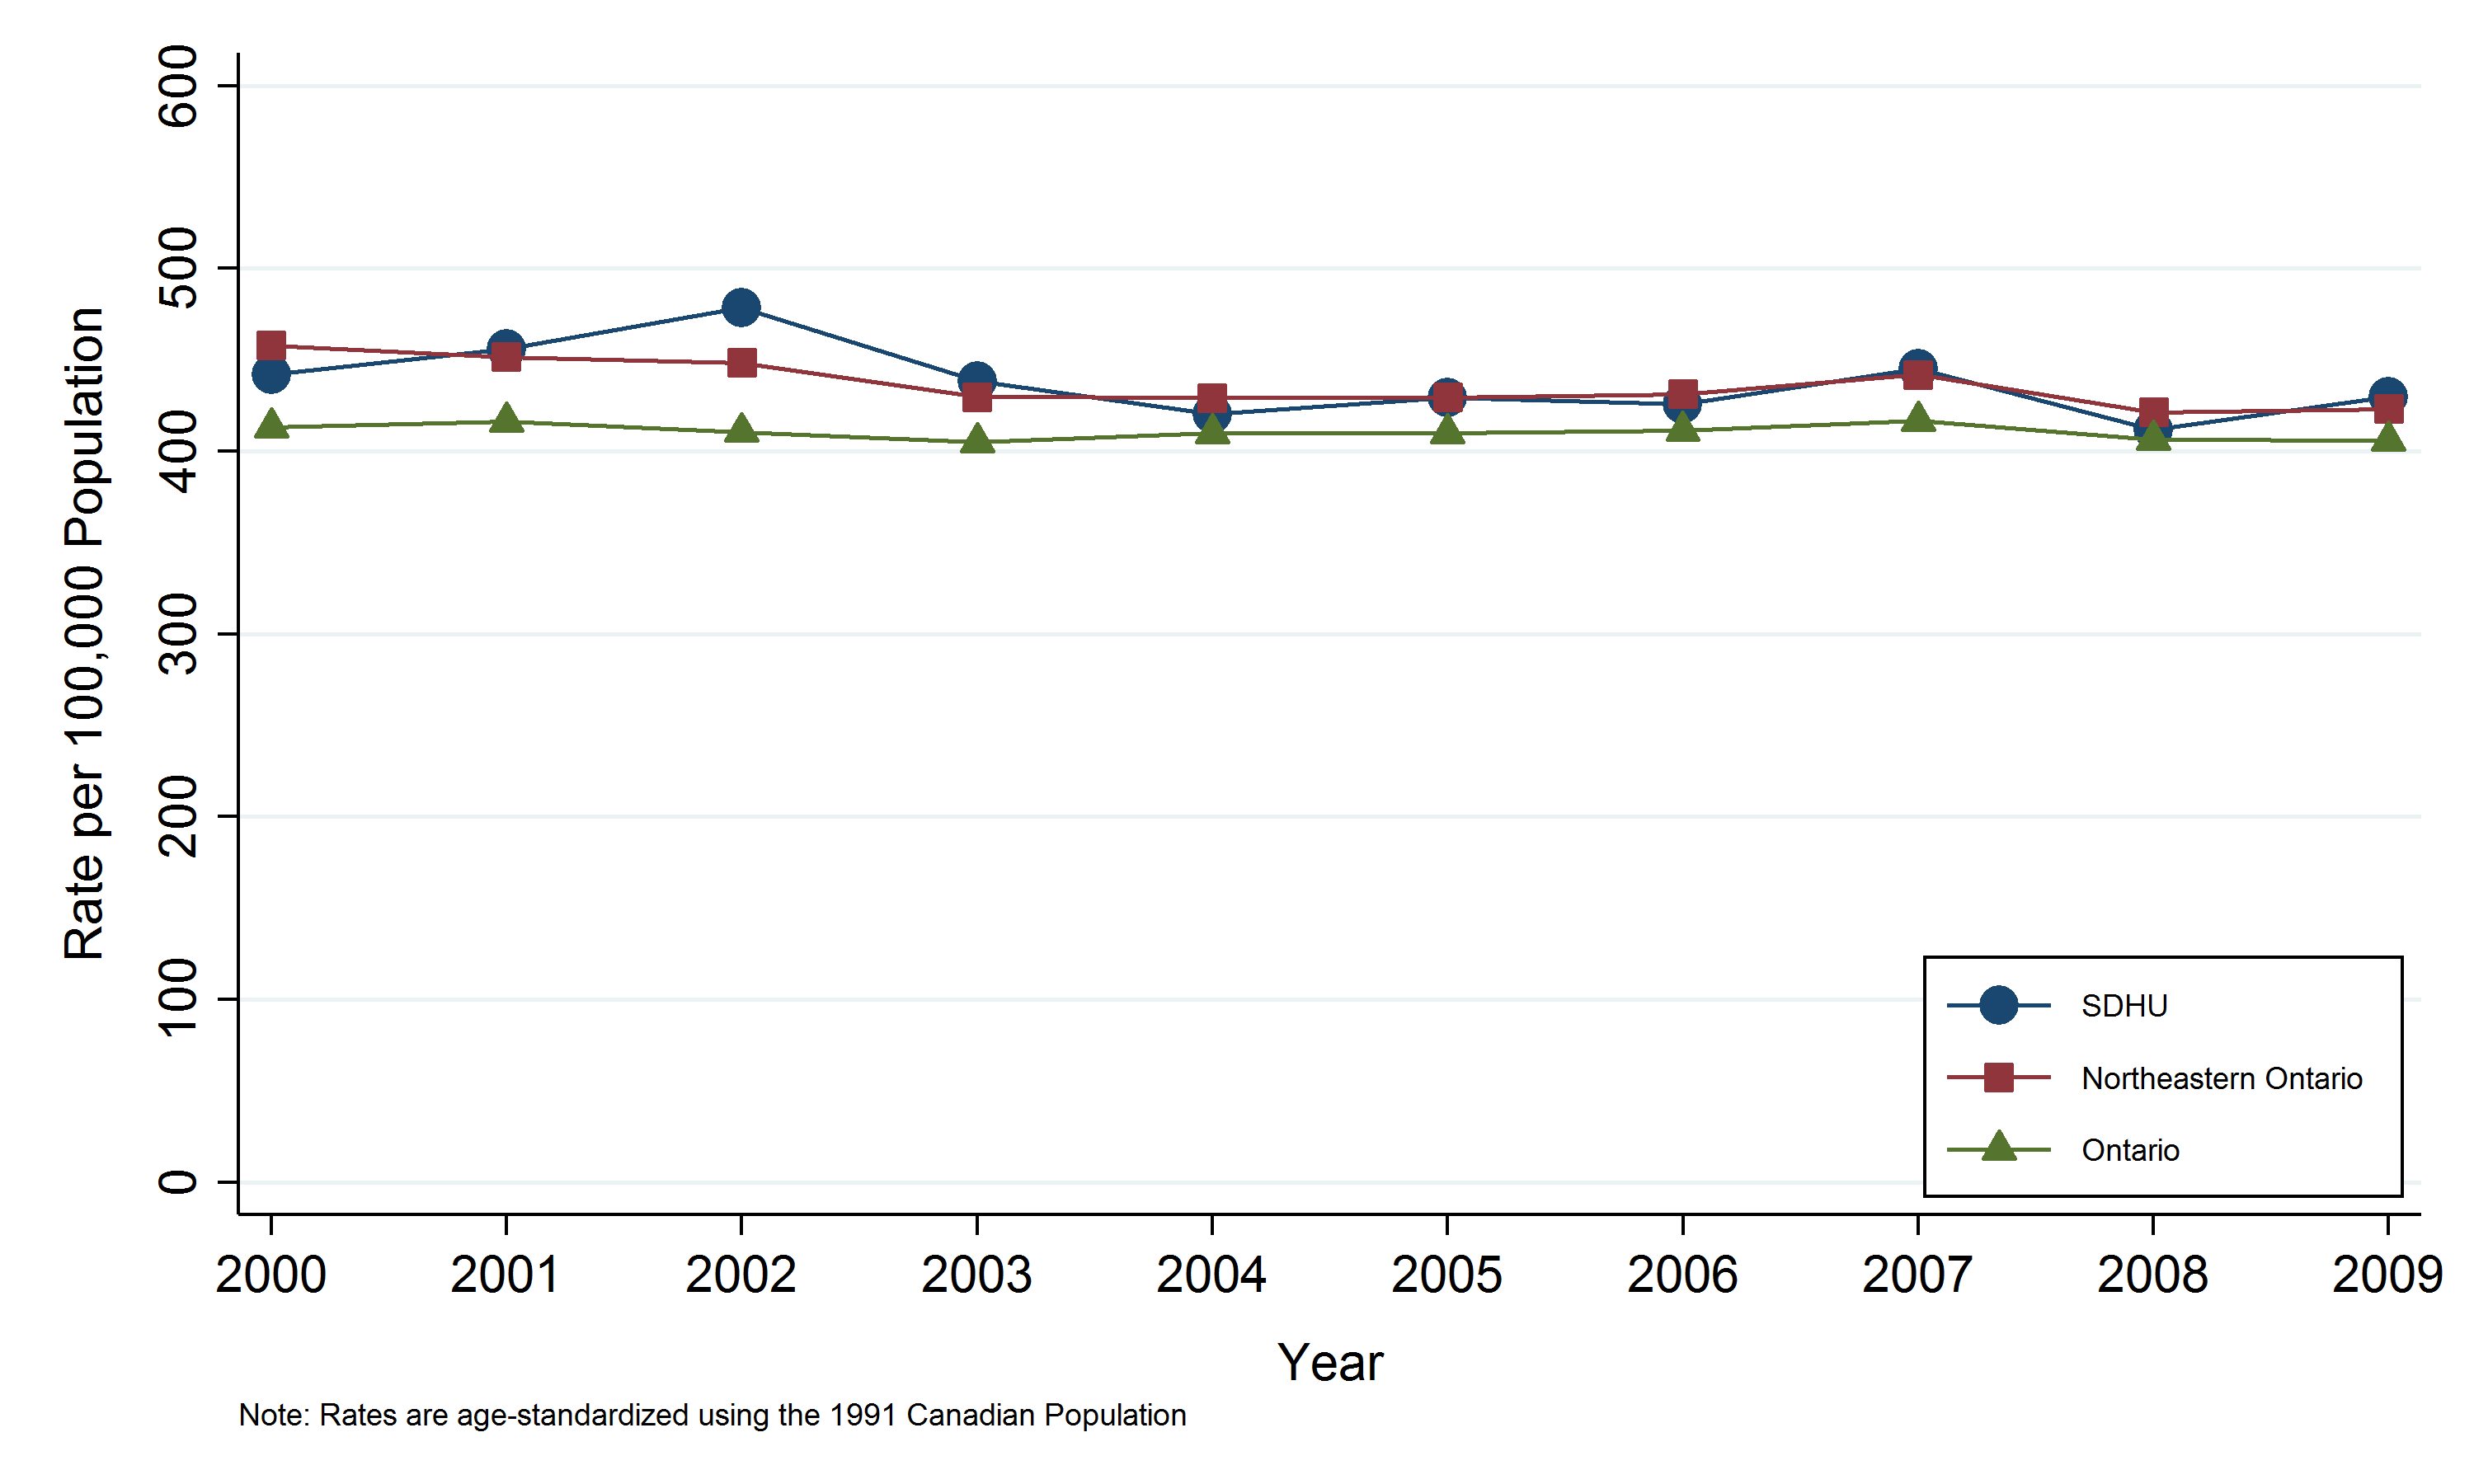
All cancers by geographic area
Overall findings:
- In the Sudbury & District Health Unit (SDHU) area, there was a total of 1,180 new cases of cancer in 2009.
- In 2009, the cancer rate in the SDHU area was 430 new cases per 100,000 population.
- The rate of cancer in the SDHU area has been similar to that of northeastern Ontario, while rates in both areas have been consistently higher than the rate of cancer in Ontario overall.
- Between 2000 and 2009, the rate of cancer in the SDHU area has generally remained stable.
Notes:
- Rates are age-standardized using the 1991 Canadian population.
- Data Source: Ontario Cancer Registry and Population Estimates, Cancer Care Ontario, SEER*Stat, Oct. 2012 release.
Figure: Annual age-standardized cancer incidence rate, all cancers, by geographic area, 2000–2009

Table: Annual age-standardized cancer incidence rate, all cancers, by geographic area, 2000–2009
| Geographic Area | 2000 | 2001 | 2002 | 2003 | 2004 | 2005 | 2006 | 2007 | 2008 | 2009 |
| SDHU | 441.9 | 456.0 | 478.3 | 438.2 | 420.2 | 429.4 | 425.5 | 445.0 | 411.9 | 429.7 |
| Northeast Ontario | 457.8 | 451.5 | 448.5 | 429.7 | 429.2 | 429.4 | 431.3 | 441.9 | 421.3 | 423.1 |
| Ontario | 413.0 | 416.3 | 410.6 | 404.9 | 410.1 | 410.0 | 411.3 | 416.8 | 406.2 | 405.9 |
Table: Annual number of cancer incidence cases, all cancers, by geographic area, 2000–2009
| Geographic Area | 2000 | 2001 | 2002 | 2003 | 2004 | 2005 | 2006 | 2007 | 2008 | 2009 |
| SDHU | 1023 | 1080 | 1151 | 1078 | 1053 | 1101 | 1113 | 1188 | 1124 | 1180 |
| Northeast Ontario | 3218 | 3230 | 3246 | 3193 | 3250 | 3312 | 3398 | 3529 | 3449 | 3514 |
| Ontario | 53025 | 54765 | 55411 | 56104 | 58264 | 59702 | 61297 | 63809 | 63891 | 65338 |
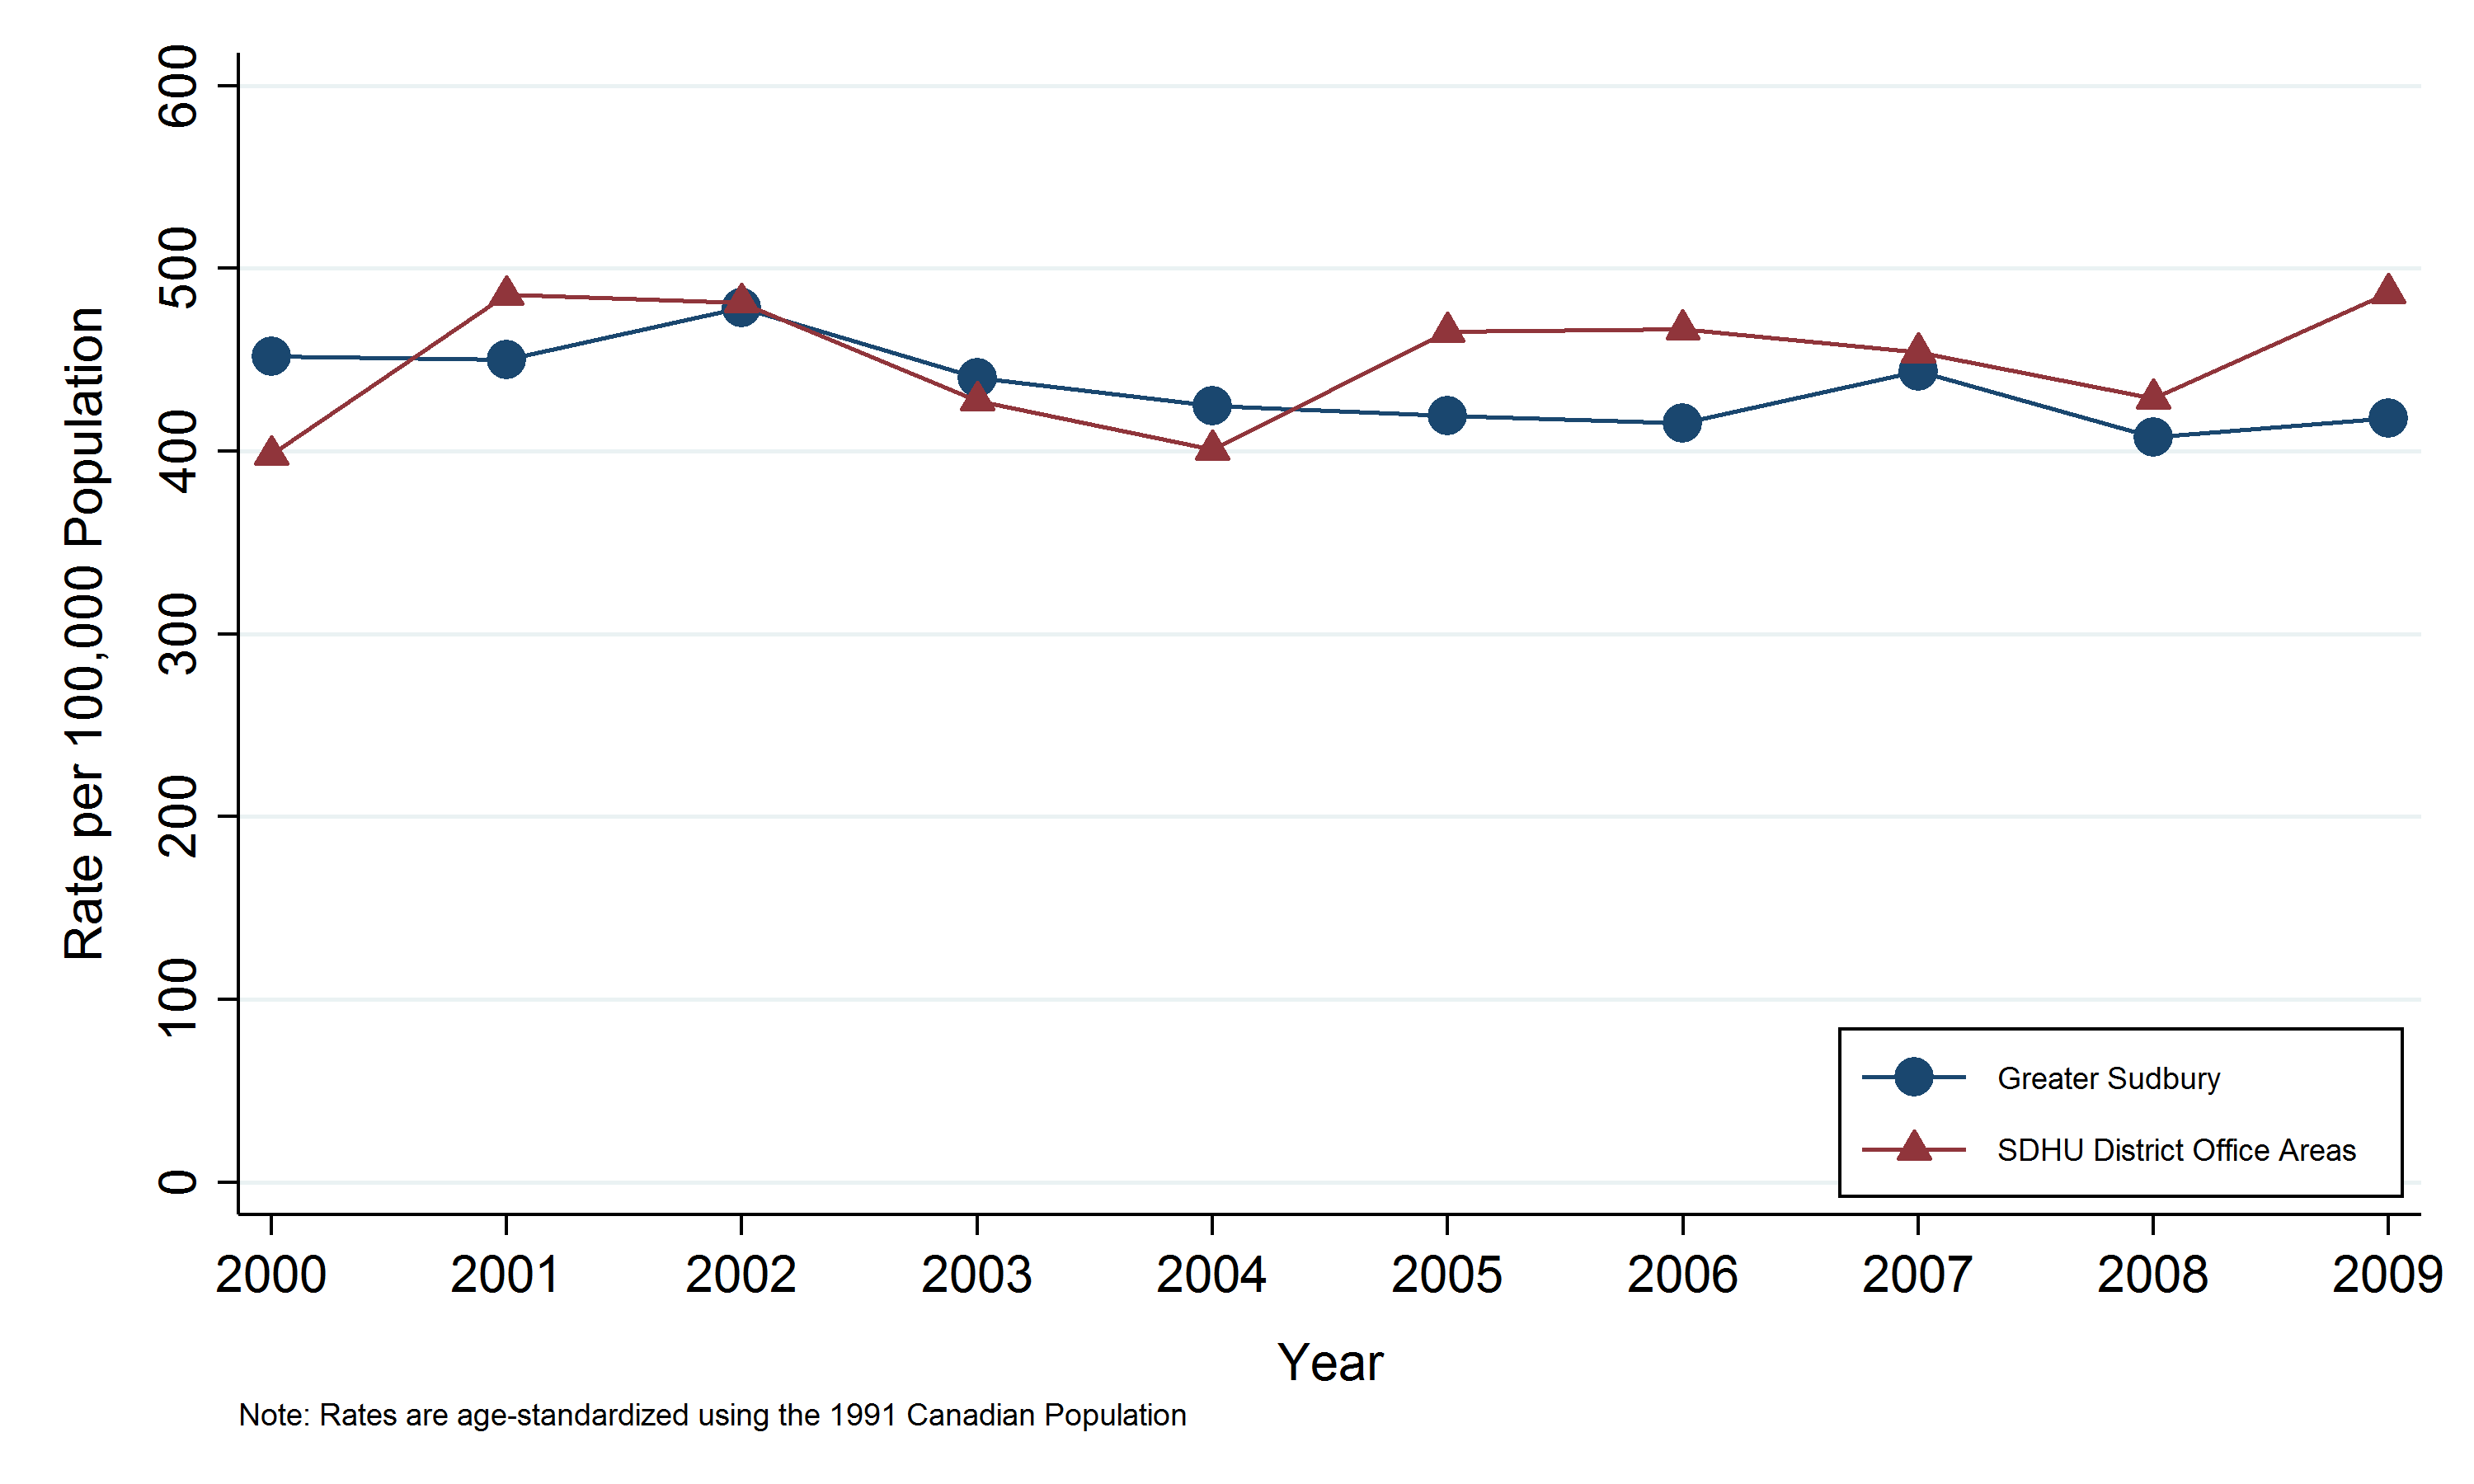
All cancers by Greater Sudbury and outlying areas
Key findings:
- In 2009, there were 927 new cases of cancer among residents of Greater Sudbury and 253 new cases among residents of the SDHU district office areas.
- The rate of cancer was 418 new cases per 100,000 population residing in Greater Sudbury and 487 new cases per 100,000 population residing in the SDHU district office areas.
- The rate of cancer among residents of Greater Sudbury has generally been similar to the rate among residents of the SDHU district office areas.
- The rate of cancer among residents in Greater Sudbury decreased slightly between 2000 and 2009, while no overall trend is evident in the rate among residents of the SDHU district office areas.
Notes:
- Rates are age-standardized using the 1991 Canadian population.
- Data Source: Ontario Cancer Registry and Population Estimates, Cancer Care Ontario, SEER*Stat, Oct. 2012 release.
Figure: Annual age-standardized incidence rate, all cancers, Greater Sudbury vs. Sudbury & District Health Unit (SDHU) district office areas, 2000–2009
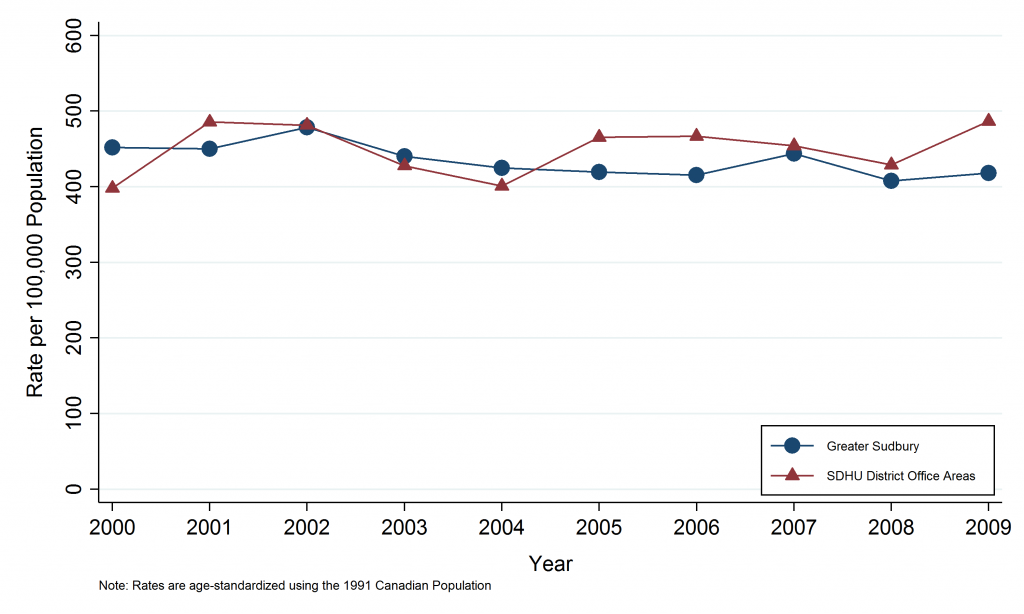
Table: Annual age-standardized incidence rate, all cancers, Greater Sudbury vs. Sudbury & District Health Unit (SDHU) district office areas, 2000–2009
| Census Division | 2000 | 2001 | 2002 | 2003 | 2004 | 2005 | 2006 | 2007 | 2008 | 2009 |
| SDHU District Office Areas | 398.0 | 485.5 | 481.4 | 427.7 | 401.0 | 465.3 | 466.7 | 454.2 | 428.8 | 486.7 |
| Manitoulin District | 426.5 | 539.5 | 523.8 | 427.1 | 336.5 | 443.1 | 391.2 | 509.6 | 435.4 | 456.8 |
| Sudbury District | 389.9 | 458.5 | 457.6 | 430.0 | 436.0 | 483.6 | 514.8 | 412.5 | 423.1 | 505.3 |
| City of Greater Sudbury | 452.1 | 450.0 | 478.3 | 440.1 | 424.6 | 419.6 | 415.4 | 443.8 | 407.5 | 418.0 |
Table: Annual number of incidence cases, all cancers, Greater Sudbury vs. Sudbury & District Health Unit (SDHU) district office areas, 2000–2009
| Census Division | 2000 | 2001 | 2002 | 2003 | 2004 | 2005 | 2006 | 2007 | 2008 | 2009 |
| SDHU District Office Areas | 182 | 221 | 227 | 207 | 199 | 234 | 243 | 241 | 232 | 253 |
| Manitoulin District | 71 | 90 | 93 | 79 | 63 | 85 | 83 | 108 | 92 | 95 |
| Sudbury District | 111 | 131 | 134 | 128 | 136 | 149 | 160 | 133 | 140 | 158 |
| City of Greater Sudbury | 841 | 859 | 924 | 871 | 854 | 867 | 870 | 947 | 892 | 927 |
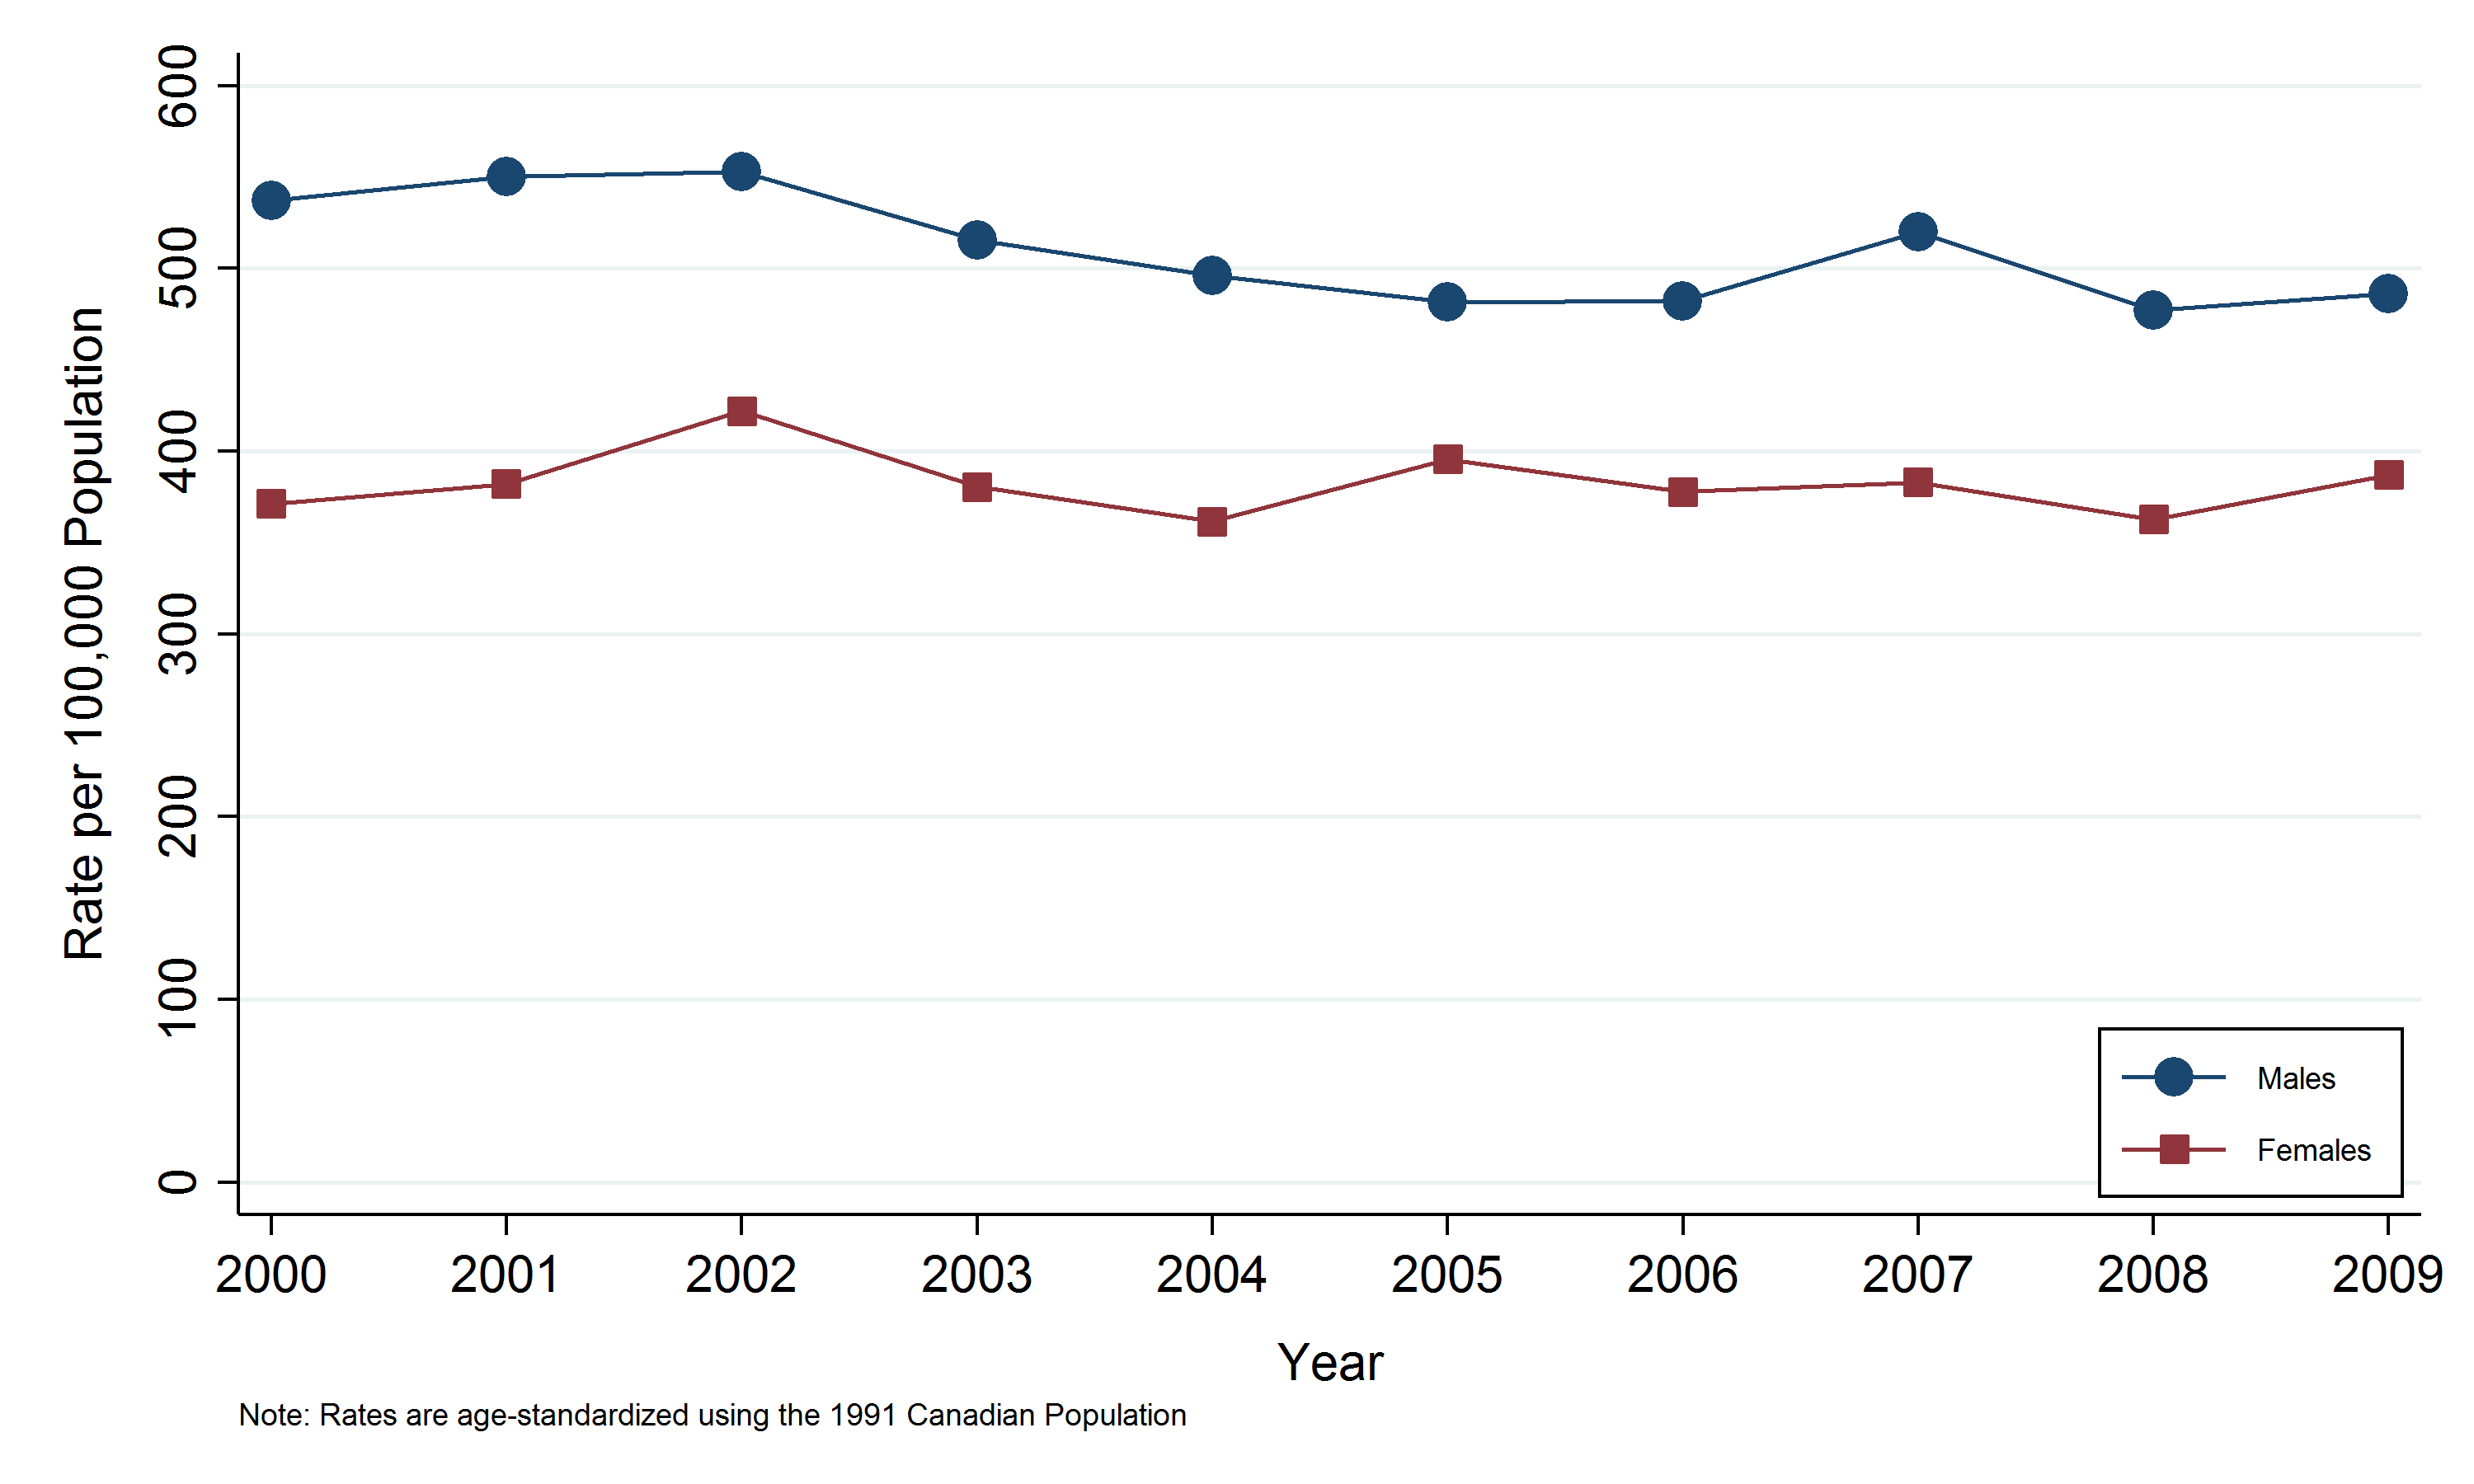
All cancers by sex
Key findings:
- In 2009, a total of 616 males and 564 females were diagnosed with cancer in the SDHU area.
- In the SDHU area, the rate of cancer in 2009 was 486 new cases per 100,000 males and 387 new cases per 100,000 females.
- The cancer rate among males has been consistently higher than the rate among females.
- In general, the rate of cancer in men has decreased while the rate among females has remained stable between 2000 and 2009.
Notes:
- Rates are age-standardized using the 1991 Canadian population.
- Data Source: Ontario Cancer Registry and Population Estimates, Cancer Care Ontario, SEER*Stat, Oct. 2012 release.
Figure: Annual age-standardized incidence rate, all cancers, by sex, Sudbury & District Health Unit (SDHU) area, 2000–2009
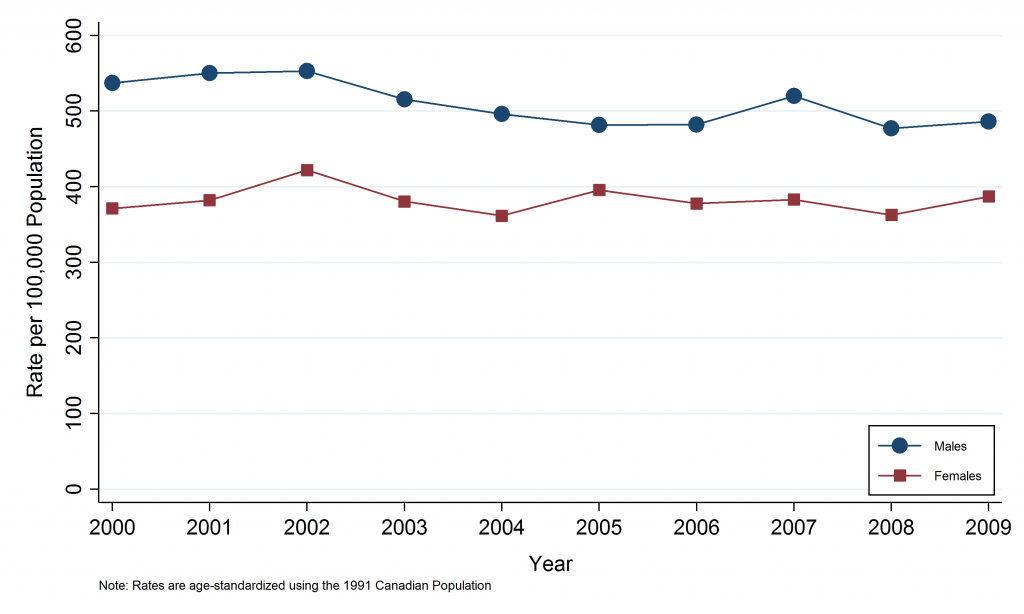
Table: Annual age-standardized incidence rate, all cancers, by sex, Sudbury & District Health Unit (SDHU) area, 2000–2009
| Sex | 2000 | 2001 | 2002 | 2003 | 2004 | 2005 | 2006 | 2007 | 2008 | 2009 |
| Both | 441.9 | 456.0 | 478.3 | 438.2 | 420.2 | 429.4 | 425.5 | 445 | 411.9 | 429.7 |
| Males | 537.1 | 550.3 | 553.1 | 515.6 | 495.9 | 481.6 | 482.3 | 520.2 | 477.3 | 486.3 |
| Females | 371.2 | 382.1 | 421.9 | 380.6 | 361.6 | 395.6 | 377.8 | 382.9 | 362.7 | 387.1 |
Table: Annual number of cases, all cancers, by sex, Sudbury & District Health Unit (SDHU) area, 2000–2009
| Sex | 2000 | 2001 | 2002 | 2003 | 2004 | 2005 | 2006 | 2007 | 2008 | 2009 |
| Both | 1023 | 1080 | 1151 | 1078 | 1053 | 1101 | 1113 | 1188 | 1124 | 1180 |
| Males | 569 | 601 | 611 | 585 | 572 | 567 | 584 | 648 | 610 | 616 |
| Females | 454 | 479 | 540 | 493 | 481 | 534 | 529 | 540 | 514 | 564 |
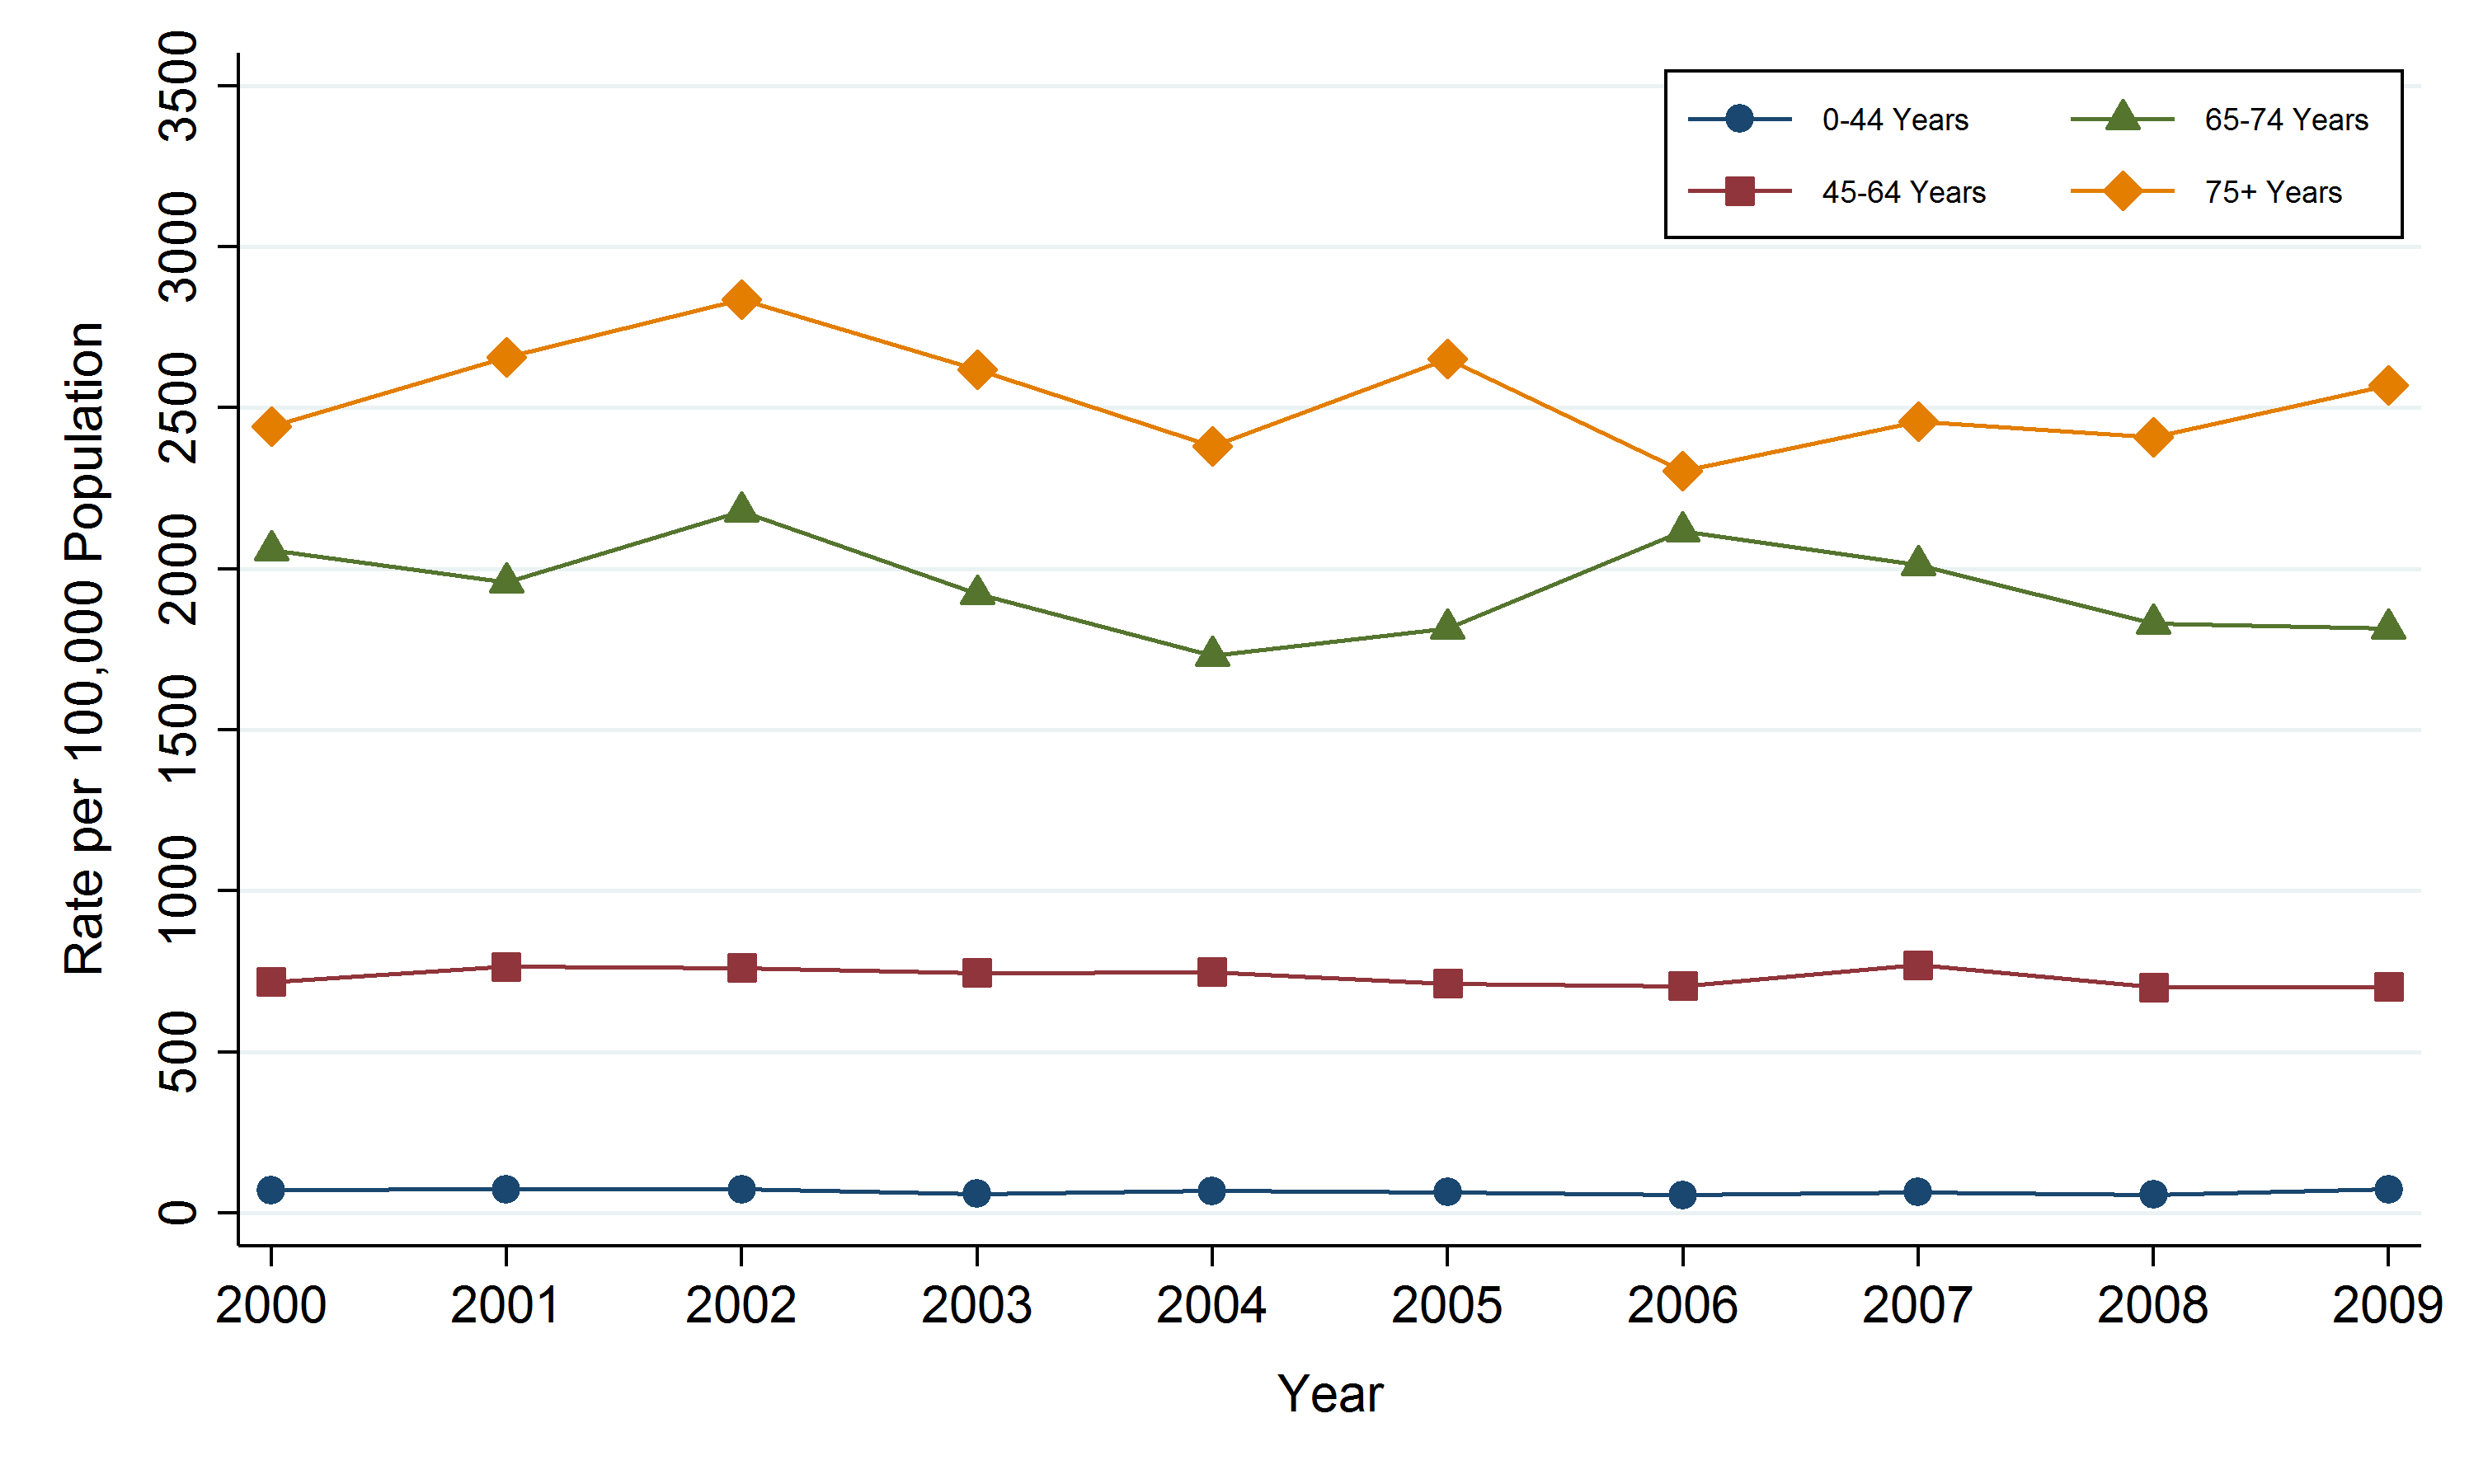
All cancers by age
Key findings:
- In the SDHU area, the highest number of new cancer cases were in the 75 and over age group, with 360 cases in 2009.
- In 2009, the highest rate of cancer was in the 75 and over age group, with 2,570 new cases per 100,000 population.
- In general, the rate of cancer increases with age.
- There is no trend evident in the rate of new cancer cases in any age group from 2000–2009.
Notes:
- Data Source: Ontario Cancer Registry and Population Estimates, Cancer Care Ontario, SEER*Stat, Oct. 2012 release.
Figure: Annual incidence rate, all cancers, by age group, Sudbury & District Health Unit (SDHU) area, 2000–2009
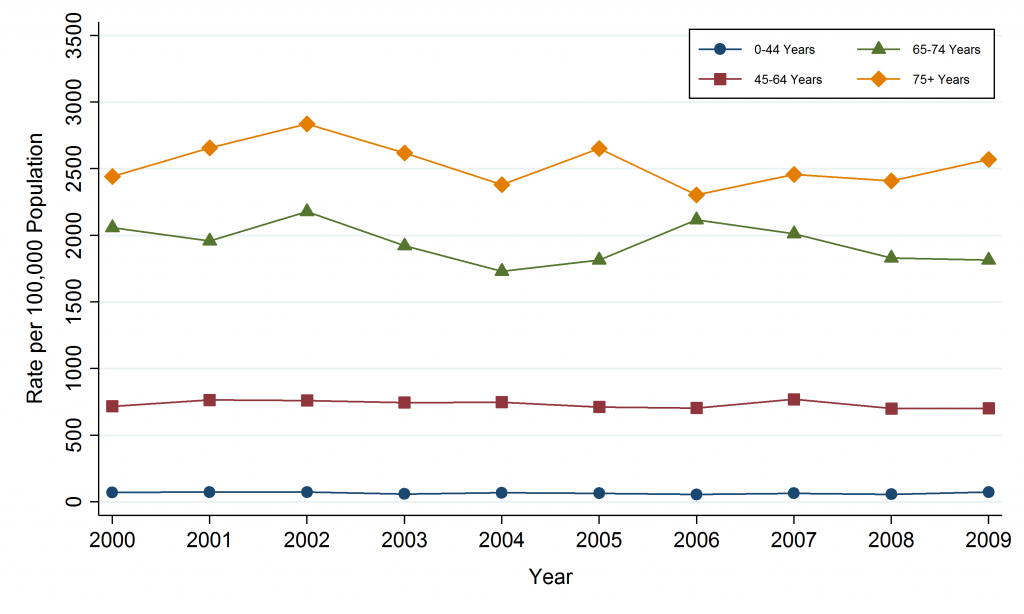
Table: Annual incidence rate, all cancers, by age group, Sudbury & District Health Unit (SDHU) area, 2000–2009
| Age at Diagnosis | 2000 | 2001 | 2002 | 2003 | 2004 | 2005 | 2006 | 2007 | 2008 | 2009 |
| 20-44 | 103.4 | 109.6 | 117.6 | 86.3 | 107.1 | 99.3 | 84.1 | 100.0 | 91.8 | 114.4 |
| 45-64 | 718.6 | 765.8 | 762.2 | 746.2 | 749.4 | 713.4 | 704.9 | 770.0 | 701.5 | 702.5 |
| 65-74 | 2058.0 | 1957.9 | 2178.7 | 1921.6 | 1730.2 | 1816.0 | 2116.3 | 2012.4 | 1831.4 | 1815.7 |
| 75+ | 2441.6 | 2657.6 | 2837.0 | 2618.1 | 2380.9 | 2652.5 | 2304.2 | 2458.4 | 2408.1 | 2569.6 |
Table: Annual number of cases, all cancers, by age group, Sudbury & District Health Unit (SDHU) area, 2000–2009
| Age at Diagnosis | 2000 | 2001 | 2002 | 2003 | 2004 | 2005 | 2006 | 2007 | 2008 | 2009 |
| 20-44 | 81 | 86 | 90 | 63 | 76 | 73 | 65 | 71 | 64 | 77 |
| 45-64 | 345 | 376 | 385 | 390 | 403 | 394 | 396 | 447 | 414 | 423 |
| 65-74 | 325 | 311 | 345 | 304 | 277 | 294 | 346 | 333 | 310 | 314 |
| 75+ | 259 | 295 | 326 | 311 | 291 | 333 | 300 | 330 | 332 | 360 |
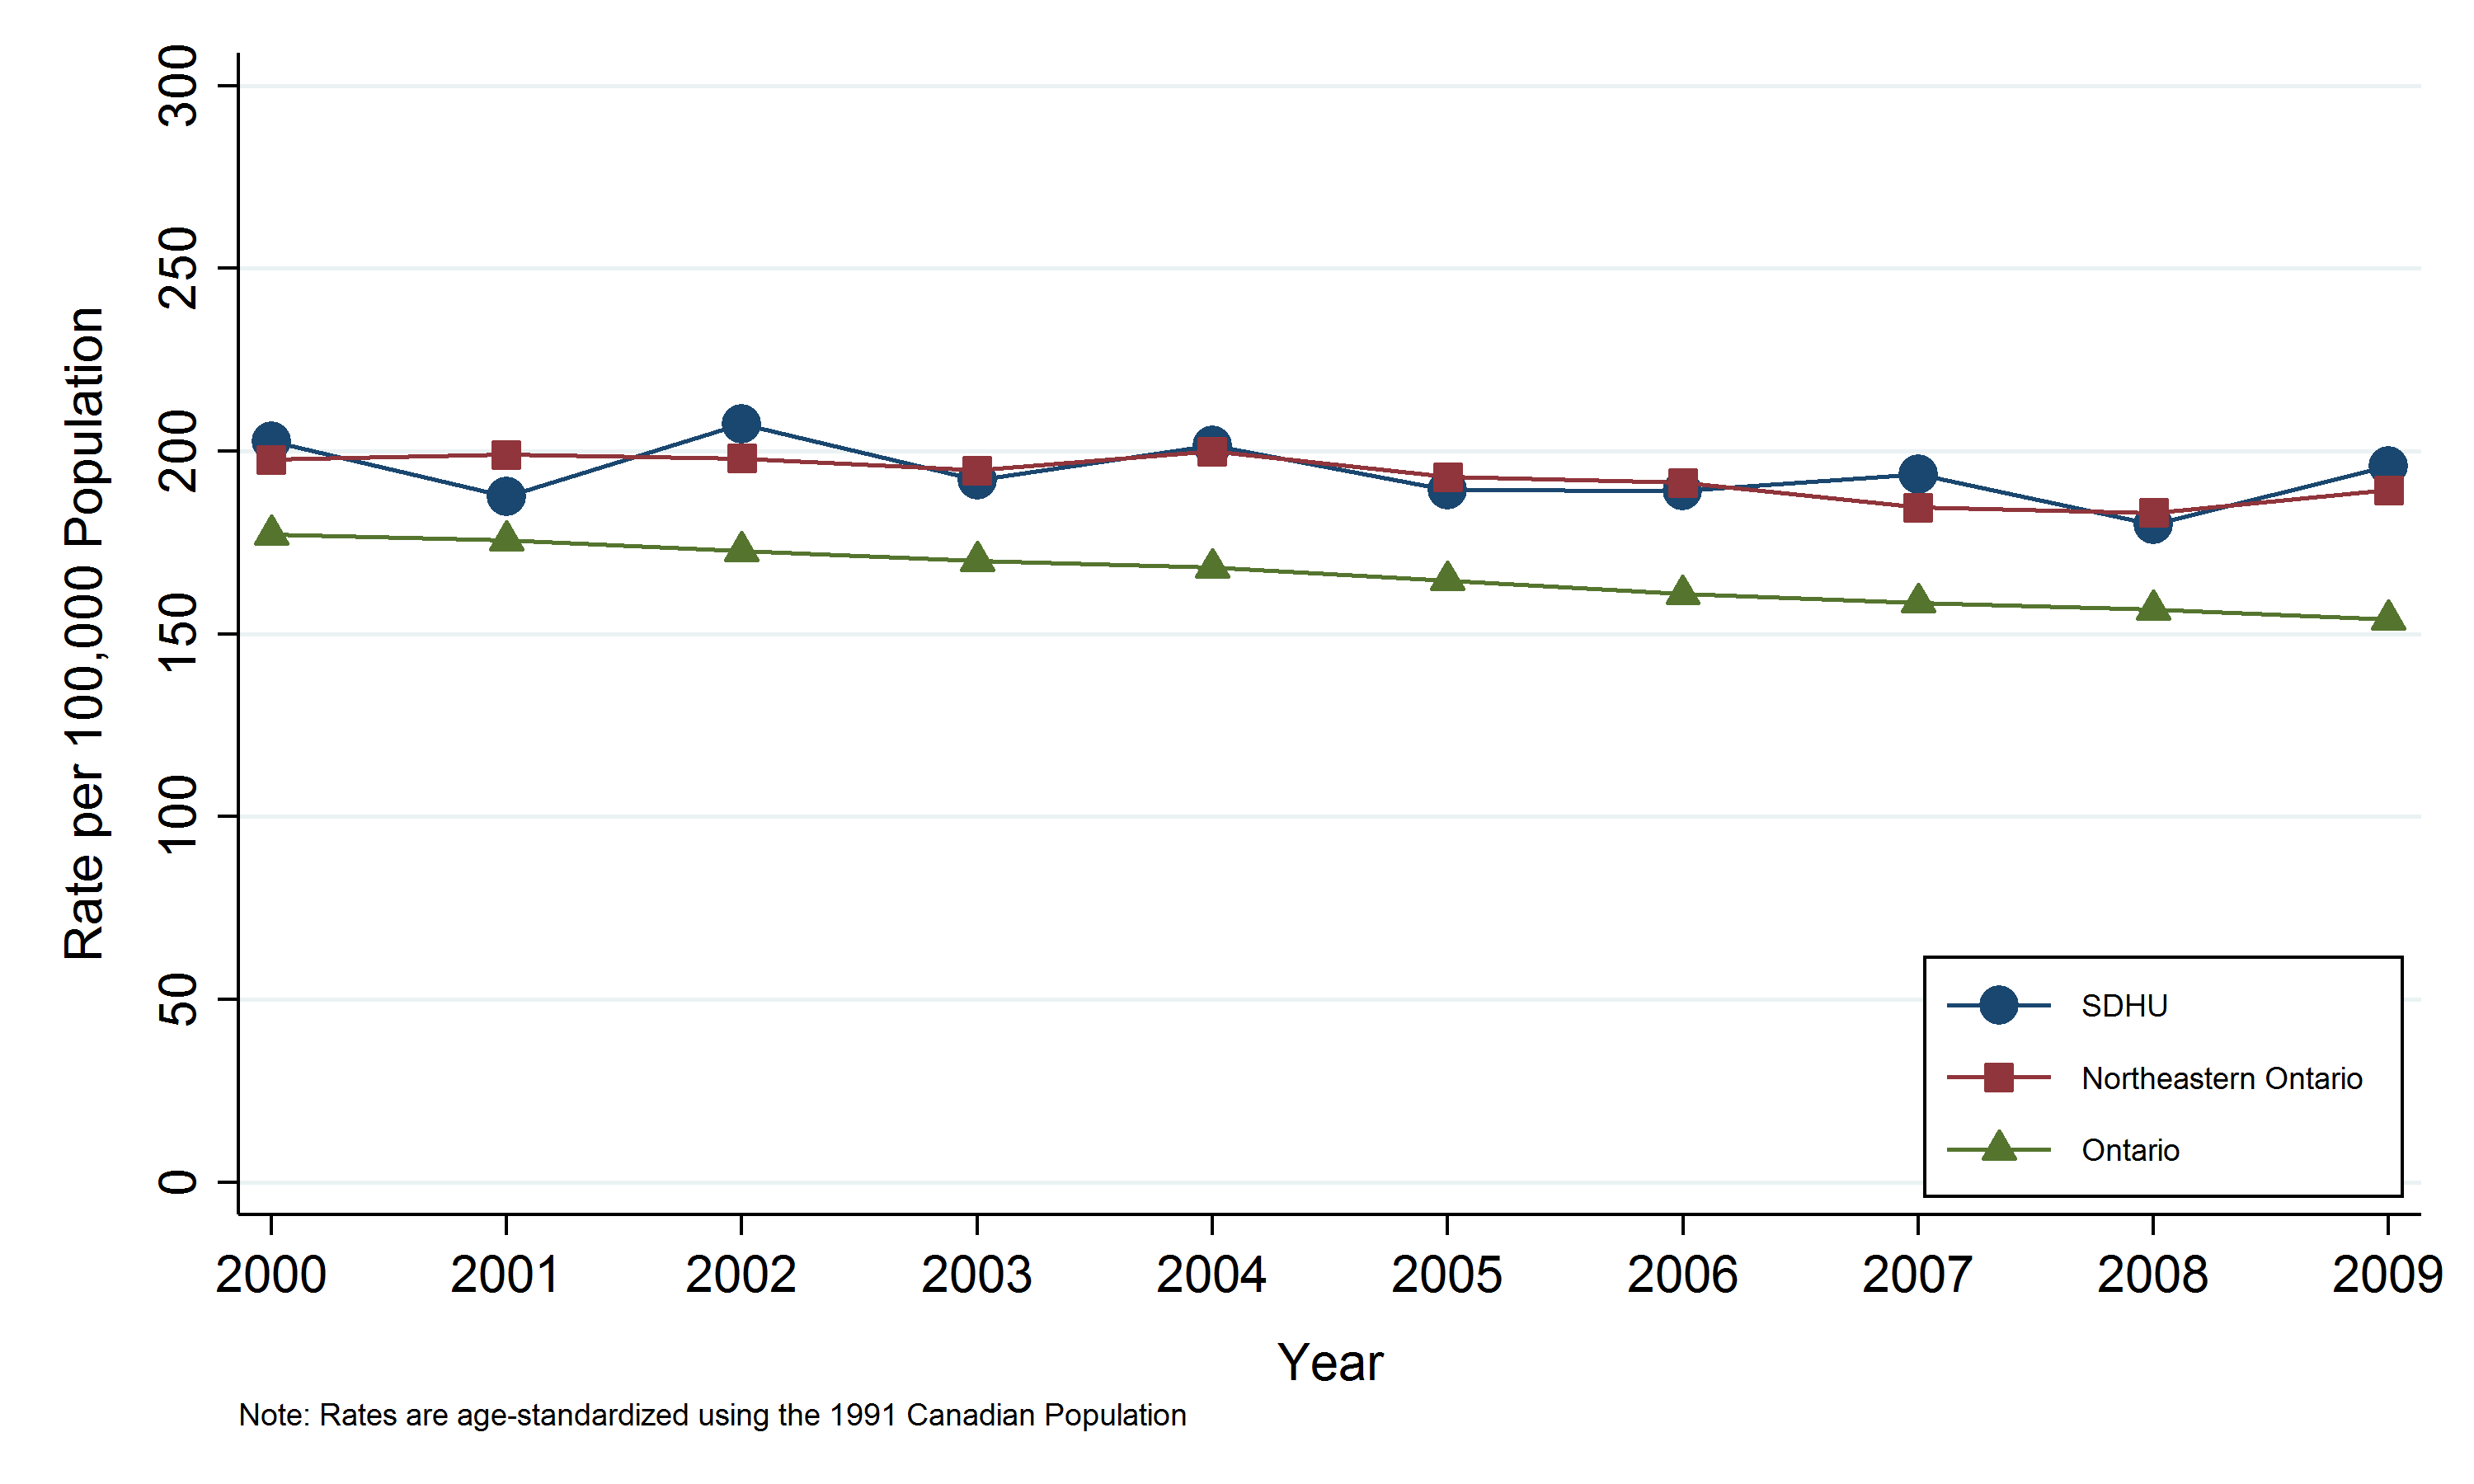
All cancers deaths by geographic area
Key findings:
- In the SDHU area, there were 561 deaths due to all cancers in 2009.
- In 2009, the rate of cancer mortality in the SDHU area was 196 deaths per 100,000 population.
- The rate of cancer mortality in the SDHU area has generally been similar to that of northeastern Ontario, while the rates in both the SDHU area and northeastern Ontario have consistently been higher than the Ontario rate.
- Between 2000 and 2009, the rate of cancer mortality in the SDHU area was fairly stable.
Notes:
- Rates are age-standardized using the 1991 Canadian population.
- Data Source: Ontario Cancer Registry and Population Estimates, Cancer Care Ontario, SEER*Stat, Oct. 2012 release.
Figure: Annual age-standardized mortality rate, all cancers, by geographic area, 2000–2009
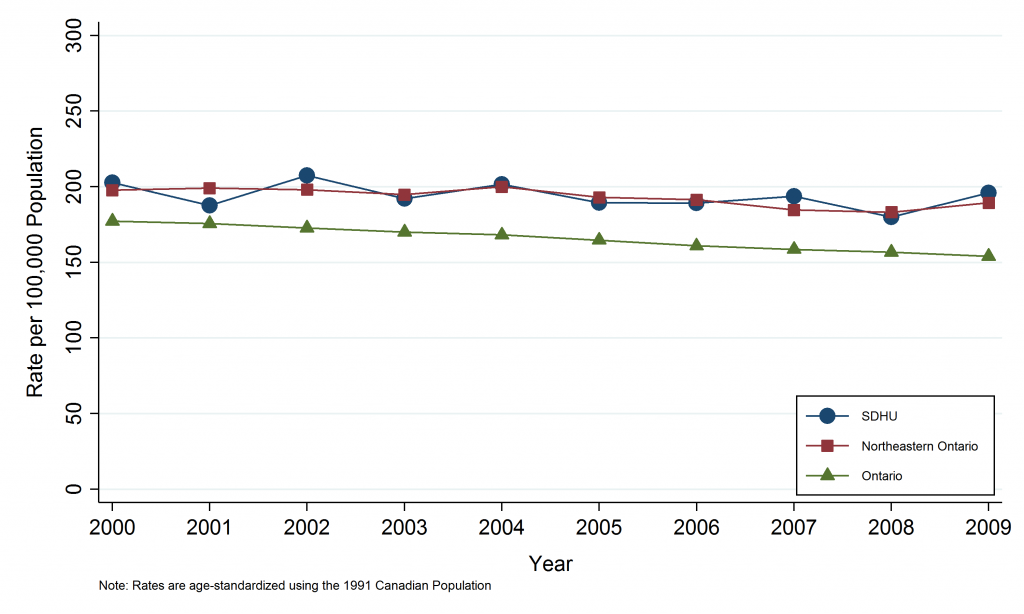
Table: Annual age-standardized mortality rate, all cancers, by geographic area, 2000–2009
| Geographic Area | 2000 | 2001 | 2002 | 2003 | 2004 | 2005 | 2006 | 2007 | 2008 | 2009 |
| SDHU | 202.7 | 187.7 | 207.5 | 192.0 | 201.6 | 189.5 | 189.2 | 193.7 | 180.0 | 196.0 |
| Northeast Ontario | 197.7 | 199.0 | 198.0 | 194.7 | 200.0 | 193.0 | 191.4 | 184.6 | 183.1 | 189.4 |
| Ontario | 177.2 | 175.7 | 172.8 | 170.0 | 168.1 | 164.7 | 160.9 | 158.6 | 156.7 | 154.0 |
Table: Annual number of cases, all cancers, by geographic area, 2000–2009
| Geographic Area | 2000 | 2001 | 2002 | 2003 | 2004 | 2005 | 2006 | 2007 | 2008 | 2009 |
| SDHU | 473 | 444 | 502 | 481 | 513 | 496 | 508 | 530 | 506 | 561 |
| Northeast Ontario | 1407 | 1442 | 1463 | 1483 | 1548 | 1534 | 1566 | 1544 | 1563 | 1658 |
| Ontario | 23143 | 23581 | 23870 | 24183 | 24590 | 24817 | 24969 | 25369 | 25794 | 26076 |
This item was last modified on March 26, 2018