Lung cancer
Lung cancer is the growth of abnormal cells in the lungs as tumours. There are many risk factors (Public Health Agency of Canada), but the most common cause for lung cancer (Public Health Agency of Canada) is smoking.
Lung cancer by geographic area
Key findings:
- In the Sudbury & District Health Unit (SDHU) area, there were 202 new cases of lung cancer in 2009.
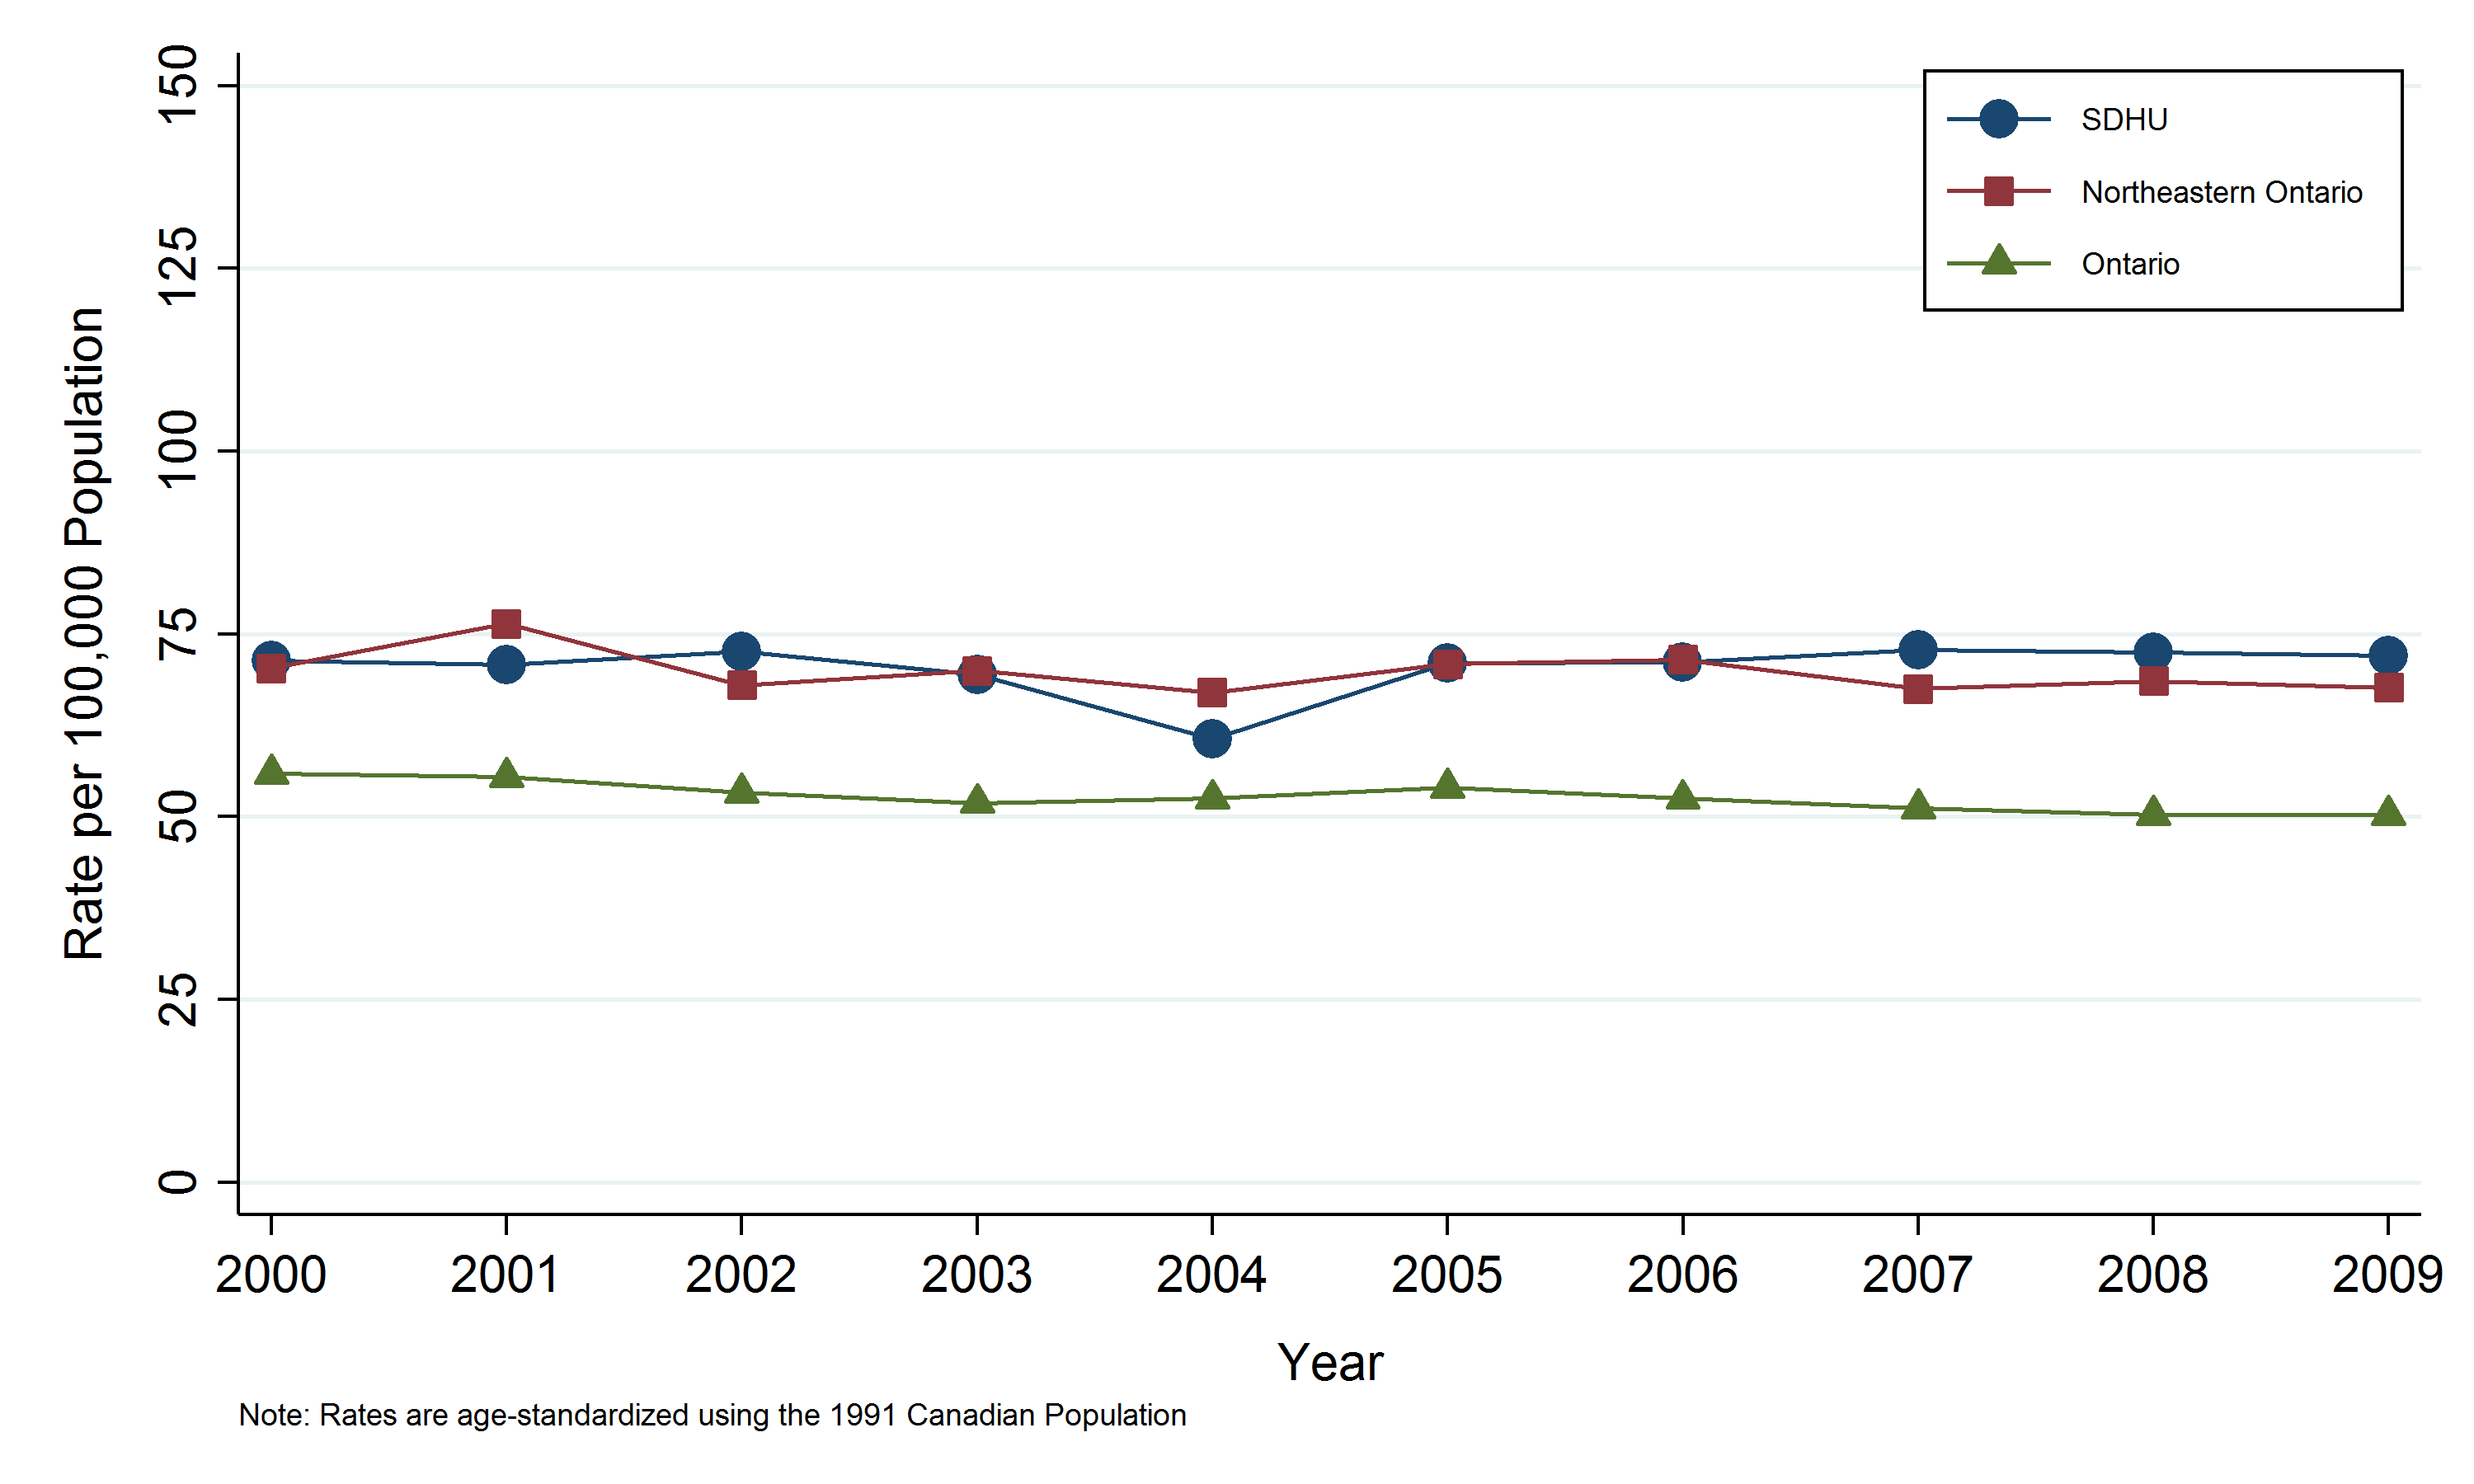
- In 2009, the lung cancer rate in the SDHU area was 72 new cases per 100,000 population.
- The lung cancer rate in the SDHU area is generally similar to that in northeastern Ontario, and the rates in both the SDHU area and northeastern Ontario are consistently higher than that of Ontario.
- Between 2000 and 2009, the rate of lung cancer in the SDHU area was fairly stable.
Notes:
- Rates are age-standardized using the 1991 Canadian population.
- Data Source: Ontario Cancer Registry and Population Estimates, Cancer Care Ontario, SEER*Stat, Oct. 2012 release.
Figure: Annual age-standardized incidence rate, lung cancer, by geographic area, 2000–2009
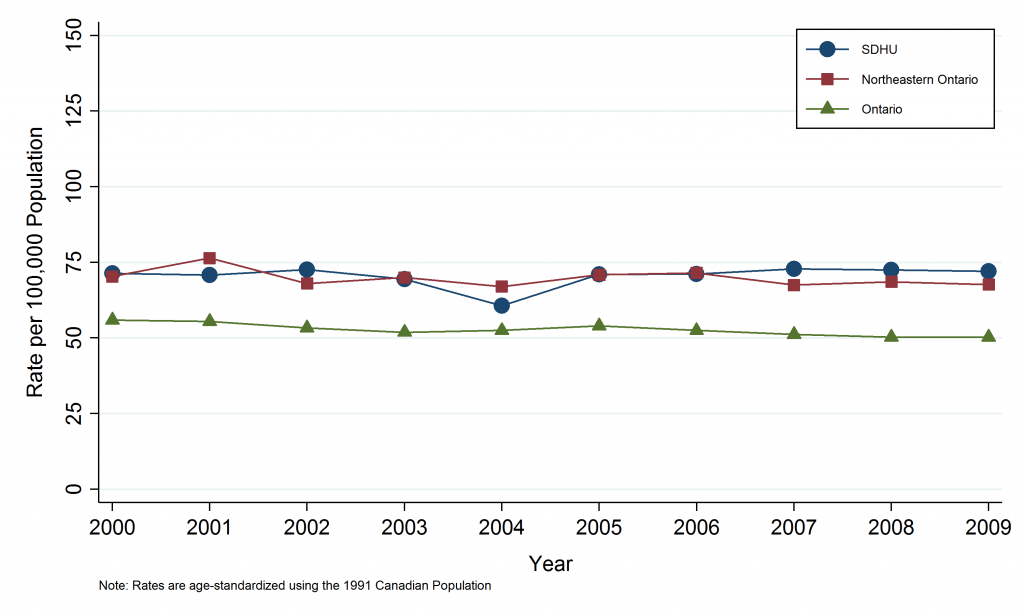
Table: Annual age-standardized incidence rate, lung cancer, by geographic area, 2000–2009
| Geographic Area | 2000 | 2001 | 2002 | 2003 | 2004 | 2005 | 2006 | 2007 | 2008 | 2009 |
| SDHU | 71.4 | 70.8 | 72.6 | 69.4 | 60.7 | 71 | 71.1 | 72.8 | 72.5 | 72 |
| Northeast Ontario | 70.3 | 76.4 | 68 | 70 | 67 | 70.9 | 71.5 | 67.5 | 68.6 | 67.7 |
| Ontario | 55.9 | 55.5 | 53.3 | 51.9 | 52.5 | 54 | 52.5 | 51.2 | 50.3 | 50.3 |
Table: Annual number of cases, lung cancer, by geographic area, 2000–2009
| Geographic Area | 2000 | 2001 | 2002 | 2003 | 2004 | 2005 | 2006 | 2007 | 2008 | 2009 |
| SDHU | 168 | 170 | 178 | 175 | 157 | 185 | 188 | 197 | 202 | 202 |
| Northeast Ontario | 504 | 555 | 506 | 534 | 522 | 566 | 583 | 557 | 583 | 583 |
| Ontario | 7189 | 7323 | 7211 | 7227 | 7493 | 7913 | 7886 | 7916 | 8002 | 8222 |
Lung cancer by Greater Sudbury and outlying areas
Key findings:
- In 2009, there were 162 new cases of lung cancer in Greater Sudbury and 40 cases in the SDHU district office areas.
- The rate of lung cancer was 72 cases per 100,000 among residents of Greater Sudbury and 72 cases per 100,000 among residents SDHU district office areas.
- Due to small numbers, rates in the SDHU district office areas should be interpreted with caution.
- The rate of lung cancer among residents of the Greater Sudbury has generally been slightly higher than the rate among residents of the SDHU district office areas.
- The rate of lung cancer in both Greater Sudbury and the SDHU district office areas were fairly consistent between 2000 and 2009, despite some fluctuations.
Notes:
- Rates are age-standardized using the 1991 Canadian population.
- Data Source: Ontario Cancer Registry and Population Estimates, Cancer Care Ontario, SEER*Stat, Oct. 2012 release.
Figure: Annual age-standardized incidence rate, lung cancer, Greater Sudbury vs. Sudbury & District Health Unit (SDHU) district office areas, 2000–2009
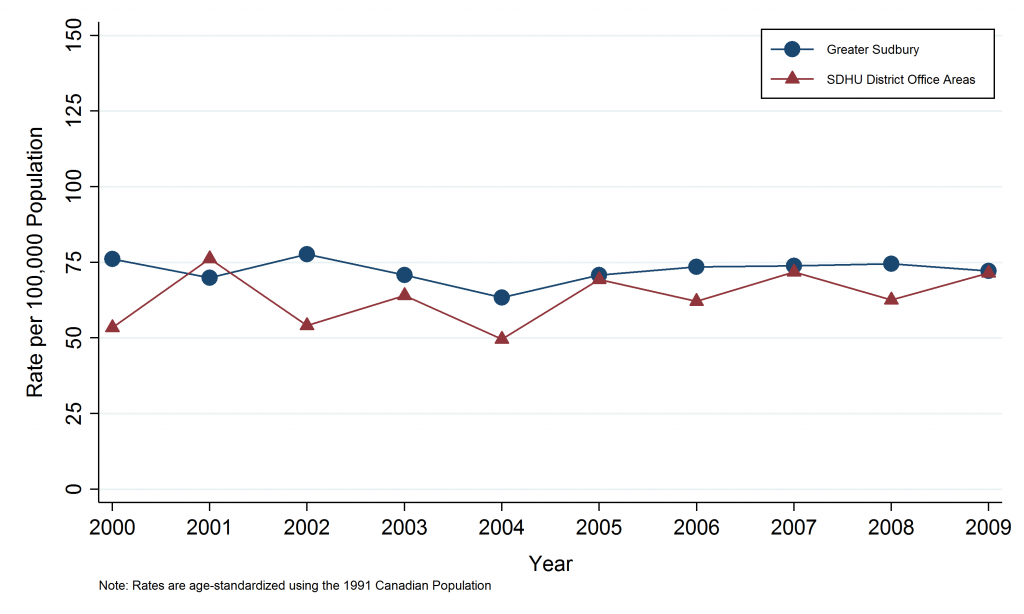
Table: Annual age-standardized incidence rate, lung cancer, Greater Sudbury vs. Sudbury & District Health Unit (SDHU) district office areas, 2000–2009
| Census Division | 2000 | 2001 | 2002 | 2003 | 2004 | 2005 | 2006 | 2007 | 2008 | 2009 |
| SDHU District Office Areas | 53.4 | 76.2 | 54.1 | 64 | 49.6 | 69.3 | 62.1 | 71.8 | 62.6 | 71.5 |
| Manitoulin District | 58.4 | 56.1 | 44.7 | 53 | 50.7 | 66.3 | 49.4 | 62.9 | 55.4 | 59.1 |
| Sudbury District | 53.5 | 92.4 | 59.2 | 70.6 | 48.7 | 72.3 | 70.1 | 78 | 68.1 | 80.3 |
| City of Greater Sudbury | 76.1 | 69.9 | 77.7 | 70.8 | 63.4 | 70.8 | 73.5 | 73.8 | 74.5 | 72.1 |
Table: Annual number of cases, lung cancer, Greater Sudbury vs. Sudbury & District Health Unit (SDHU) district office areas, 2000–2009
| Census Division | 2000 | 2001 | 2002 | 2003 | 2004 | 2005 | 2006 | 2007 | 2008 | 2009 |
| SDHU District Office Areas | 25 | 36 | 26 | 31 | 25 | 36 | 33 | 39 | 35 | 40 |
| Manitoulin District | 10 | 10 | 8 | 10 | 10 | 13 | 11 | 13 | 12 | 13 |
| Sudbury District | 15 | 26 | 18 | 21 | 15 | 23 | 22 | 26 | 23 | 27 |
| City of Greater Sudbury | 143 | 134 | 152 | 144 | 132 | 149 | 155 | 158 | 167 | 162 |
Lung cancer by sex
Key findings:
- In 2009, there were 112 males and 90 females diagnosed with lung cancer in the SDHU area.
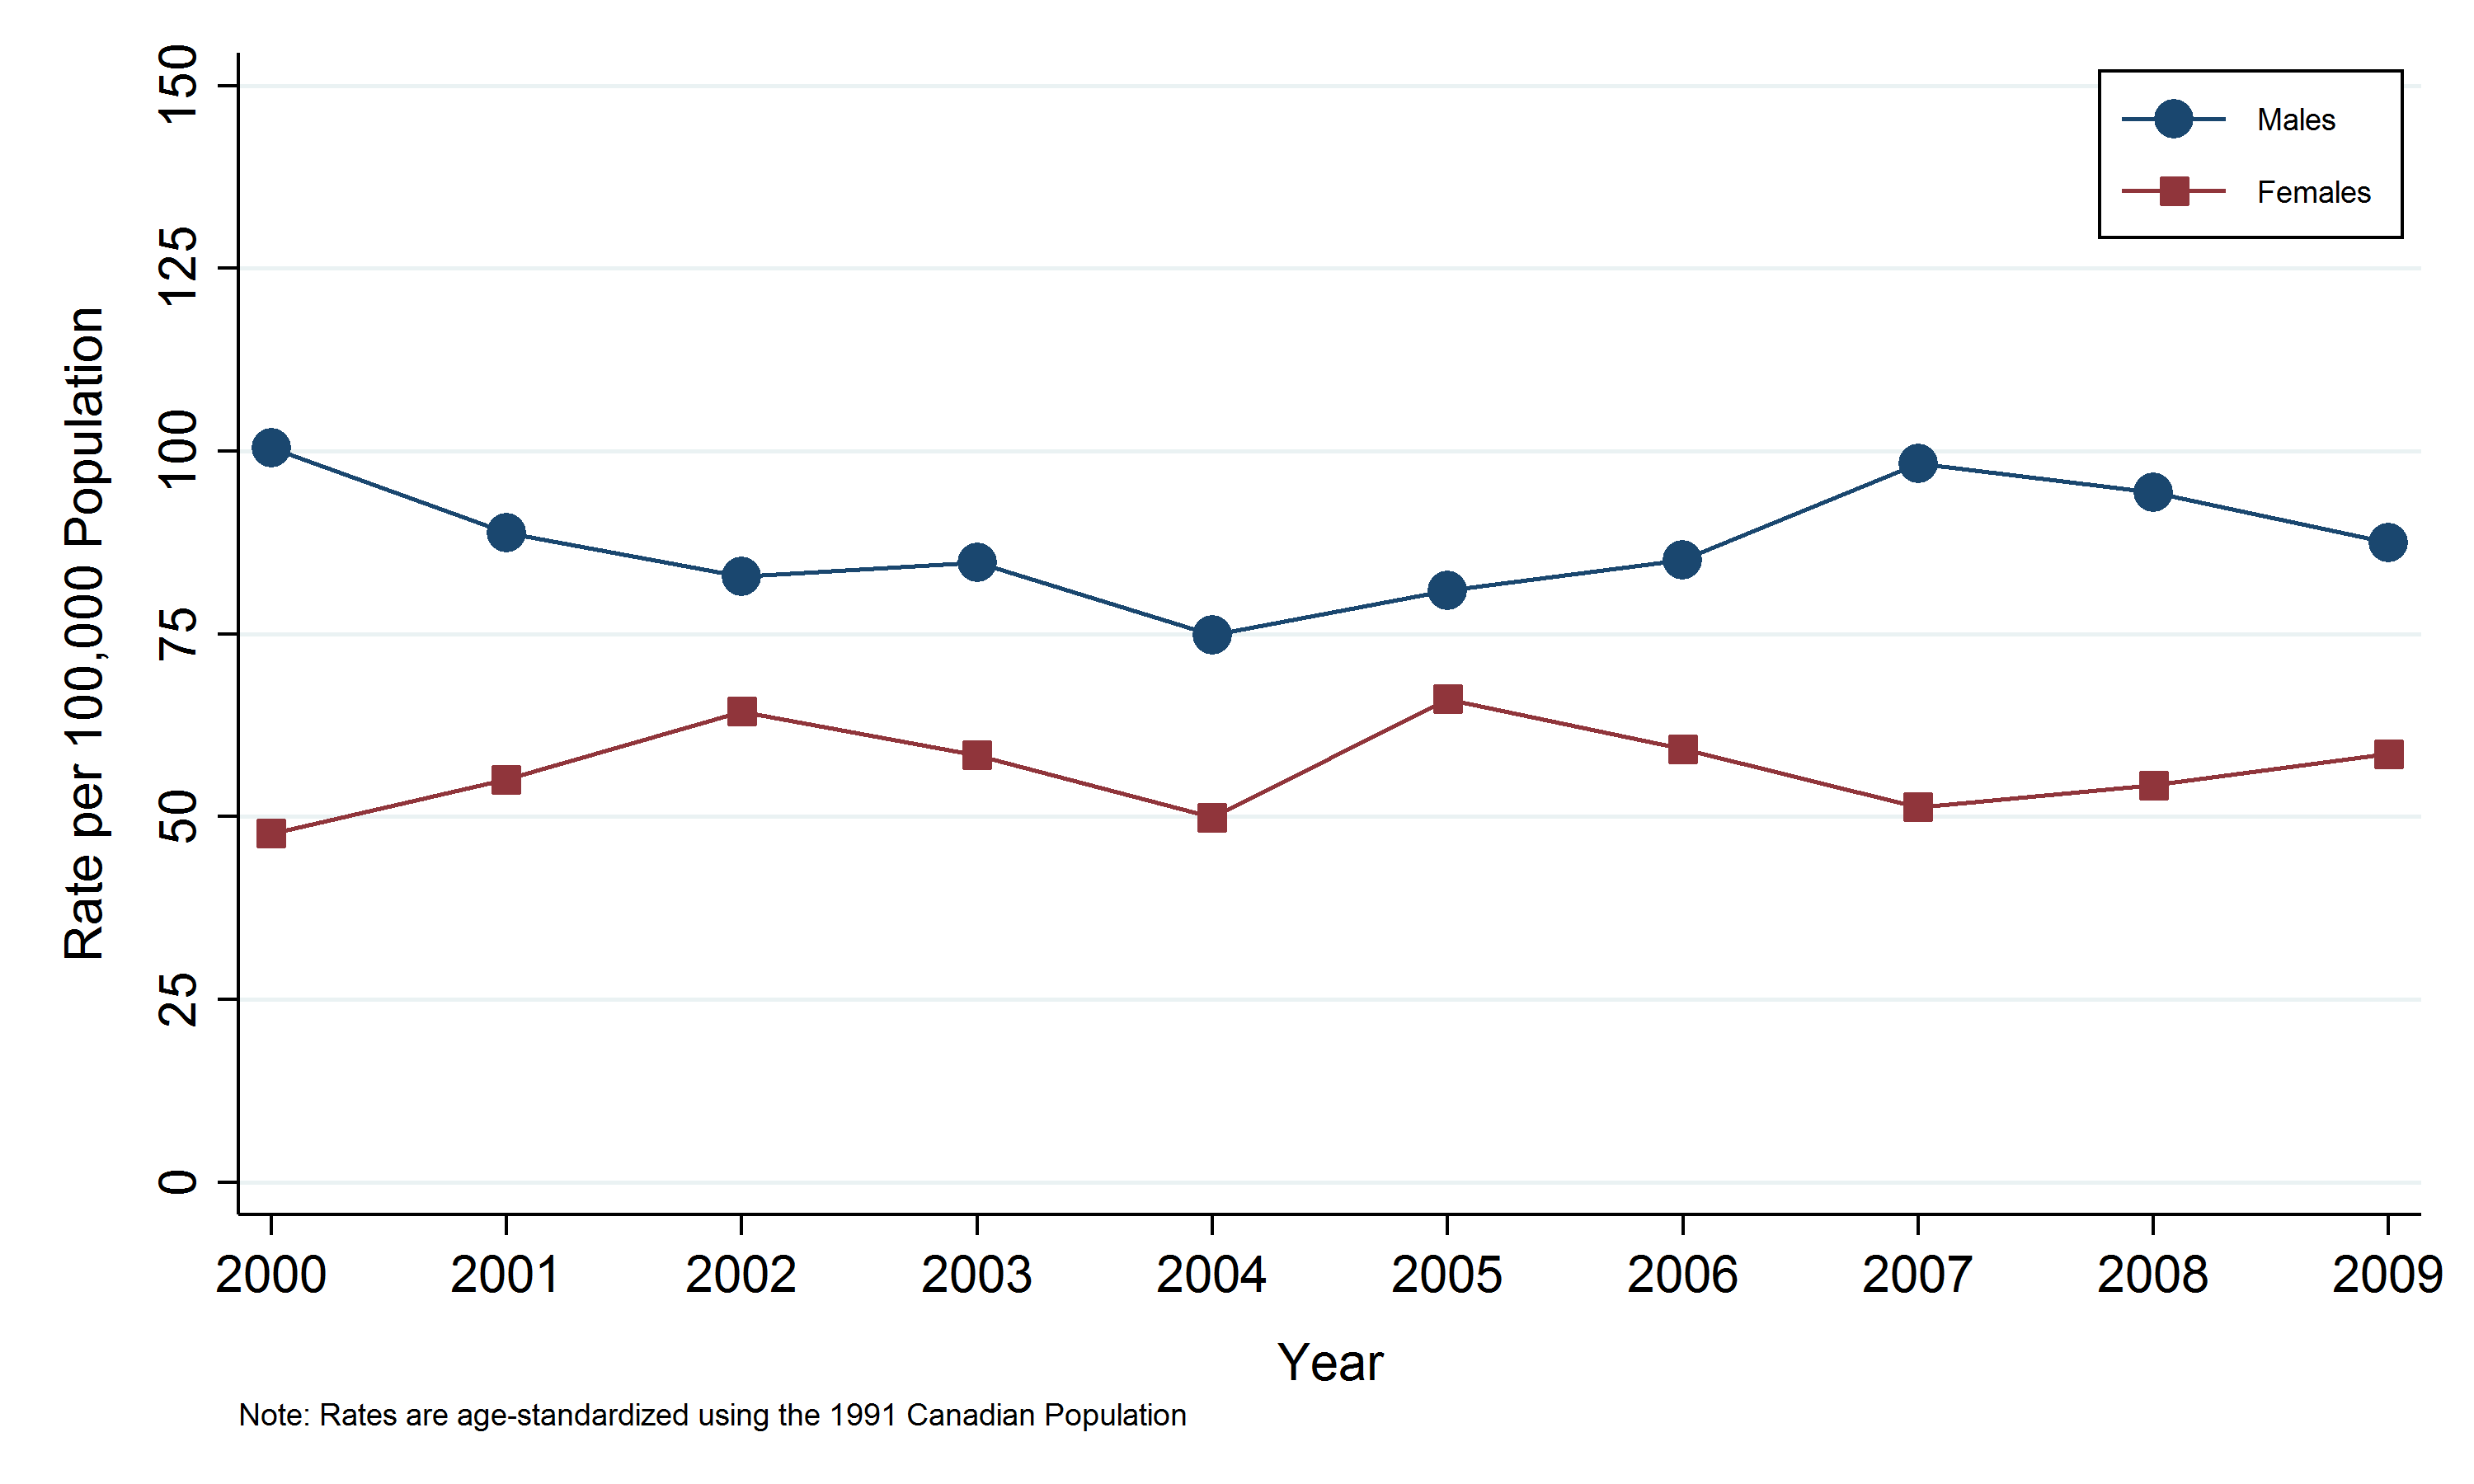
- In the SDHU area, the rate of lung cancer was 88 new cases per 100,000 males and 59 new cases per 100,000 females in 2009.
- The rate of lung cancer among males in the SDHU area has been consistently higher than the rate among females.
- Between 2000 and 2009, there has been no clear trend in lung cancer rates in either males or females.
Notes:
- Rates are age-standardized using the 1991 Canadian population.
- Data Source: Ontario Cancer Registry and Population Estimates, Cancer Care Ontario, SEER*Stat, Oct. 2012 release.
Figure: Annual age-standardized incidence rate, lung cancer, by sex, Sudbury & District Health Unit (SDHU) area, 2000–2009
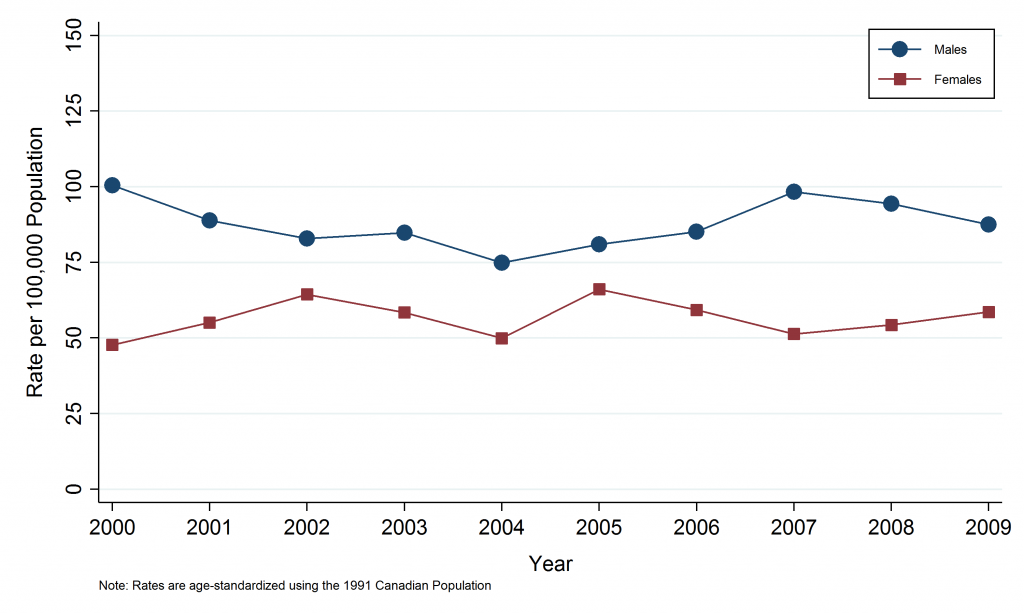
Table: Annual age-standardized incidence rate, lung cancer, by sex, Sudbury & District Health Unit (SDHU) area, 2000–2009
| Sex | 2000 | 2001 | 2002 | 2003 | 2004 | 2005 | 2006 | 2007 | 2008 | 2009 |
| Both | 71.4 | 70.8 | 72.6 | 69.4 | 60.7 | 71 | 71.1 | 72.8 | 72.5 | 72 |
| Males | 100.5 | 88.8 | 82.9 | 84.8 | 74.9 | 81 | 85.1 | 98.3 | 94.4 | 87.5 |
| Females | 47.7 | 55.1 | 64.4 | 58.4 | 49.9 | 66.1 | 59.3 | 51.3 | 54.3 | 58.6 |
Table: Annual number of cases, lung cancer, by sex, Sudbury & District Health Unit (SDHU) area, 2000–2009
| Sex | 2000 | 2001 | 2002 | 2003 | 2004 | 2005 | 2006 | 2007 | 2008 | 2009 |
| Both | 168 | 170 | 178 | 175 | 157 | 185 | 188 | 197 | 202 | 202 |
| Males | 108 | 99 | 93 | 96 | 88 | 91 | 103 | 122 | 121 | 112 |
| Females | 60 | 71 | 85 | 79 | 69 | 94 | 85 | 75 | 81 | 90 |
Lung cancer by age group
Key findings:
- In 2009, the highest number of new lung cancer cases was in the 65 to 74 age group, with 78 cases in the SDHU area. There were fewer than 6 new cases per year among people aged 0–44 years. Therefore, the results cannot be reported for this age group.
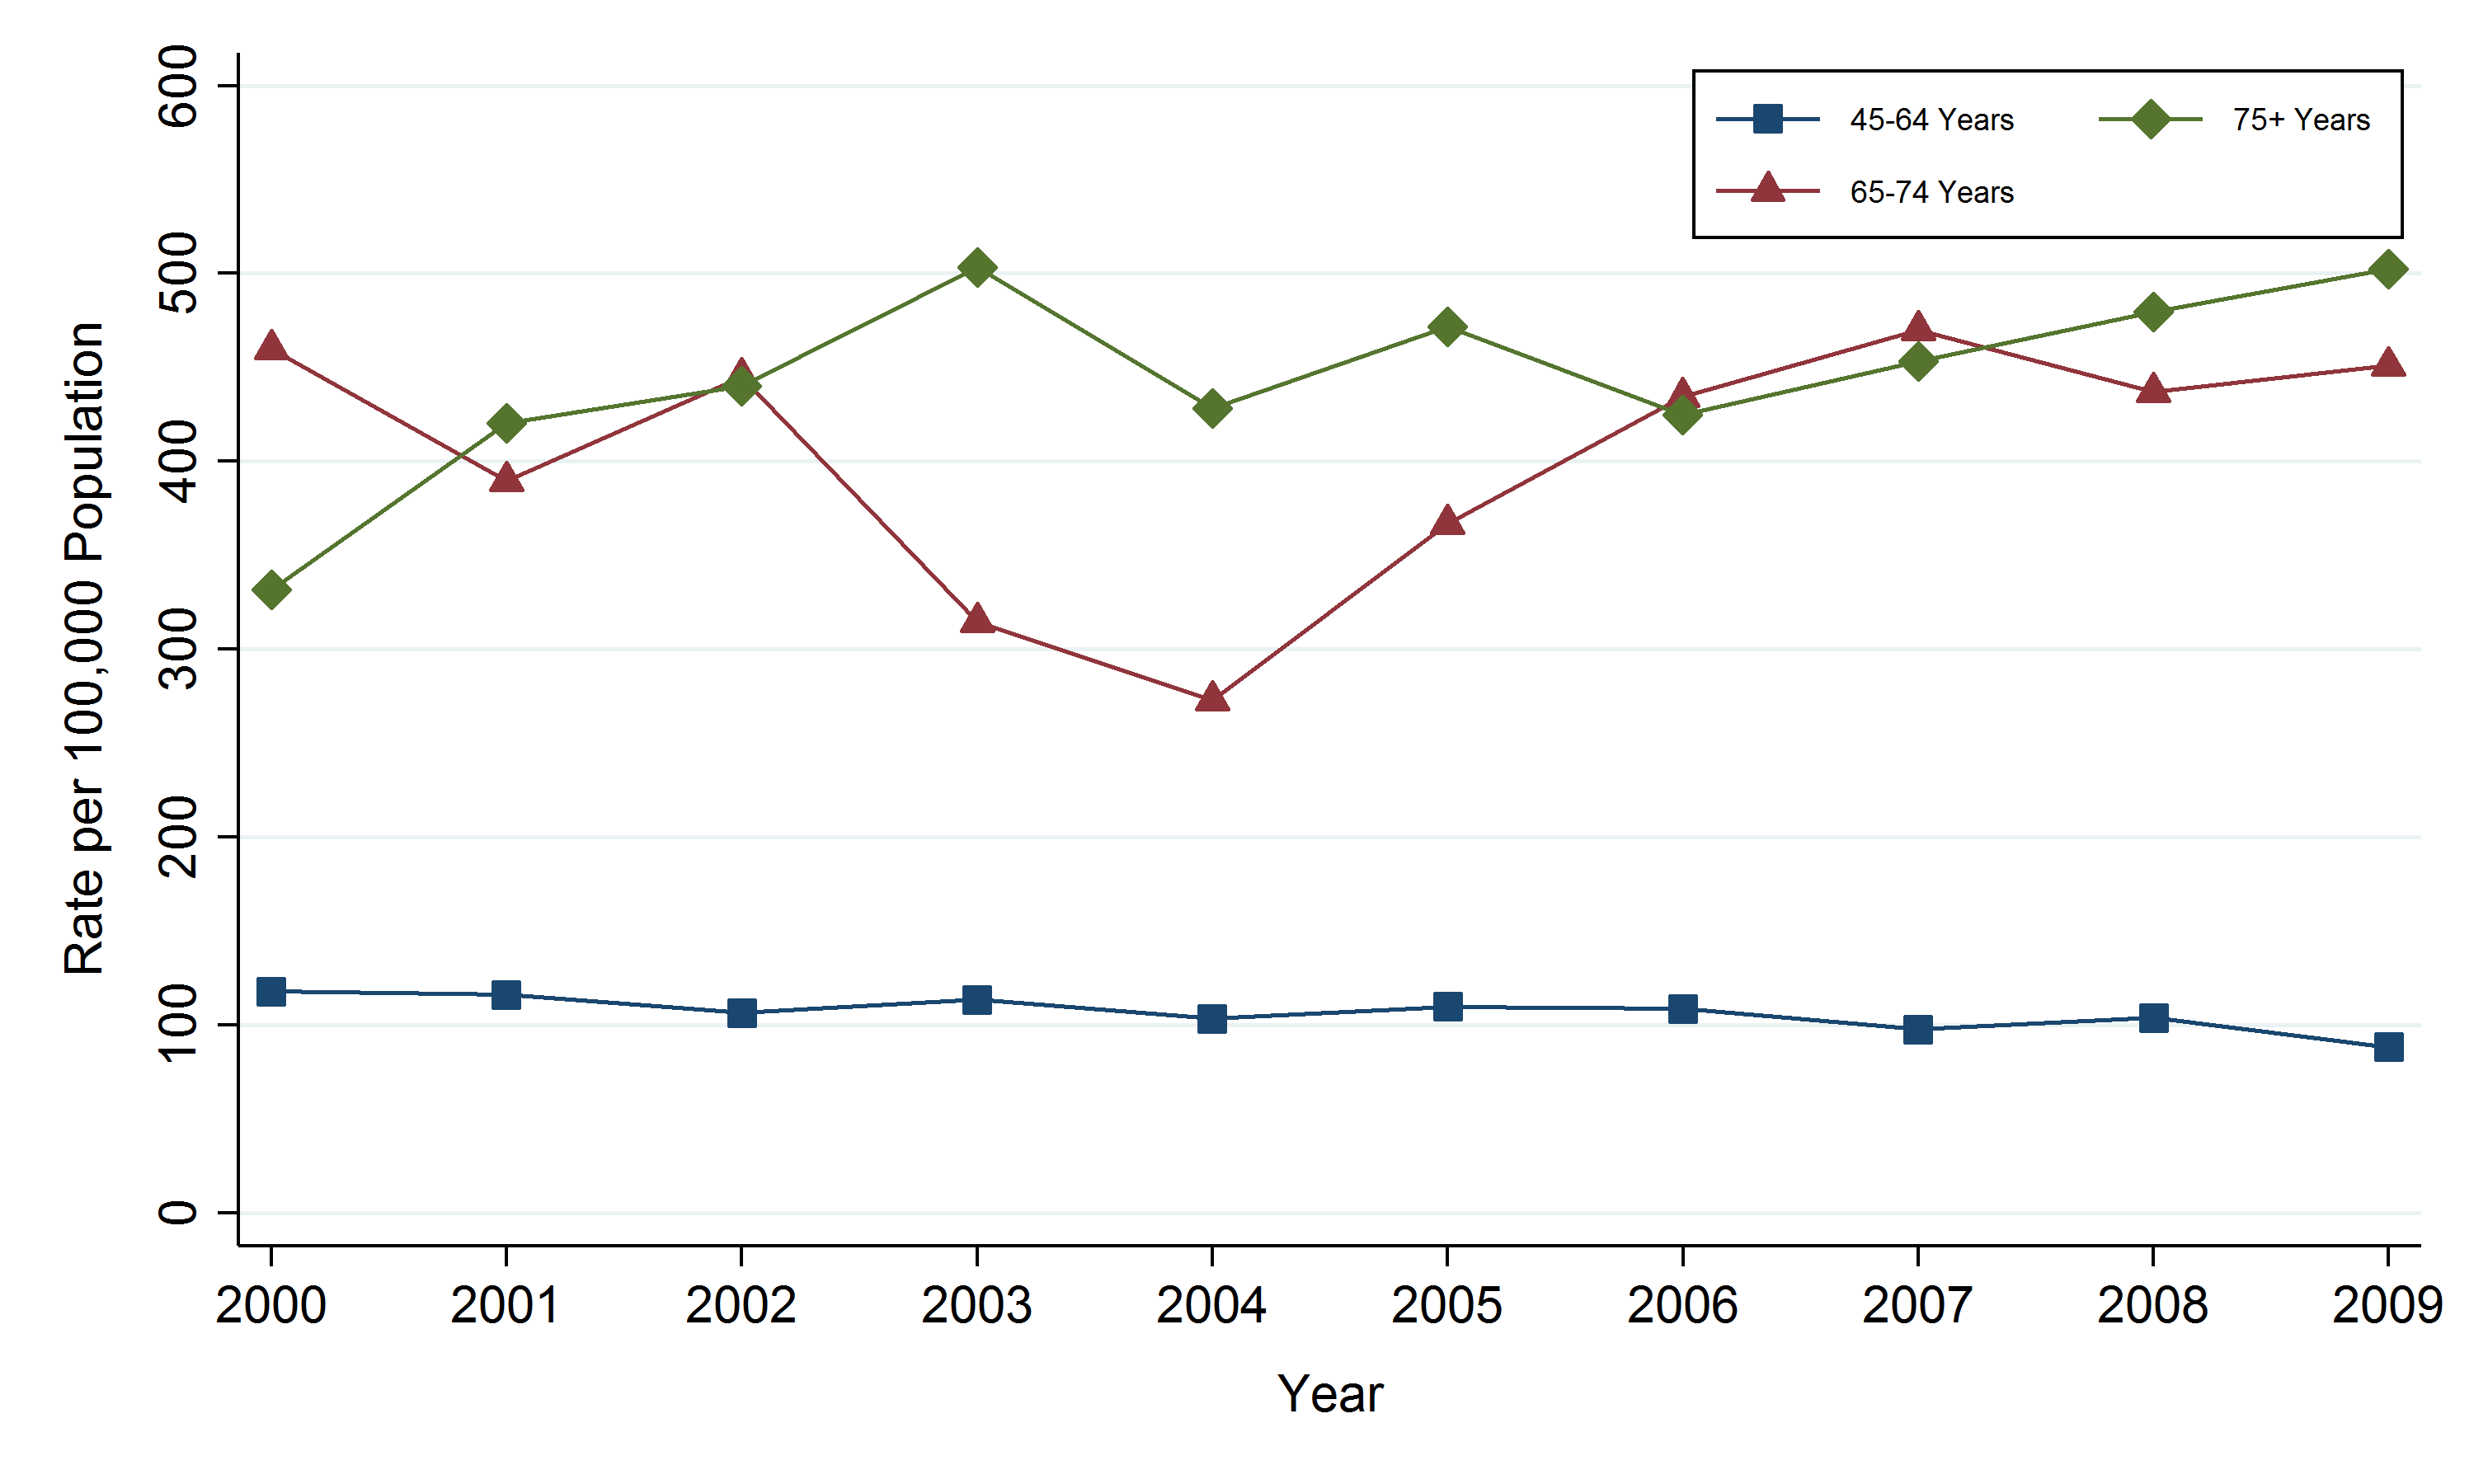
- The highest rate of lung cancer in the SDHU area was in the 75 and over age group, with 502 cases per 100,000 population in 2009.
- The rate of lung cancer increases with age, though there has often been little difference between the 65 to 74 and 75 and over age groups.
- From 2000 to 2009, the lung cancer rate increased in the 75 and over age groups. Though the rate in the 65–74 year age group fluctuated significantly over the period, the rate in 2009 is about the same as it was in 2000.
Notes:
- Data Source: Ontario Cancer Registry and Population Estimates, Cancer Care Ontario, SEER*Stat, Oct. 2012 release.
Figure: Annual incidence rate, lung cancer, by age group, Sudbury & District Health Unit (SDHU) area, 2000–2009
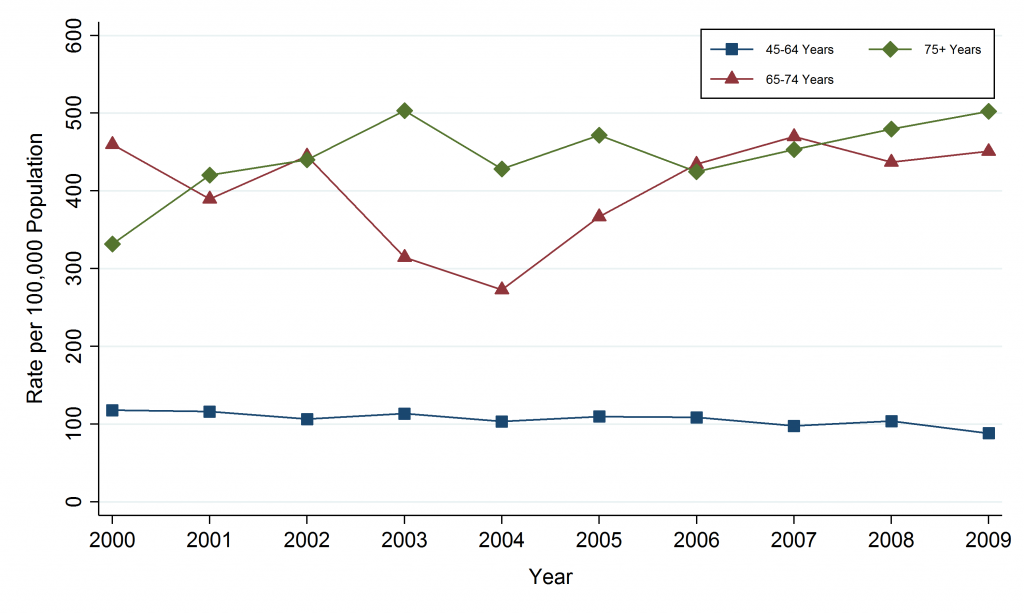
Table: Annual incidence rate, lung cancer, by age group, Sudbury & District Health Unit (SDHU) area, 2000–2009
| Age at Diagnosis | 2000 | 2001 | 2002 | 2003 | 2004 | 2005 | 2006 | 2007 | 2008 | 2009 |
| 45-64 | 118.1 | 116.4 | 106.7 | 113.6 | 103.6 | 110 | 108.8 | 97.9 | 104 | 88.4 |
| 65-74 | 460 | 389.6 | 445 | 314.7 | 273 | 366.9 | 434.3 | 470 | 437.1 | 450.9 |
| 75+ | 332 | 420.6 | 440 | 503.3 | 428.1 | 471.7 | 424.6 | 453.3 | 479.5 | 502.3 |
Table: Annual number of cases, lung cancer, by age group, Sudbury & District Health Unit (SDHU) area, 2000–2009
| Age at Diagnosis | 2000 | 2001 | 2002 | 2003 | 2004 | 2005 | 2006 | 2007 | 2008 | 2009 |
| 45-64 | 56 | 56 | 53 | 59 | 55 | 61 | 60 | 56 | 61 | 53 |
| 65-74 | 73 | 62 | 71 | 50 | 44 | 59 | 71 | 78 | 74 | 78 |
| 75+ | 35 | 47 | 51 | 60 | 53 | 59 | 55 | 61 | 66 | 69 |
Lung cancer deaths by geographic area
Key findings:
- In 2009, there were 160 deaths due to lung cancer in the SDHU area.
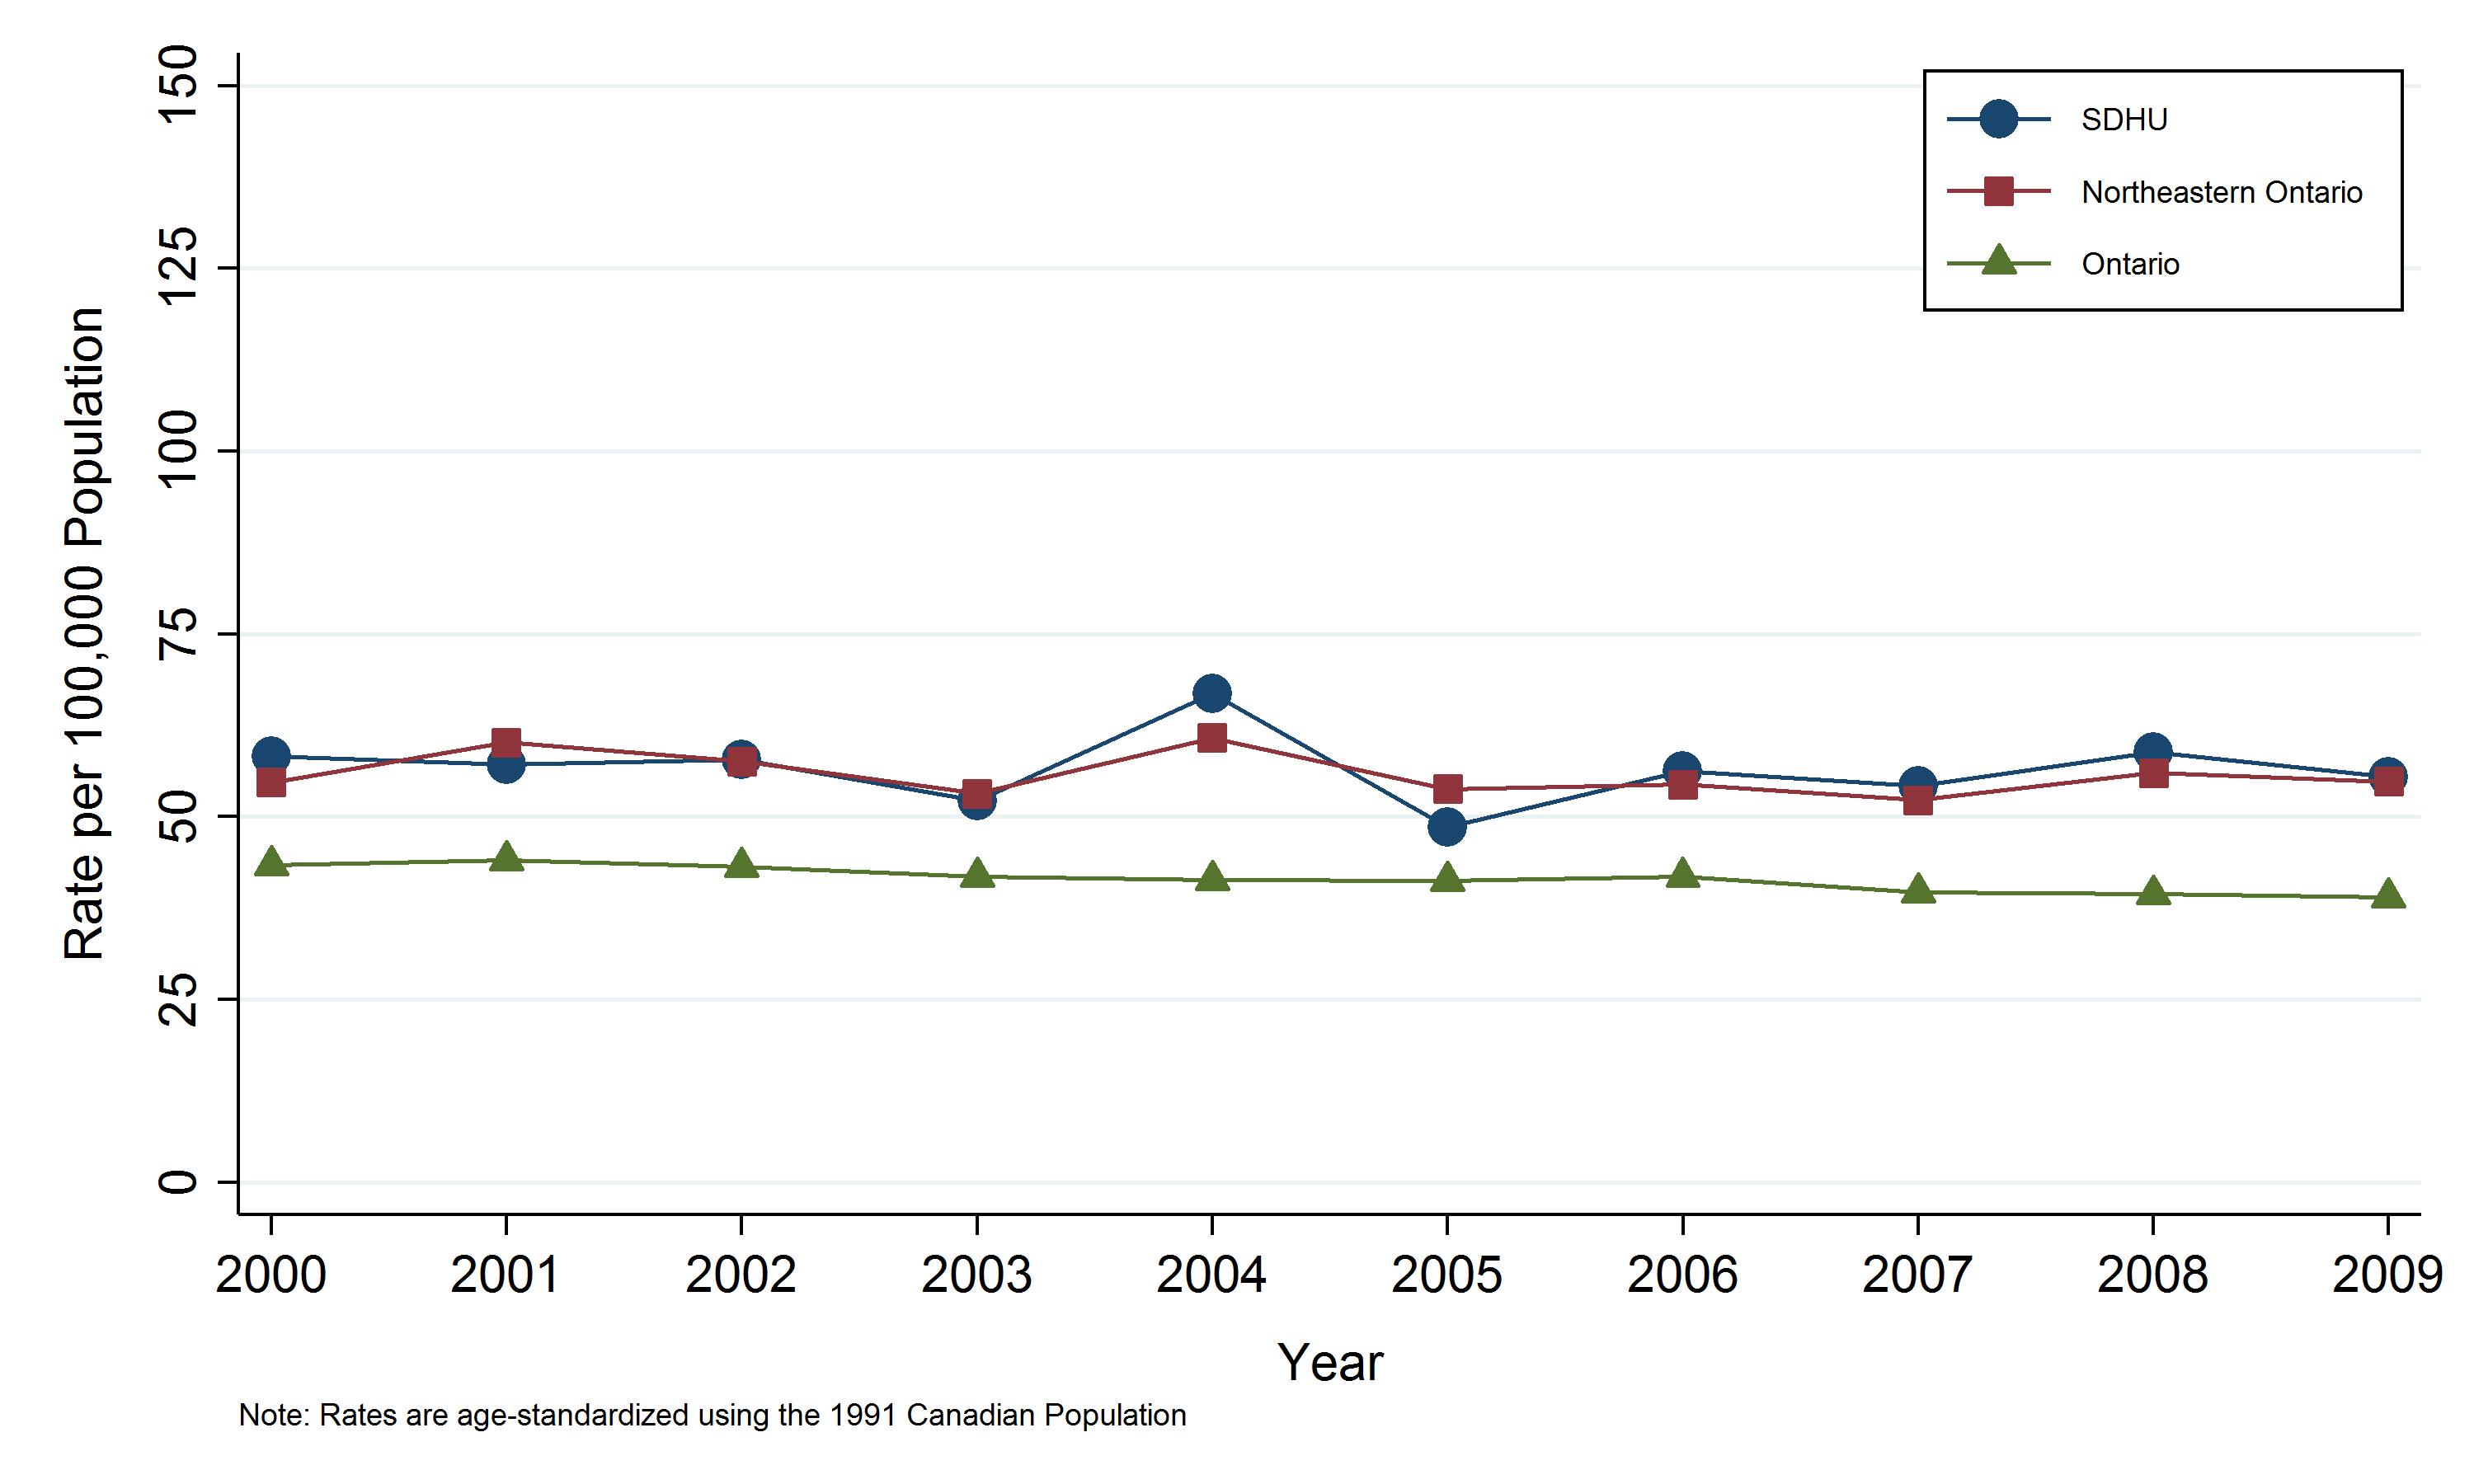
- In the SDHU area, the lung cancer mortality rate in 2009 was 56 deaths per 100,000 population.
- The rate of lung cancer mortality in the SDHU area has been generally similar to that of northeastern Ontario, while the rates in both the SDHU area and northeastern Ontario are consistently higher than the rate in Ontario.
- Between 2000 and 2009, the rate of lung cancer mortality in the SDHU was fairly stable.
Notes:
- Rates are age-standardized using the 1991 Canadian population.
- Data Source: Ontario Cancer Registry and Population Estimates, Cancer Care Ontario, SEER*Stat, Oct. 2012 release.
Figure: Annual age-standardized mortality rate, lung cancer, by geographic area, 2000–2009
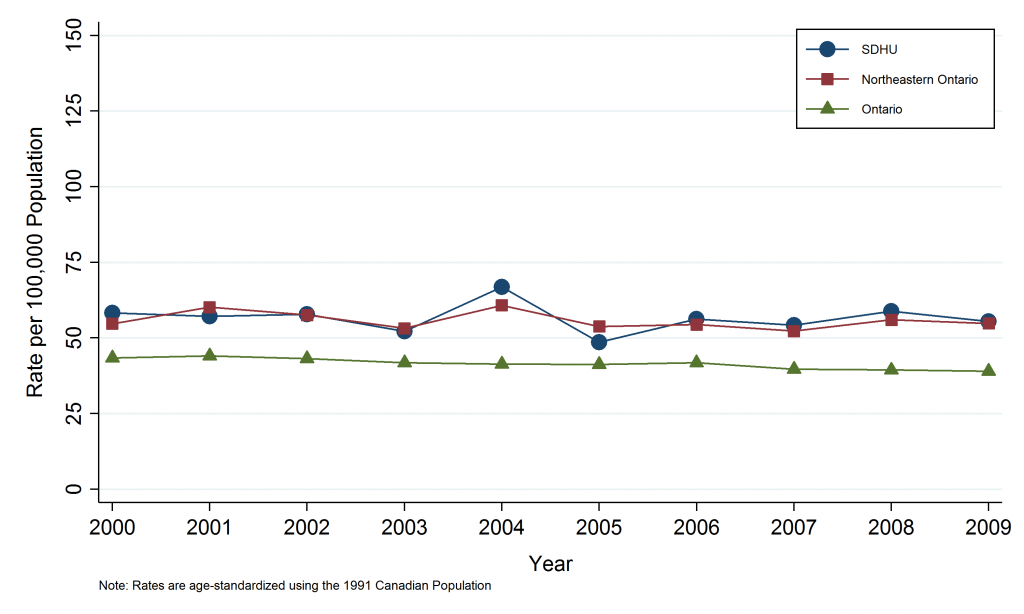
Table: Annual age-standardized mortality rate, lung cancer, by geographic area, 2000–2009
| Geographic Area | 2000 | 2001 | 2002 | 2003 | 2004 | 2005 | 2006 | 2007 | 2008 | 2009 |
| SDHU | 58.3 | 57.1 | 57.8 | 52.2 | 66.9 | 48.6 | 56.3 | 54.2 | 58.8 | 55.5 |
| Northeast Ontario | 54.7 | 60.2 | 57.6 | 53.2 | 60.8 | 53.8 | 54.4 | 52.3 | 56 | 54.8 |
| Ontario | 43.4 | 44.1 | 43.2 | 41.8 | 41.4 | 41.3 | 41.8 | 39.7 | 39.4 | 39 |
Table: Annual number of mortality cases, lung cancer, by geographic area, 2000–2009
| Geographic Area | 2000 | 2001 | 2002 | 2003 | 2004 | 2005 | 2006 | 2007 | 2008 | 2009 |
| SDHU | 137 | 135 | 141 | 130 | 171 | 129 | 149 | 148 | 164 | 160 |
| Northeast Ontario | 393 | 438 | 428 | 407 | 475 | 434 | 447 | 438 | 475 | 480 |
| Ontario | 5621 | 5846 | 5883 | 5855 | 5959 | 6098 | 6370 | 6220 | 6360 | 6462 |
This item was last modified on March 26, 2018