Breast cancer
Breast cancer is defined as abnormal cell growth, most often in the ducts or lobules of breast tissue. Most commonly found in women, it can develop in the breast tissue of men. One in nine women in Canada are expected to develop breast cancer in their lifetime.
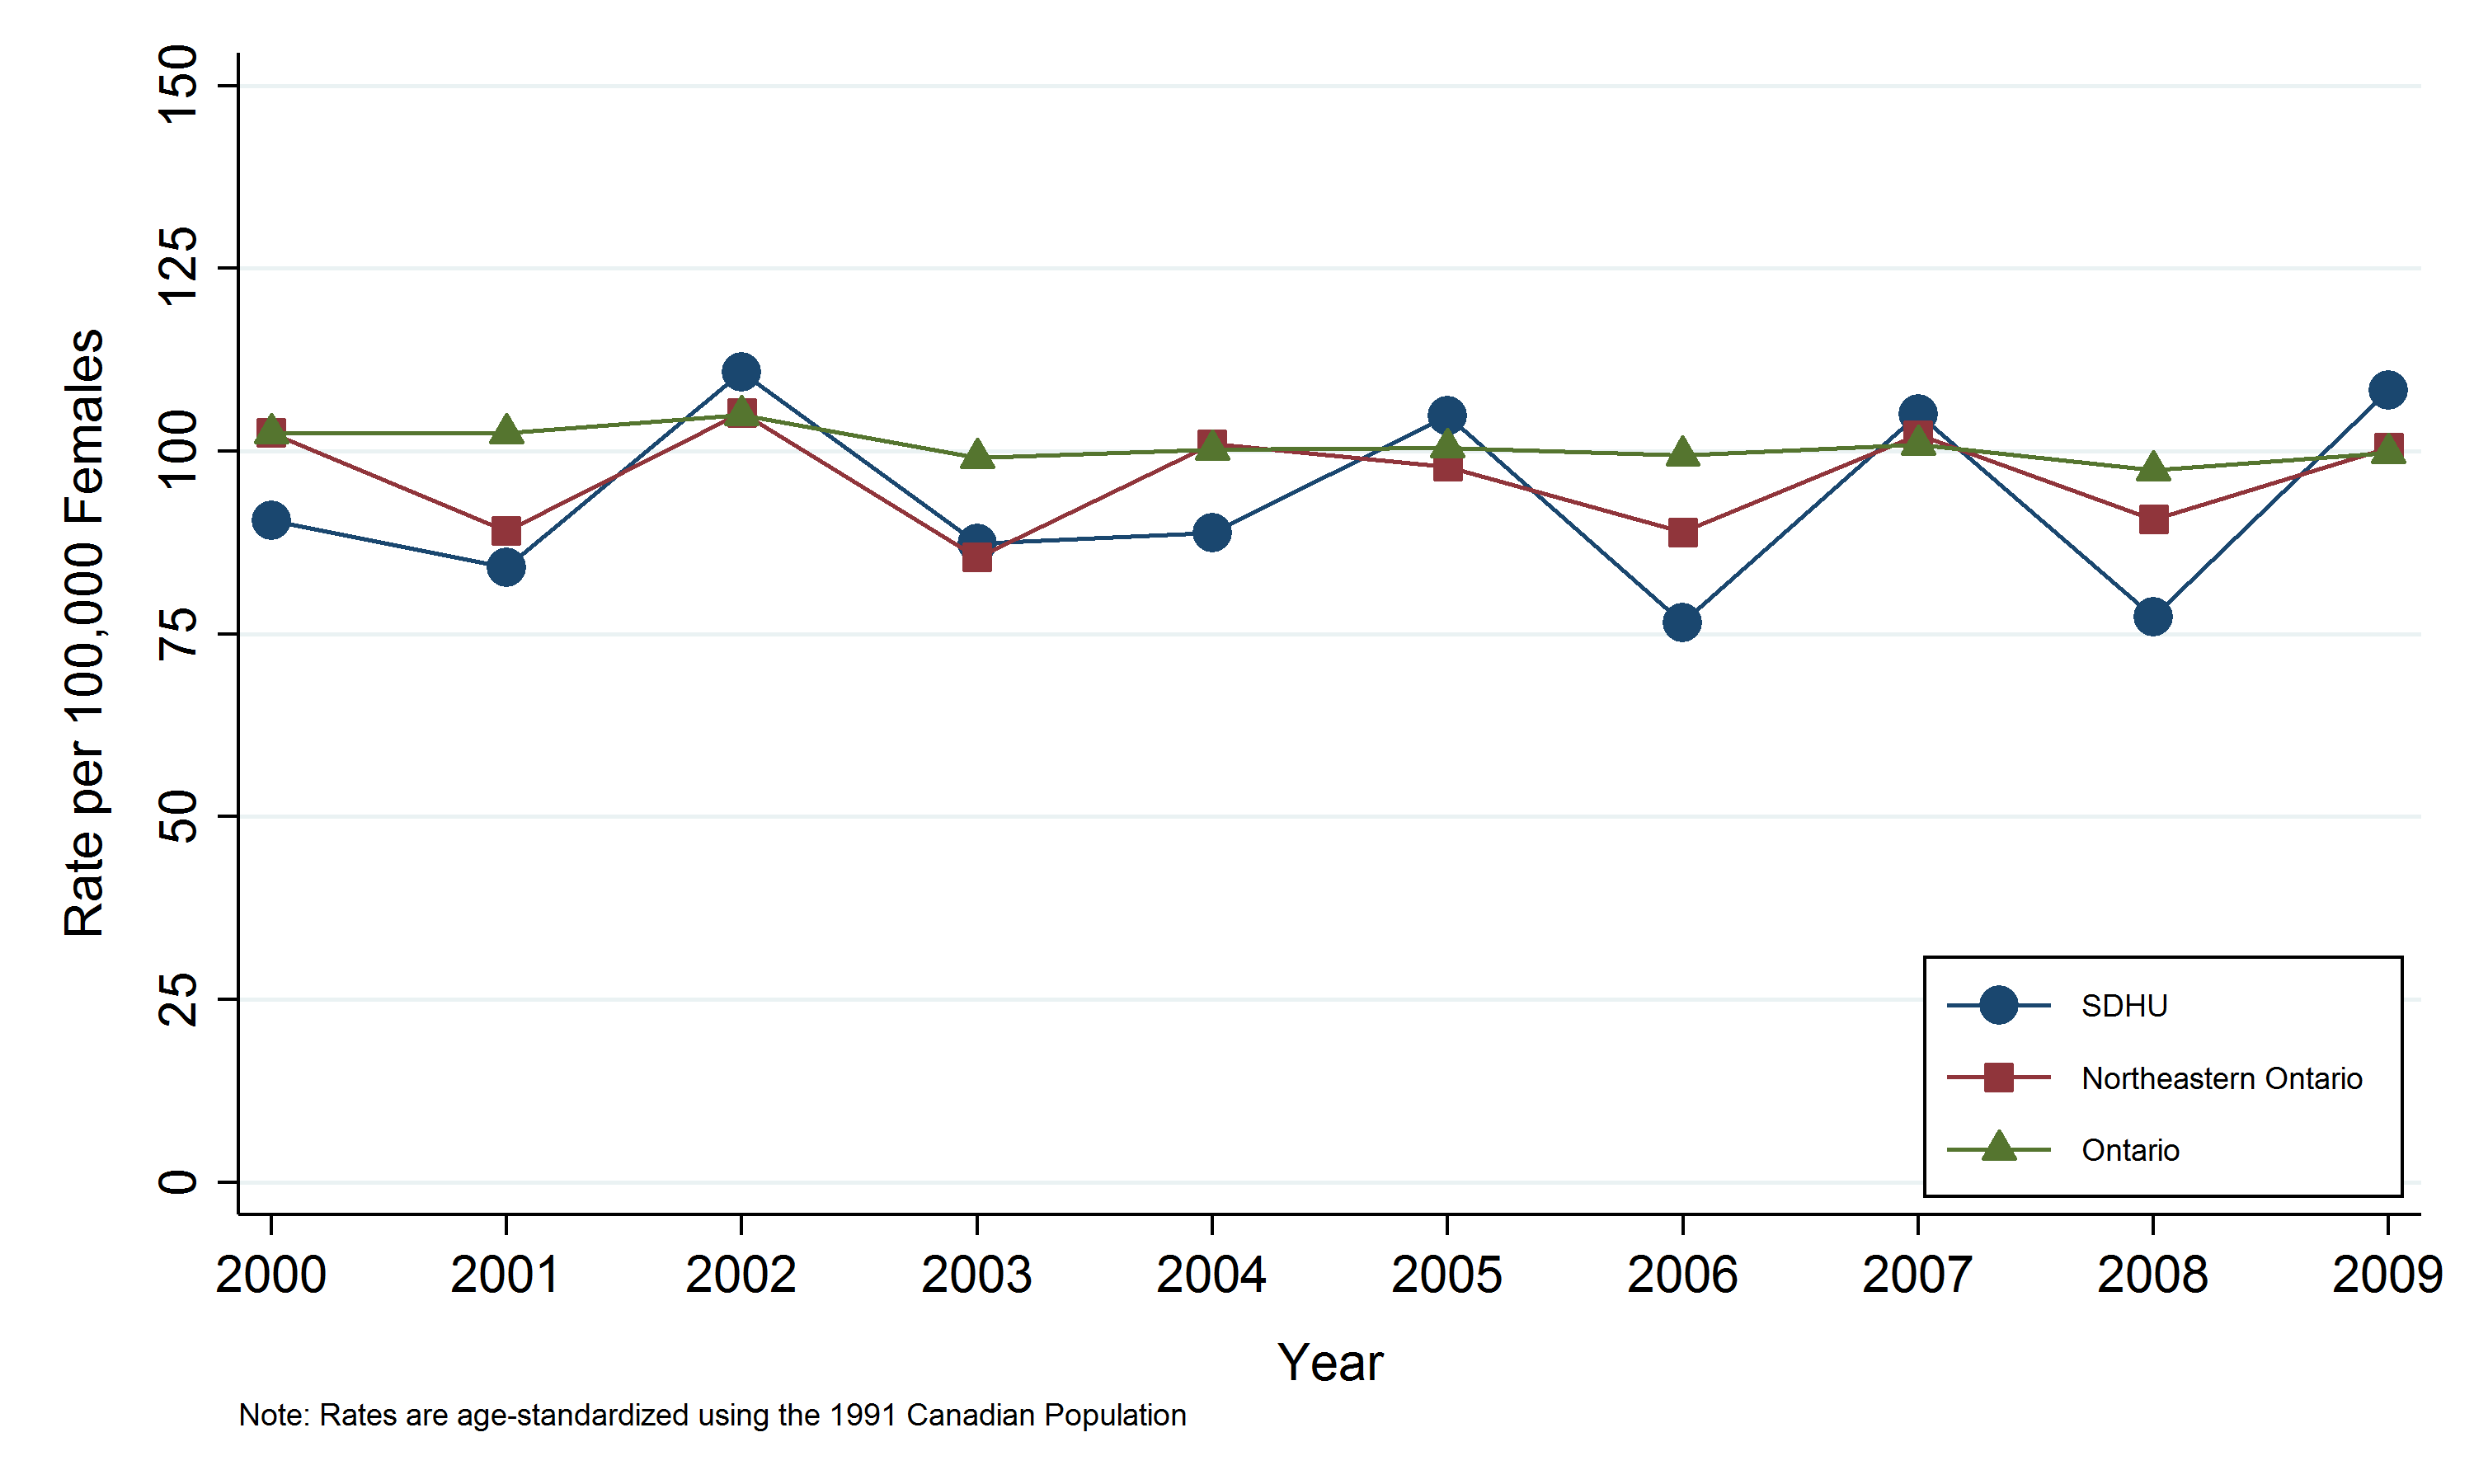
Breast cancer by geographic area
Key findings:
- In the Sudbury & District Health Unit (SDHU) area, there were 154 cases of breast cancer in females in 2009.
- In 2009, the rate of female breast cancer in the SDHU area was 108 cases per 100,000 females.
- The annual breast cancer rate in SDHU area and northeastern Ontario females have been similar and are generally lower than the breast cancer rate in Ontario females.
- There was no clear trend in breast cancer rates in SDHU area females between the years of 2000 and 2009.
Notes:
- Rates are age-standardized using the 1991 Canadian population.
- Data Source: Ontario Cancer Registry and Population Estimates, Cancer Care Ontario, SEER*Stat, Oct. 2012 release.
Figure: Annual age-standardized incidence rate, breast cancer, females, by geographic area, 2000–2009
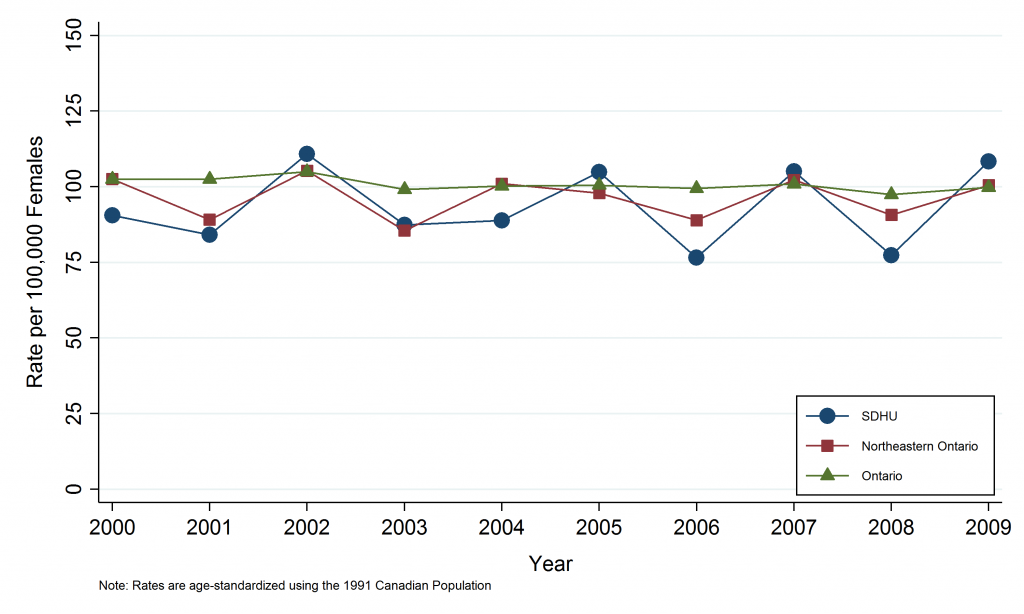
Table: Annual age-standardized incidence rate, breast cancer, females, by geographic area, 2000–2009
| Geographic Area | 2000 | 2001 | 2002 | 2003 | 2004 | 2005 | 2006 | 2007 | 2008 | 2009 |
| SDHU | 90.5 | 84.1 | 110.8 | 87.4 | 88.8 | 104.8 | 76.6 | 105.1 | 77.3 | 108.3 |
| Northeast Ontario | 102.5 | 89.1 | 105.3 | 85.5 | 101.0 | 97.9 | 88.9 | 102.2 | 90.7 | 100.5 |
| Ontario | 102.5 | 102.5 | 105.0 | 99.1 | 100.2 | 100.5 | 99.4 | 100.9 | 97.4 | 99.8 |
Table: Annual number of cases, breast cancer, females, by geographic area, 2000–2009
| Geographic Area | 2000 | 2001 | 2002 | 2003 | 2004 | 2005 | 2006 | 2007 | 2008 | 2009 |
| SDHU | 111 | 106 | 144 | 116 | 119 | 145 | 106 | 146 | 112 | 154 |
| Northeast Ontario | 377 | 335 | 407 | 337 | 398 | 400 | 364 | 424 | 383 | 424 |
| Ontario | 7097 | 7260 | 7625 | 7377 | 7676 | 7831 | 7955 | 8228 | 8136 | 8495 |
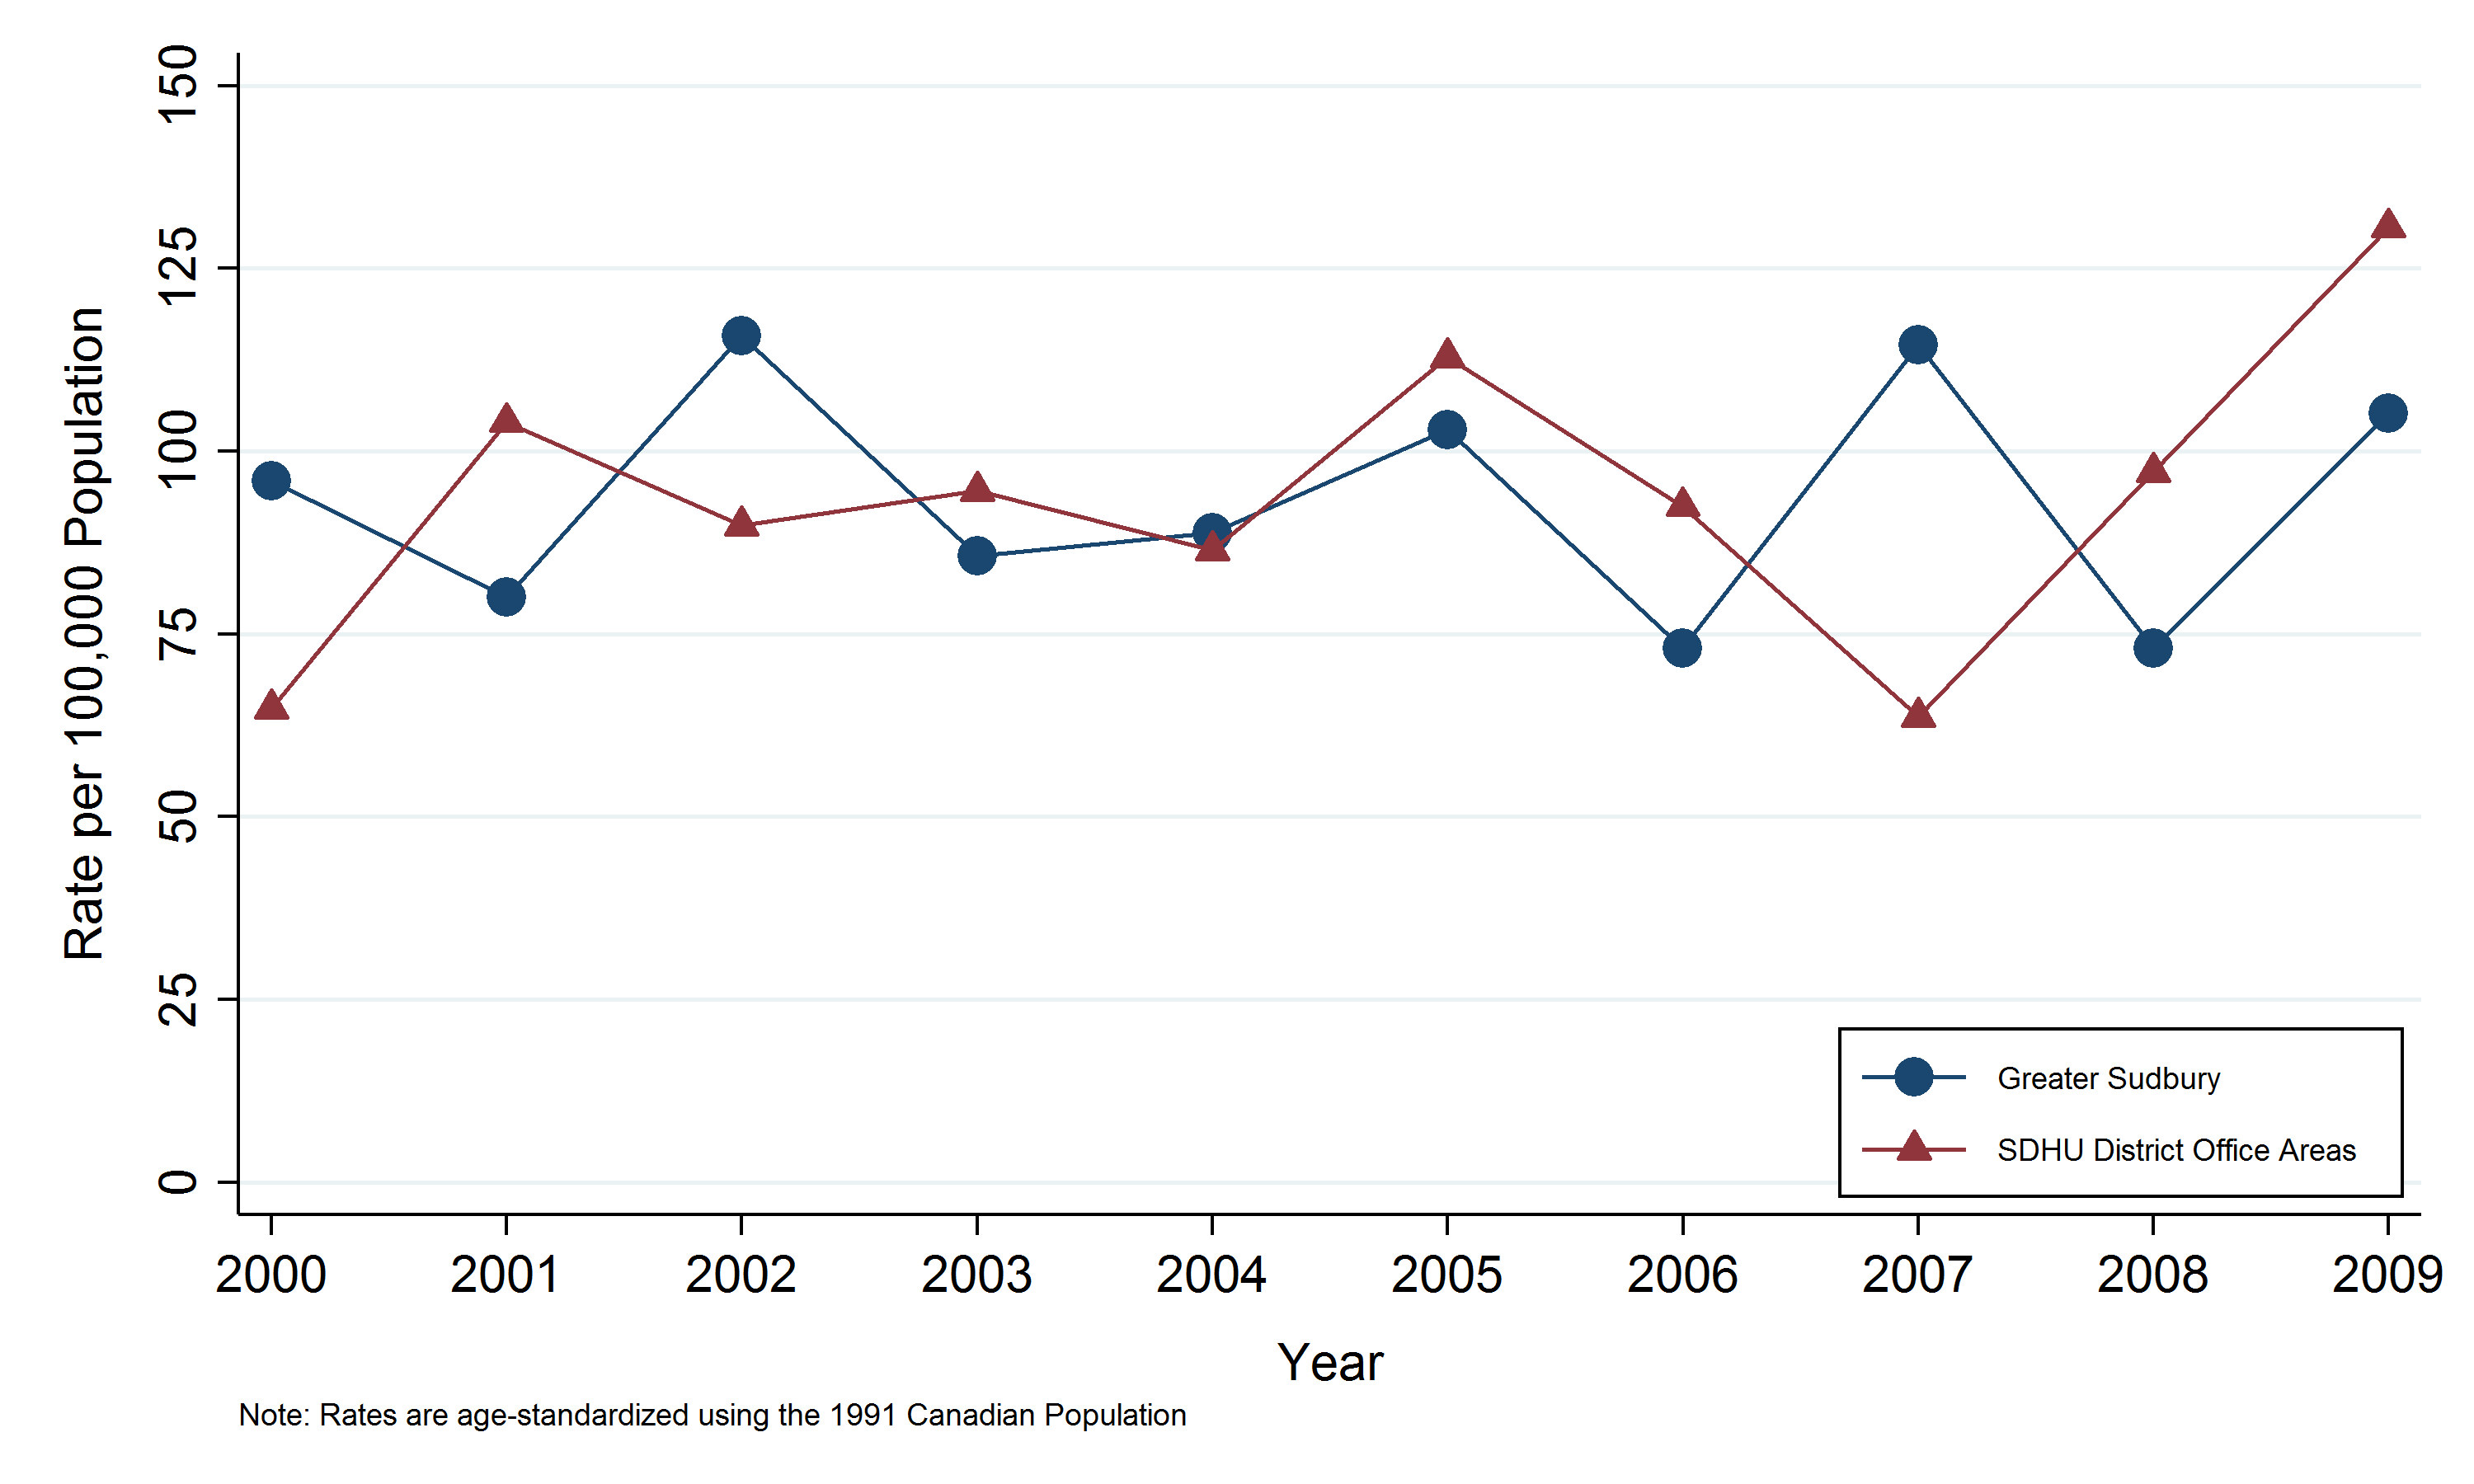
Breast cancer by Greater Sudbury and outlying areas
Key findings:
- In 2009, there were 125 cases of breast cancer among female residents of Greater Sudbury and 29 cases among female residents of the SDHU district office areas.
- The rate of female breast cancer among residents of Greater Sudbury was 105 cases per 100,000 females, and the rate among residents of the SDHU district office areas was 131 cases per 100,000 females.
- The rates of breast cancer among female residents of Greater Sudbury and the SDHU district office areas have fluctuated between 2000 and 2009 without a clear trend.
Notes:
- Rates are age-standardized using the 1991 Canadian population.
- Data Source: Ontario Cancer Registry and Population Estimates, Cancer Care Ontario, SEER*Stat, Oct. 2012 release.
Figure: Annual age-standardized incidence rate, breast cancer, females, Greater Sudbury vs. Sudbury & District Health Unit (SDHU) district office areas, 2000–2009
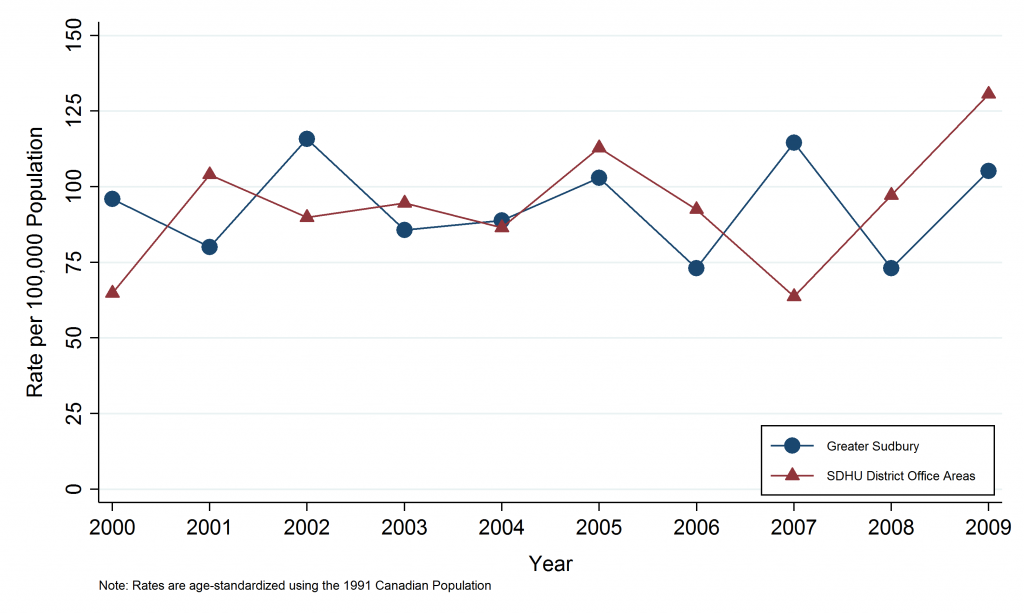
Table: Annual age-standardized incidence rate, breast cancer, females, Greater Sudbury vs. Sudbury & District Health Unit (SDHU) district office areas, 2000–2009
| Census Division | 2000 | 2001 | 2002 | 2003 | 2004 | 2005 | 2006 | 2007 | 2008 | 2009 |
| SDHU District Office Areas | 64.8 | 104.0 | 89.9 | 94.6 | 86.5 | 112.9 | 92.5 | 63.7 | 97.2 | 130.6 |
| City of Greater Sudbury | 95.9 | 80.1 | 115.8 | 85.7 | 88.8 | 102.9 | 73.1 | 114.5 | 73.1 | 105.2 |
Table: Annual number of cases, breast cancer, females, Greater Sudbury vs. Sudbury & District Health Unit (SDHU) district office areas, 2000–2009
| Census Division | 2000 | 2001 | 2002 | 2003 | 2004 | 2005 | 2006 | 2007 | 2008 | 2009 |
| SDHU District Office Areas | 15 | 23 | 22 | 24 | 23 | 30 | 25 | 17 | 26 | 29 |
| Manitoulin District | 7 | 11 | 6 | 11 | | 12 | 11 | | 7 | 12 |
| Sudbury District | 8 | 12 | 16 | 13 | 18 | 18 | 14 | 12 | 19 | 17 |
| City of Greater Sudbury | 96 | 83 | 122 | 92 | 96 | 115 | 81 | 129 | 86 | 125 |
Breast cancer by age
Key findings:
- In the SDHU area, the highest number of female breast cancer cases were in 45 to 64 year age group, which had 77 new cases in 2009.
- The highest rate of breast cancer in 2009 in SDHU area females was in the 65–74 and 75 and over age group, with rates of 320 and 323 new cases per 100,000 females, respectively.
- The rate of breast cancer generally increases with age.
- Between 2000 and 2009, the breast cancer rates in the SDHU area have remained stable, despite wide fluctuations seen year to year in the two oldest age groups.
Notes:
- Data Source: Ontario Cancer Registry and Population Estimates, Cancer Care Ontario, SEER*Stat, Oct. 2012 release.
Figure: Annual age-standardized incidence rate, breast cancer, females, by age group, Sudbury & District Health Unit (SDHU) area, 2000–2009
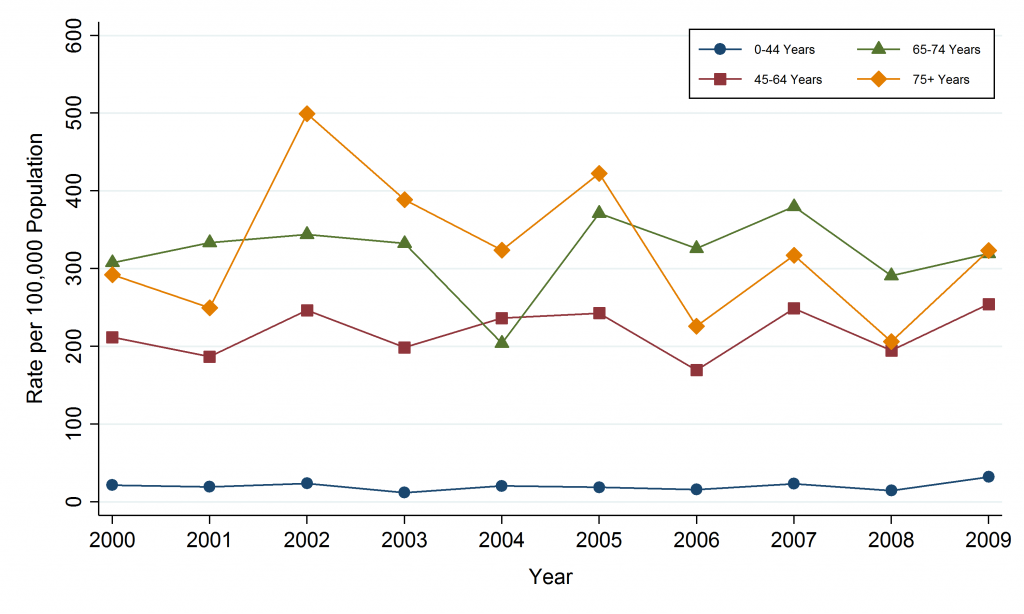
Table: Annual age-standardized incidence rate, breast cancer, females, by age group, Sudbury & District Health Unit (SDHU) area, 2000–2009
| Age at Diagnosis | 2000 | 2001 | 2002 | 2003 | 2004 | 2005 | 2006 | 2007 | 2008 | 2009 |
| 20-44 | 36 | 32.7 | 39.8 | 20.2 | 34.2 | 31.2 | 26.6 | 39.2 | 24.5 | 53.7 |
| 45-64 | 212 | 187 | 246.7 | 198.9 | 236.5 | 242.8 | 169.7 | 249 | 194.9 | 254.4 |
| 65-74 | 307.9 | 333.5 | 344.2 | 332.5 | 204.2 | 371.4 | 326.2 | 379.9 | 291.1 | 319.5 |
| 75+ | 292.5 | 249.7 | 499.3 | 388.7 | 323.8 | 422.4 | 226.3 | 317.4 | 206.3 | 323.3 |
Table: Annual number of case, breast cancer, females, by age group, Sudbury & District Health Unit (SDHU) area, 2000–2009
| Age at Diagnosis | 2000 | 2001 | 2002 | 2003 | 2004 | 2005 | 2006 | 2007 | 2008 | 2009 |
| 20-44 | 15 | 14 | 17 | 8 | 13 | 13 | 11 | 14 | 10 | 19 |
| 45-64 | 52 | 48 | 64 | 53 | 65 | 68 | 48 | 73 | 58 | 77 |
| 65-74 | 25 | 27 | 28 | 27 | 17 | 32 | 29 | 33 | 26 | 29 |
| 75+ | 19 | 17 | 35 | 28 | 24 | 32 | 18 | 26 | 18 | 29 |
Breast cancer deaths by geographic area
Key findings:
- In the SDHU area, there were 43 deaths among women due to breast cancer in 2009.
- In 2009, the rate of breast cancer mortality in the SDHU area was 15 deaths per 100,000 females.
- The annual female breast cancer rates in the SDHU area, northeastern Ontario and Ontario have generally been similar.
- Between 2000 and 2009, the rate of female breast cancer mortality in the SDHU area has been fairly stable.
Notes:
- Rates are age-standardized using the 1991 Canadian population.
- Data Source: Ontario Cancer Registry and Population Estimates, Cancer Care Ontario, SEER*Stat, Oct. 2012 release.
Figure: Annual age-standardized mortality rate, breast cancer, by geographic area, 2000–2009
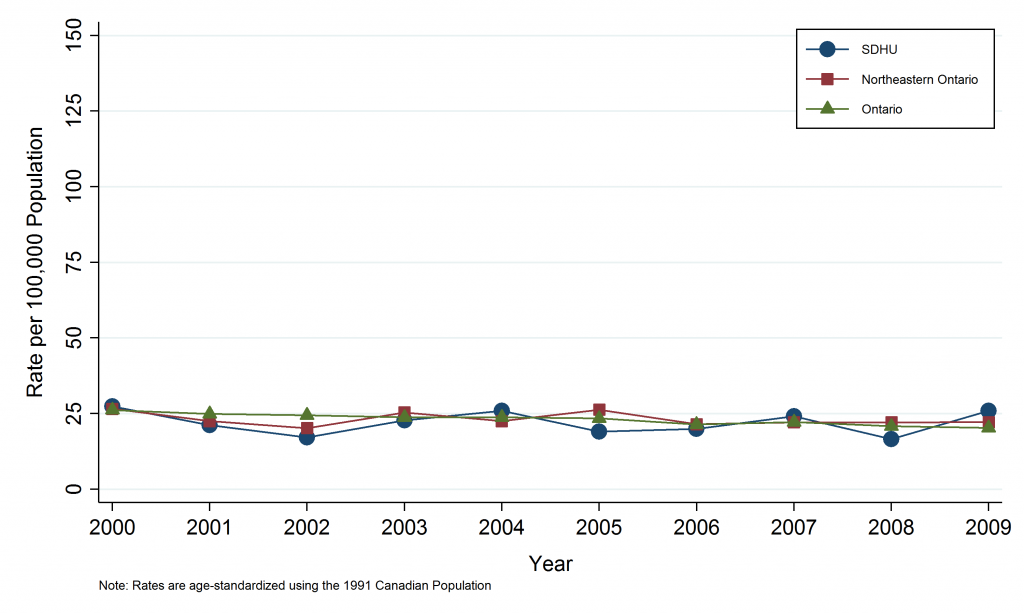
Table: Annual age-standardized mortality rate, breast cancer, by geographic area, 2000–2009
| Geographic Area | 2000 | 2001 | 2002 | 2003 | 2004 | 2005 | 2006 | 2007 | 2008 | 2009 |
| SDHU | 27.4 | 21.2 | 17.1 | 22.8 | 25.9 | 19.1 | 20 | 24.1 | 16.6 | 25.9 |
| Northeast Ontario | 26.6 | 22.5 | 20.2 | 25.4 | 22.5 | 26.3 | 21.5 | 22.1 | 22.1 | 22.2 |
| Ontario | 26.2 | 24.9 | 24.5 | 23.8 | 23.8 | 23.4 | 21.4 | 22.2 | 20.8 | 20.3 |
Table: Annual number of cases of mortality, breast cancer, by geographic area, 2000–2009
| Geographic Area | 2000 | 2001 | 2002 | 2003 | 2004 | 2005 | 2006 | 2007 | 2008 | 2009 |
| SDHU | 35 | 28 | 22 | 30 | 36 | 28 | 29 | 37 | 25 | 42 |
| Northeast Ontario | 103 | 91 | 77 | 102 | 94 | 116 | 94 | 98 | 100 | 108 |
| Ontario | 1920 | 1869 | 1886 | 1886 | 1941 | 1965 | 1839 | 1951 | 1888 | 1885 |
This item was last modified on March 26, 2018