Melanoma
Melanoma is an abnormal growth of the cells of the skin that produce melanin (colour). It is the least common but most serious of all of the skin cancers. There are many risk factors (Public Health Agency of Canada) for melanoma; however, the most common risk is exposure to ultraviolet rays from the sun or tanning beds.
Rates of melanoma are too low to provide reliable estimates by age or by geographic area below the Health Unit level. Also, melanoma mortality rates are too low to be reliably reported.
Melanoma by geographic area
Key findings:
- In the Sudbury & District Health Unit (SDHU) area, there were 31 new cases of melanoma in 2009.
- In 2009, the rate of melanoma in the SDHU area was 12 new cases per 100,000 population. Due to small numbers, the rates reported for the SDHU area should be interpreted with caution.
- Melanoma rates were similar in the SDHU area, northeastern Ontario and Ontario.
- Between 2000 and 2009, melanoma rates remained stable.
Notes:
- Rates are age-standardized using the 1991 Canadian population.
- Data Source: Ontario Cancer Registry and Population Estimates, Cancer Care Ontario, SEER*Stat, Oct. 2012 release.
Figure: Annual age-standardized incidence rate, melanoma, by geographic area, 2000–2009
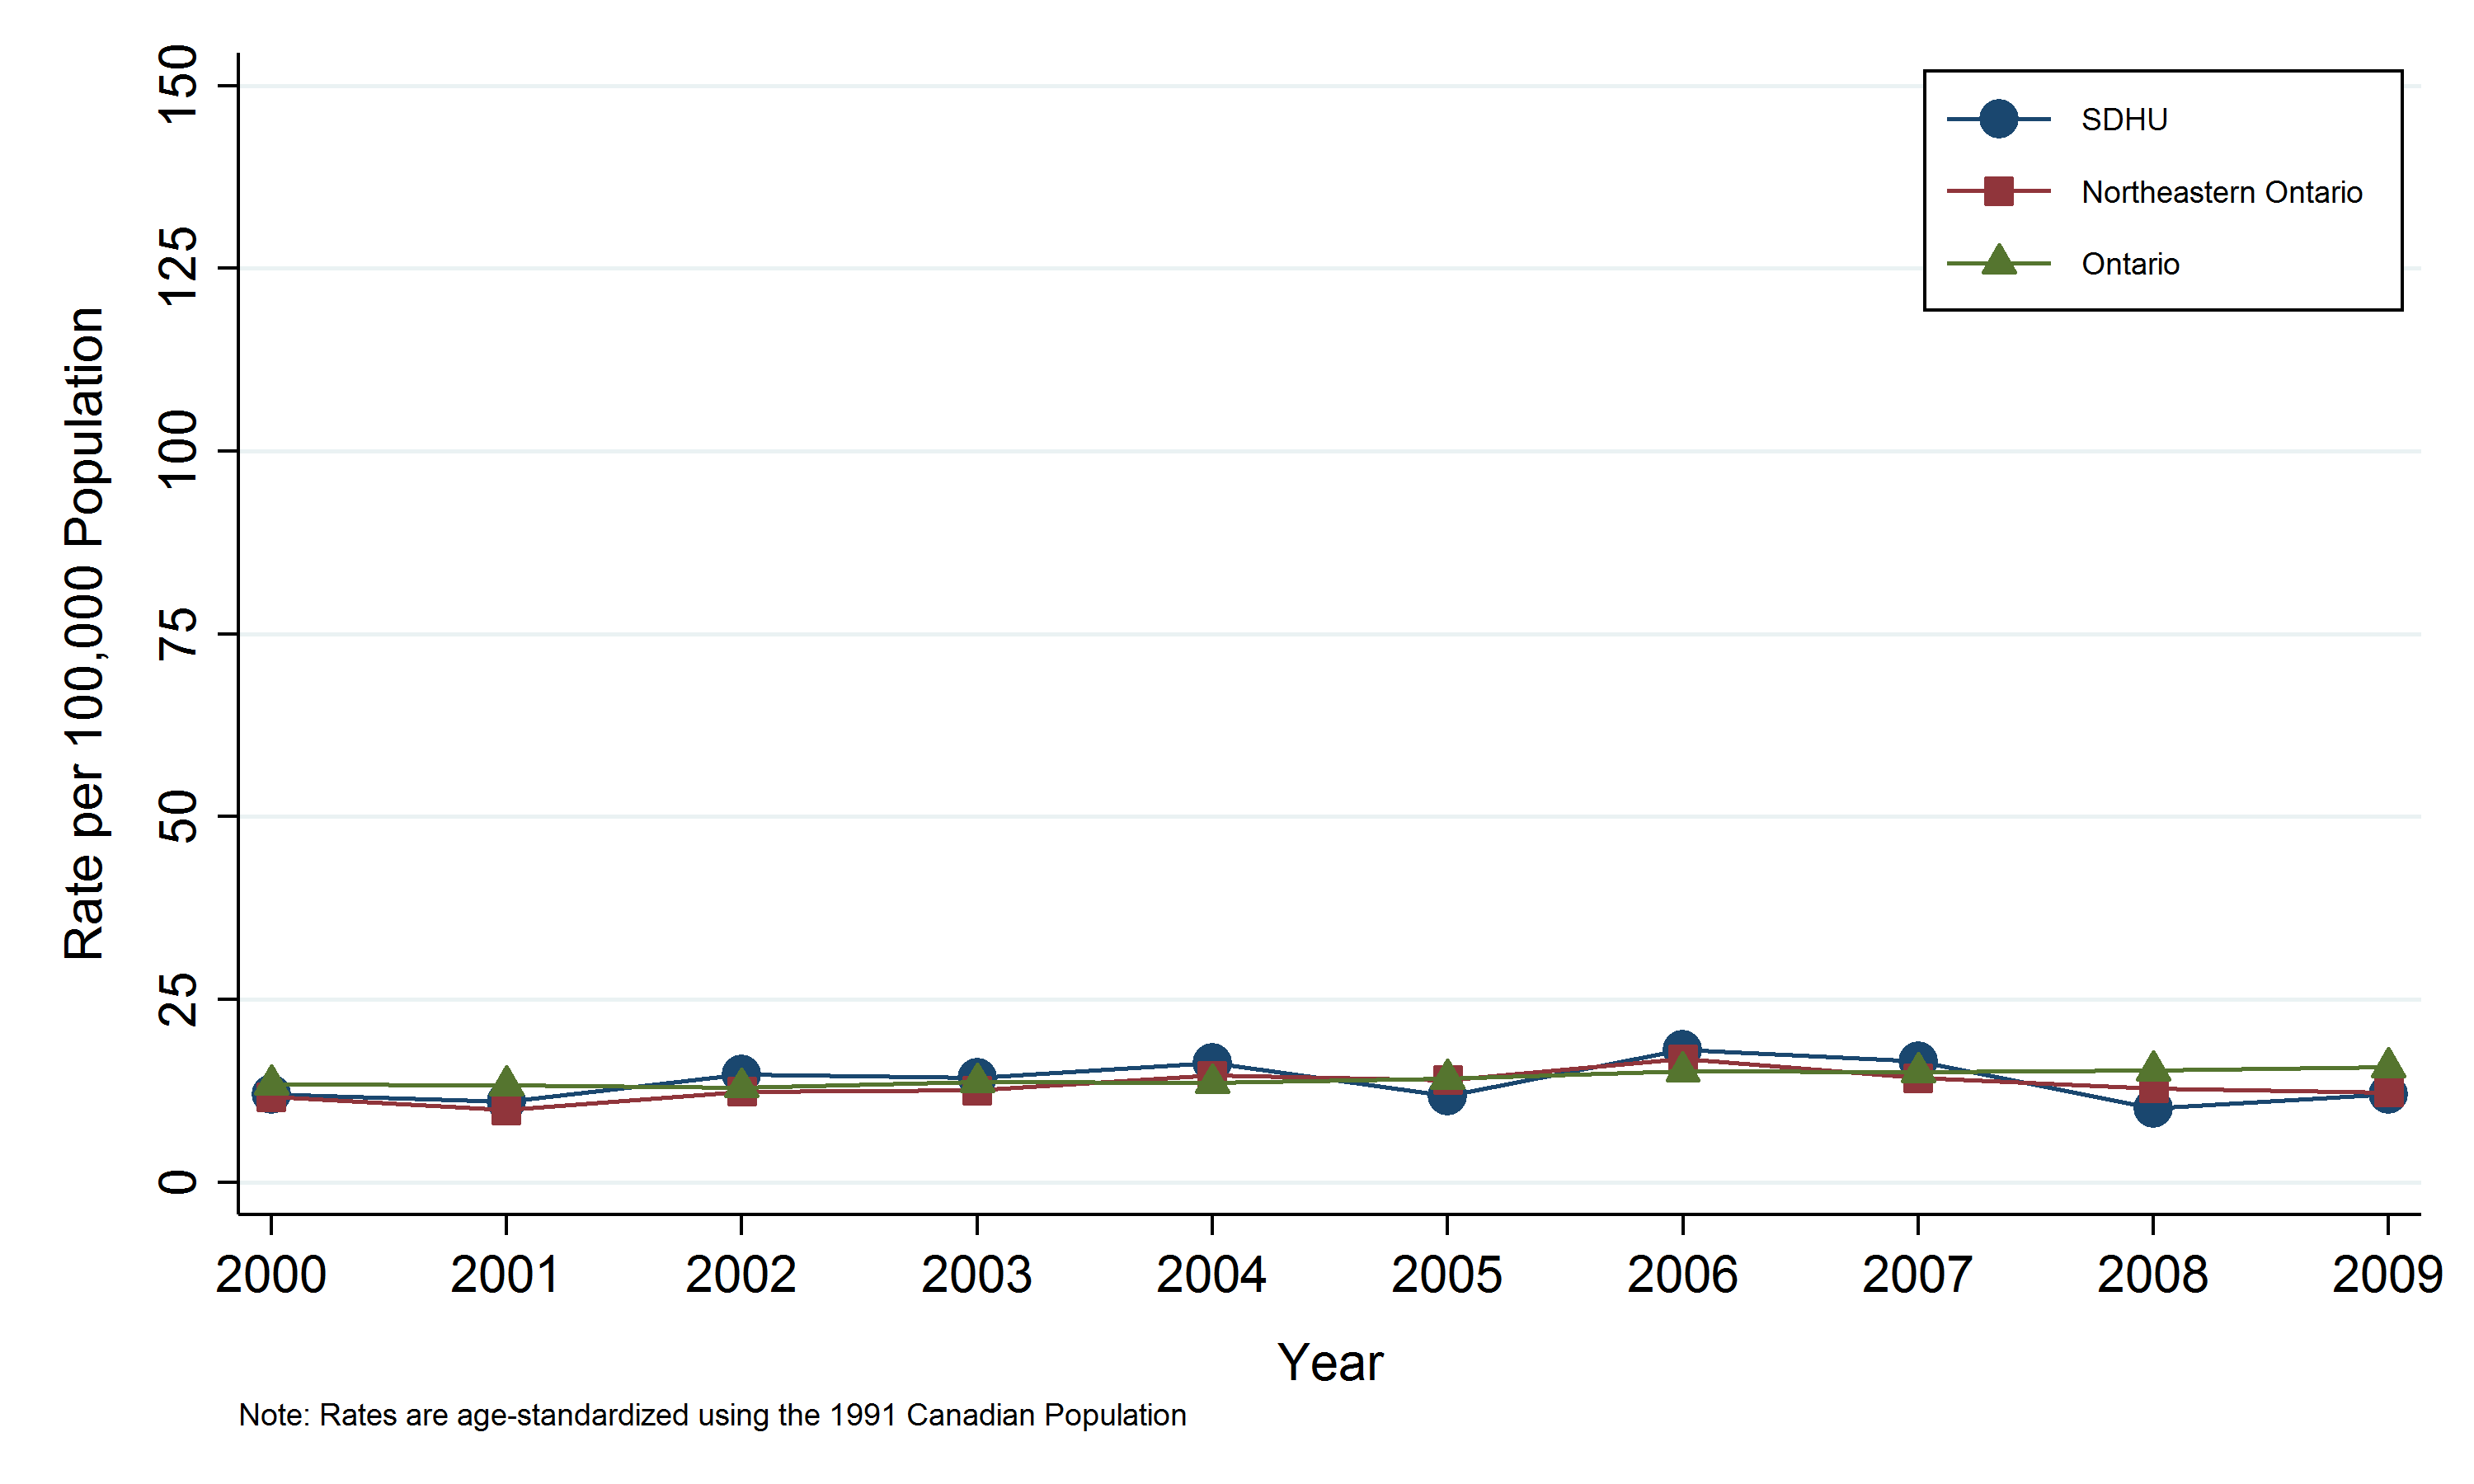
Table: Annual age-standardized incidence rate, melanoma, by geographic area, 2000–2009
| Geographic Area | 2000 | 2001 | 2002 | 2003 | 2004 | 2005 | 2006 | 2007 | 2008 | 2009 |
|---|---|---|---|---|---|---|---|---|---|---|
| SDHU | 12.1 | 11 | 14.8 | 14.3 | 16.3 | 11.8 | 18.1 | 16.6 | 10.1 | 12.1 |
| Northeast Ontario | 11.7 | 9.9 | 12.4 | 12.6 | 14.6 | 14 | 16.9 | 14.3 | 12.9 | 12.3 |
| Ontario | 13.4 | 13.3 | 13 | 13.7 | 13.6 | 14.2 | 15.2 | 15.1 | 15.3 | 15.8 |
Table: Annual number of cases, melanoma, by geographic area, 2000–2009
| Geographic Area | 2000 | 2001 | 2002 | 2003 | 2004 | 2005 | 2006 | 2007 | 2008 | 2009 |
|---|---|---|---|---|---|---|---|---|---|---|
| SDHU | 27 | 26 | 34 | 35 | 38 | 31 | 46 | 42 | 28 | 31 |
| Northeast Ontario | 78 | 70 | 83 | 89 | 105 | 99 | 126 | 110 | 100 | 98 |
| Ontario | 1690 | 1747 | 1730 | 1852 | 1911 | 2030 | 2230 | 2287 | 2342 | 2485 |
Melanoma by sex
Key findings:
- In 2009, there were 15 males and 16 females diagnosed with melanoma in the SDHU area.
- In the SDHU area, the rate of melanoma in 2009 was 12 new cases per 100,000 males and 13 new cases per 100,000 females. Due to small numbers, the rates reported should be interpreted with caution.
- The rate of melanoma among males and females has generally been similar.
- Between 2000 and 2009, melanoma rates have remained relatively stable over the time period.
Notes:
- Rates are age-standardized using the 1991 Canadian population.
- Data Source: Ontario Cancer Registry and Population Estimates, Cancer Care Ontario, SEER*Stat, Oct. 2012 release.
Figure: Annual age-standardized incidence rates, melanoma, by sex, Sudbury & District Health Unit (SDHU) area, 2000–2009
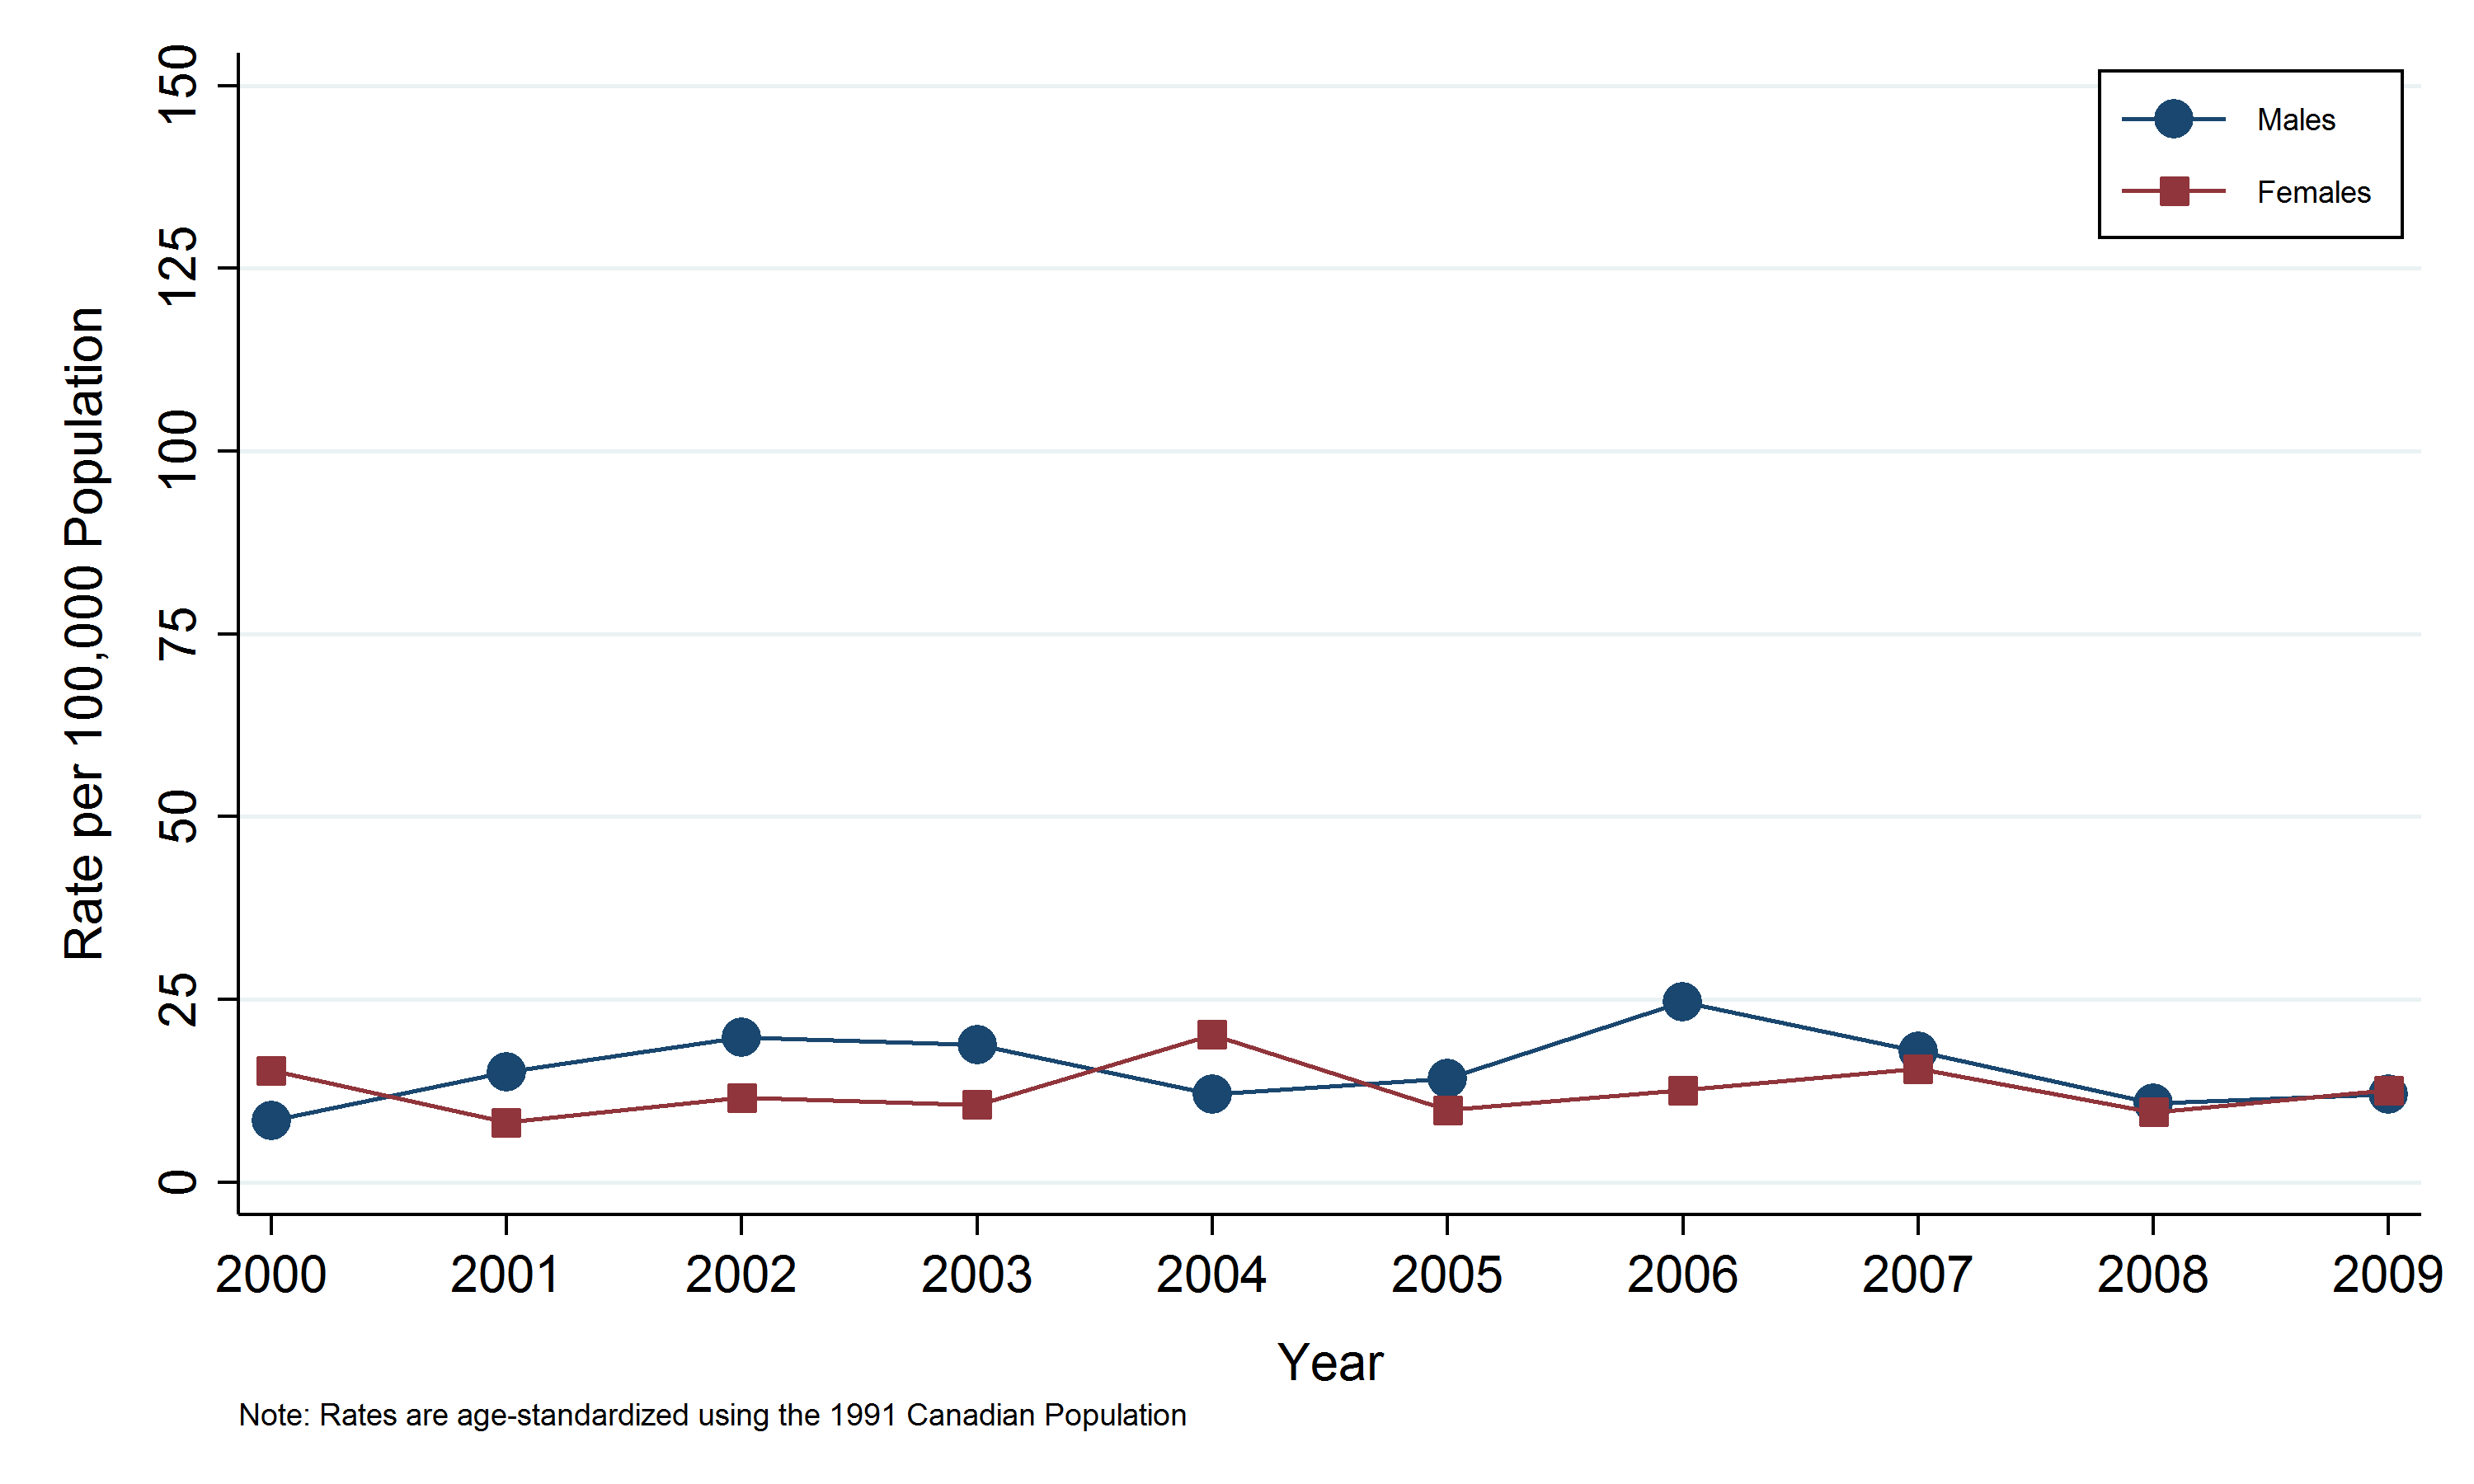
Table: Annual age-standardized incidence rates, melanoma, by sex, Sudbury & District Health Unit (SDHU) area, 2000–2009
| Sex | 2000 | 2001 | 2002 | 2003 | 2004 | 2005 | 2006 | 2007 | 2008 | 2009 |
|---|---|---|---|---|---|---|---|---|---|---|
| Both | 12.1 | 11 | 14.8 | 14.3 | 16.3 | 11.8 | 18.1 | 16.6 | 10.1 | 12.1 |
| Males | 8.4 | 15.1 | 19.8 | 18.8 | 12.1 | 14.2 | 24.7 | 17.9 | 10.8 | 12 |
| Females | 15.3 | 8.2 | 11.6 | 10.6 | 20.2 | 9.9 | 12.6 | 15.5 | 9.6 | 12.6 |
Table: Annual number of cases, melanoma, by sex, Sudbury & District Health Unit (SDHU) area, 2000–2009
| Sex | 2000 | 2001 | 2002 | 2003 | 2004 | 2005 | 2006 | 2007 | 2008 | 2009 |
|---|---|---|---|---|---|---|---|---|---|---|
| Both | 27 | 26 | 34 | 35 | 38 | 31 | 46 | 42 | 28 | 31 |
| Males | 9 | 17 | 20 | 21 | 14 | 17 | 29 | 22 | 14 | 15 |
| Females | 18 | 9 | 14 | 14 | 24 | 14 | 17 | 20 | 14 | 16 |
This item was last modified on March 26, 2018