Hypertension
Hypertension is a chronic condition of consistently high blood pressure over a long period of time. Blood pressure is the force of blood inside the walls of blood vessels. High blood pressure (Heart & Stroke Foundation) is usually defined as a systolic blood pressure (top number) at 140 mmHg or higher and/or a diastolic blood pressure (bottom number) at 90 mmHg or higher.
Hypertension by geographic area
Key findings:
- In 2013/14, survey results indicated that prevalence rate of hypertension was 20% in the Sudbury & District Health Unit (SDHU) area.
- The prevalence rate of hypertension in the SDHU area has consistently been similar to that reported in northeastern Ontario, and in Ontario overall.
- Between 2005 and 2013/14, the rate of hypertension in the SDHU area has not varied significantly.
Notes:
- Rates are age-standardized using the 2006 Canadian population.
- Rates are for the population aged 12 years and older.
- Data Source: Canadian Community Health Survey, Ontario Share Files, Statistics Canada.
Figure: Age-standardized prevalence rate, hypertension (self-reported), by year and geographic area, 2005 to 2013/14
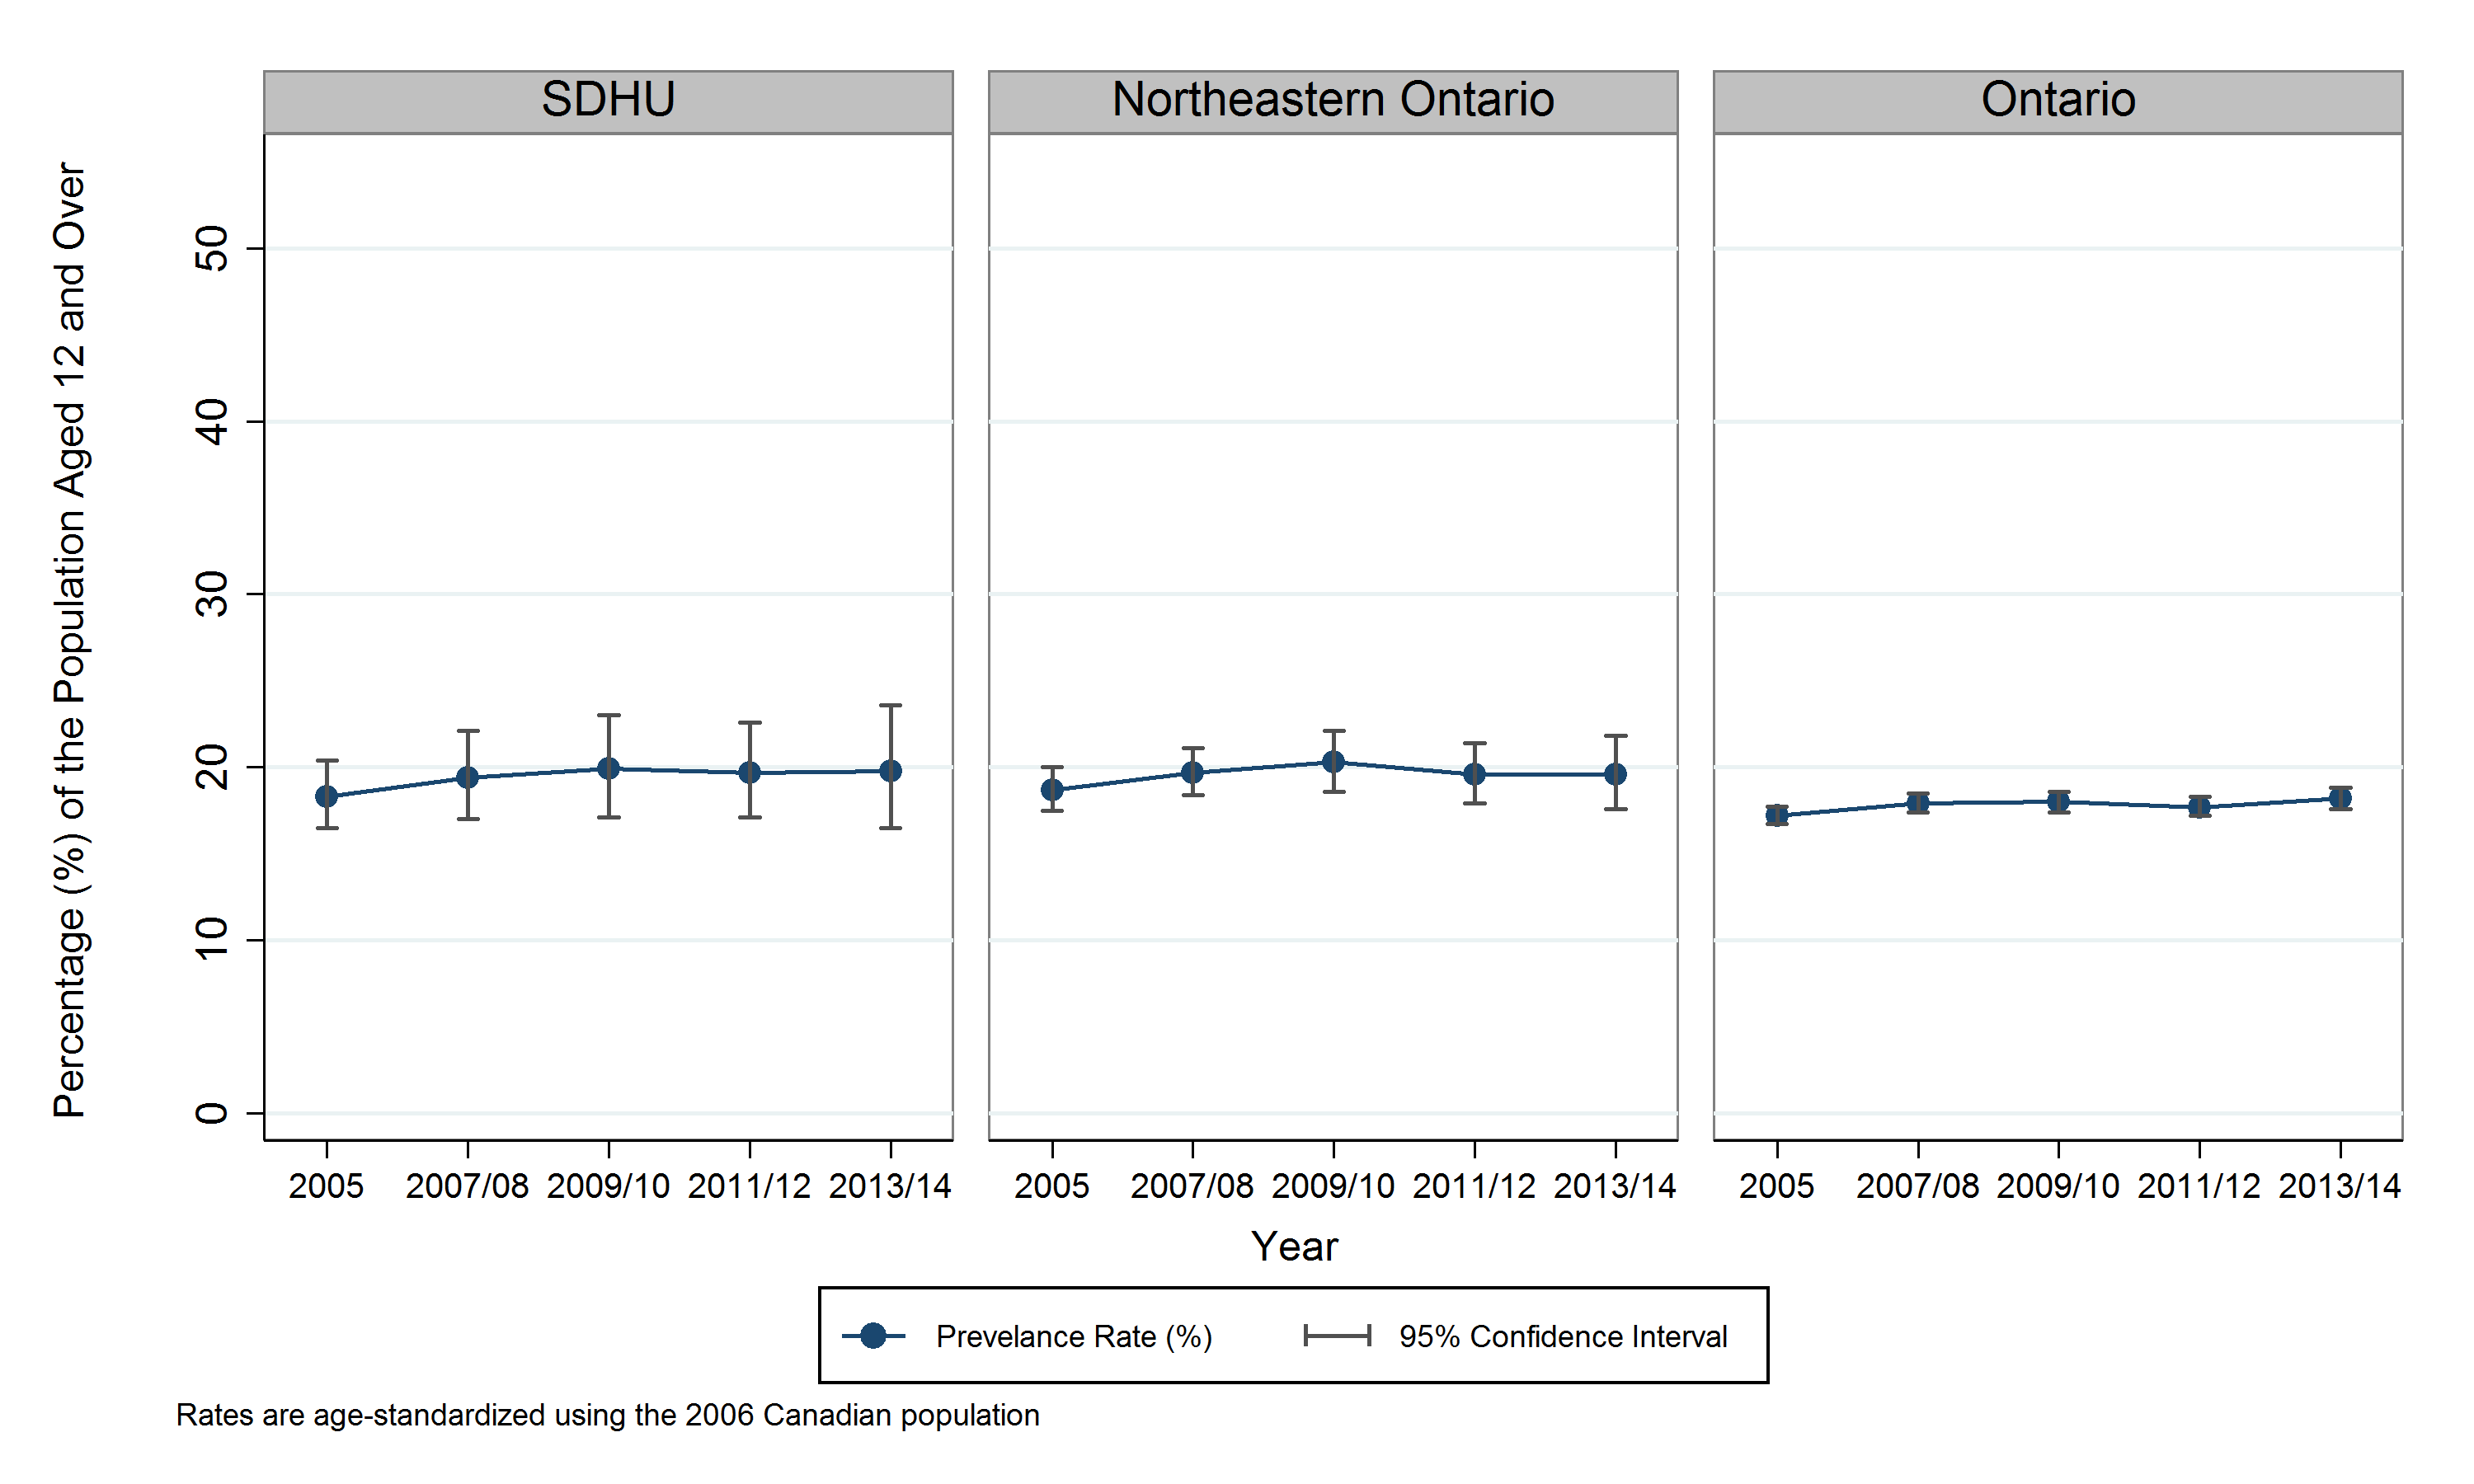
Table: Age-standardized prevalence rate, hypertension (self-reported), by year and geographic area, 2005 to 2013/14
| Geographic Area | measure | 2005 | 2007/08 | 2009/10 | 2011/12 | 2013/14 |
|---|---|---|---|---|---|---|
| SDHU | Percentage (%) | 18.3 | 19.4 | 19.9 | 19.7 | 19.8 |
| SDHU | 95% Confidence Interval | 16.5 to 20.4 | 17.0 to 22.1 | 17.1 to 23.0 | 17.1 to 22.6 | 16.5 to 23.6 |
| Northeastern Ontario | Percentage (%) | 18.7 | 19.7 | 20.3 | 19.6 | 19.6 |
| Northeastern Ontario | 95% Confidence Interval | 17.5 to 20.0 | 18.4 to 21.1 | 18.6 to 22.1 | 17.9 to 21.4 | 17.6 to 21.8 |
| Ontario | Percentage (%) | 17.2 | 17.9 | 18.0 | 17.7 | 18.2 |
| Ontario | 95% Confidence Interval | 16.7 to 17.7 | 17.4 to 18.5 | 17.4 to 18.6 | 17.2 to 18.3 | 17.6 to 18.8 |
Hypertension by sex
Key findings:
- In 2013/14, survey results indicated that prevalence rate of hypertension was 22% in males, and 17% in females, in the SDHU area.
- The prevalence rate of hypertension in the SDHU area males has consistently been higher than in SDHU-area females.
- Between 2005 and 2013/14, the rate of hypertension in the SDHU area has not varied significantly in either males or females.
Notes:
- Rates are age-standardized using the 2006 Canadian population.
- Rates are for the population aged 12 years and older.
- Data Source: Canadian Community Health Survey, Ontario Share Files, Statistics Canada.
Figure: Age-standardized prevalence rate, hypertension (self-reported), by year and sex, 2005 to 2013/14
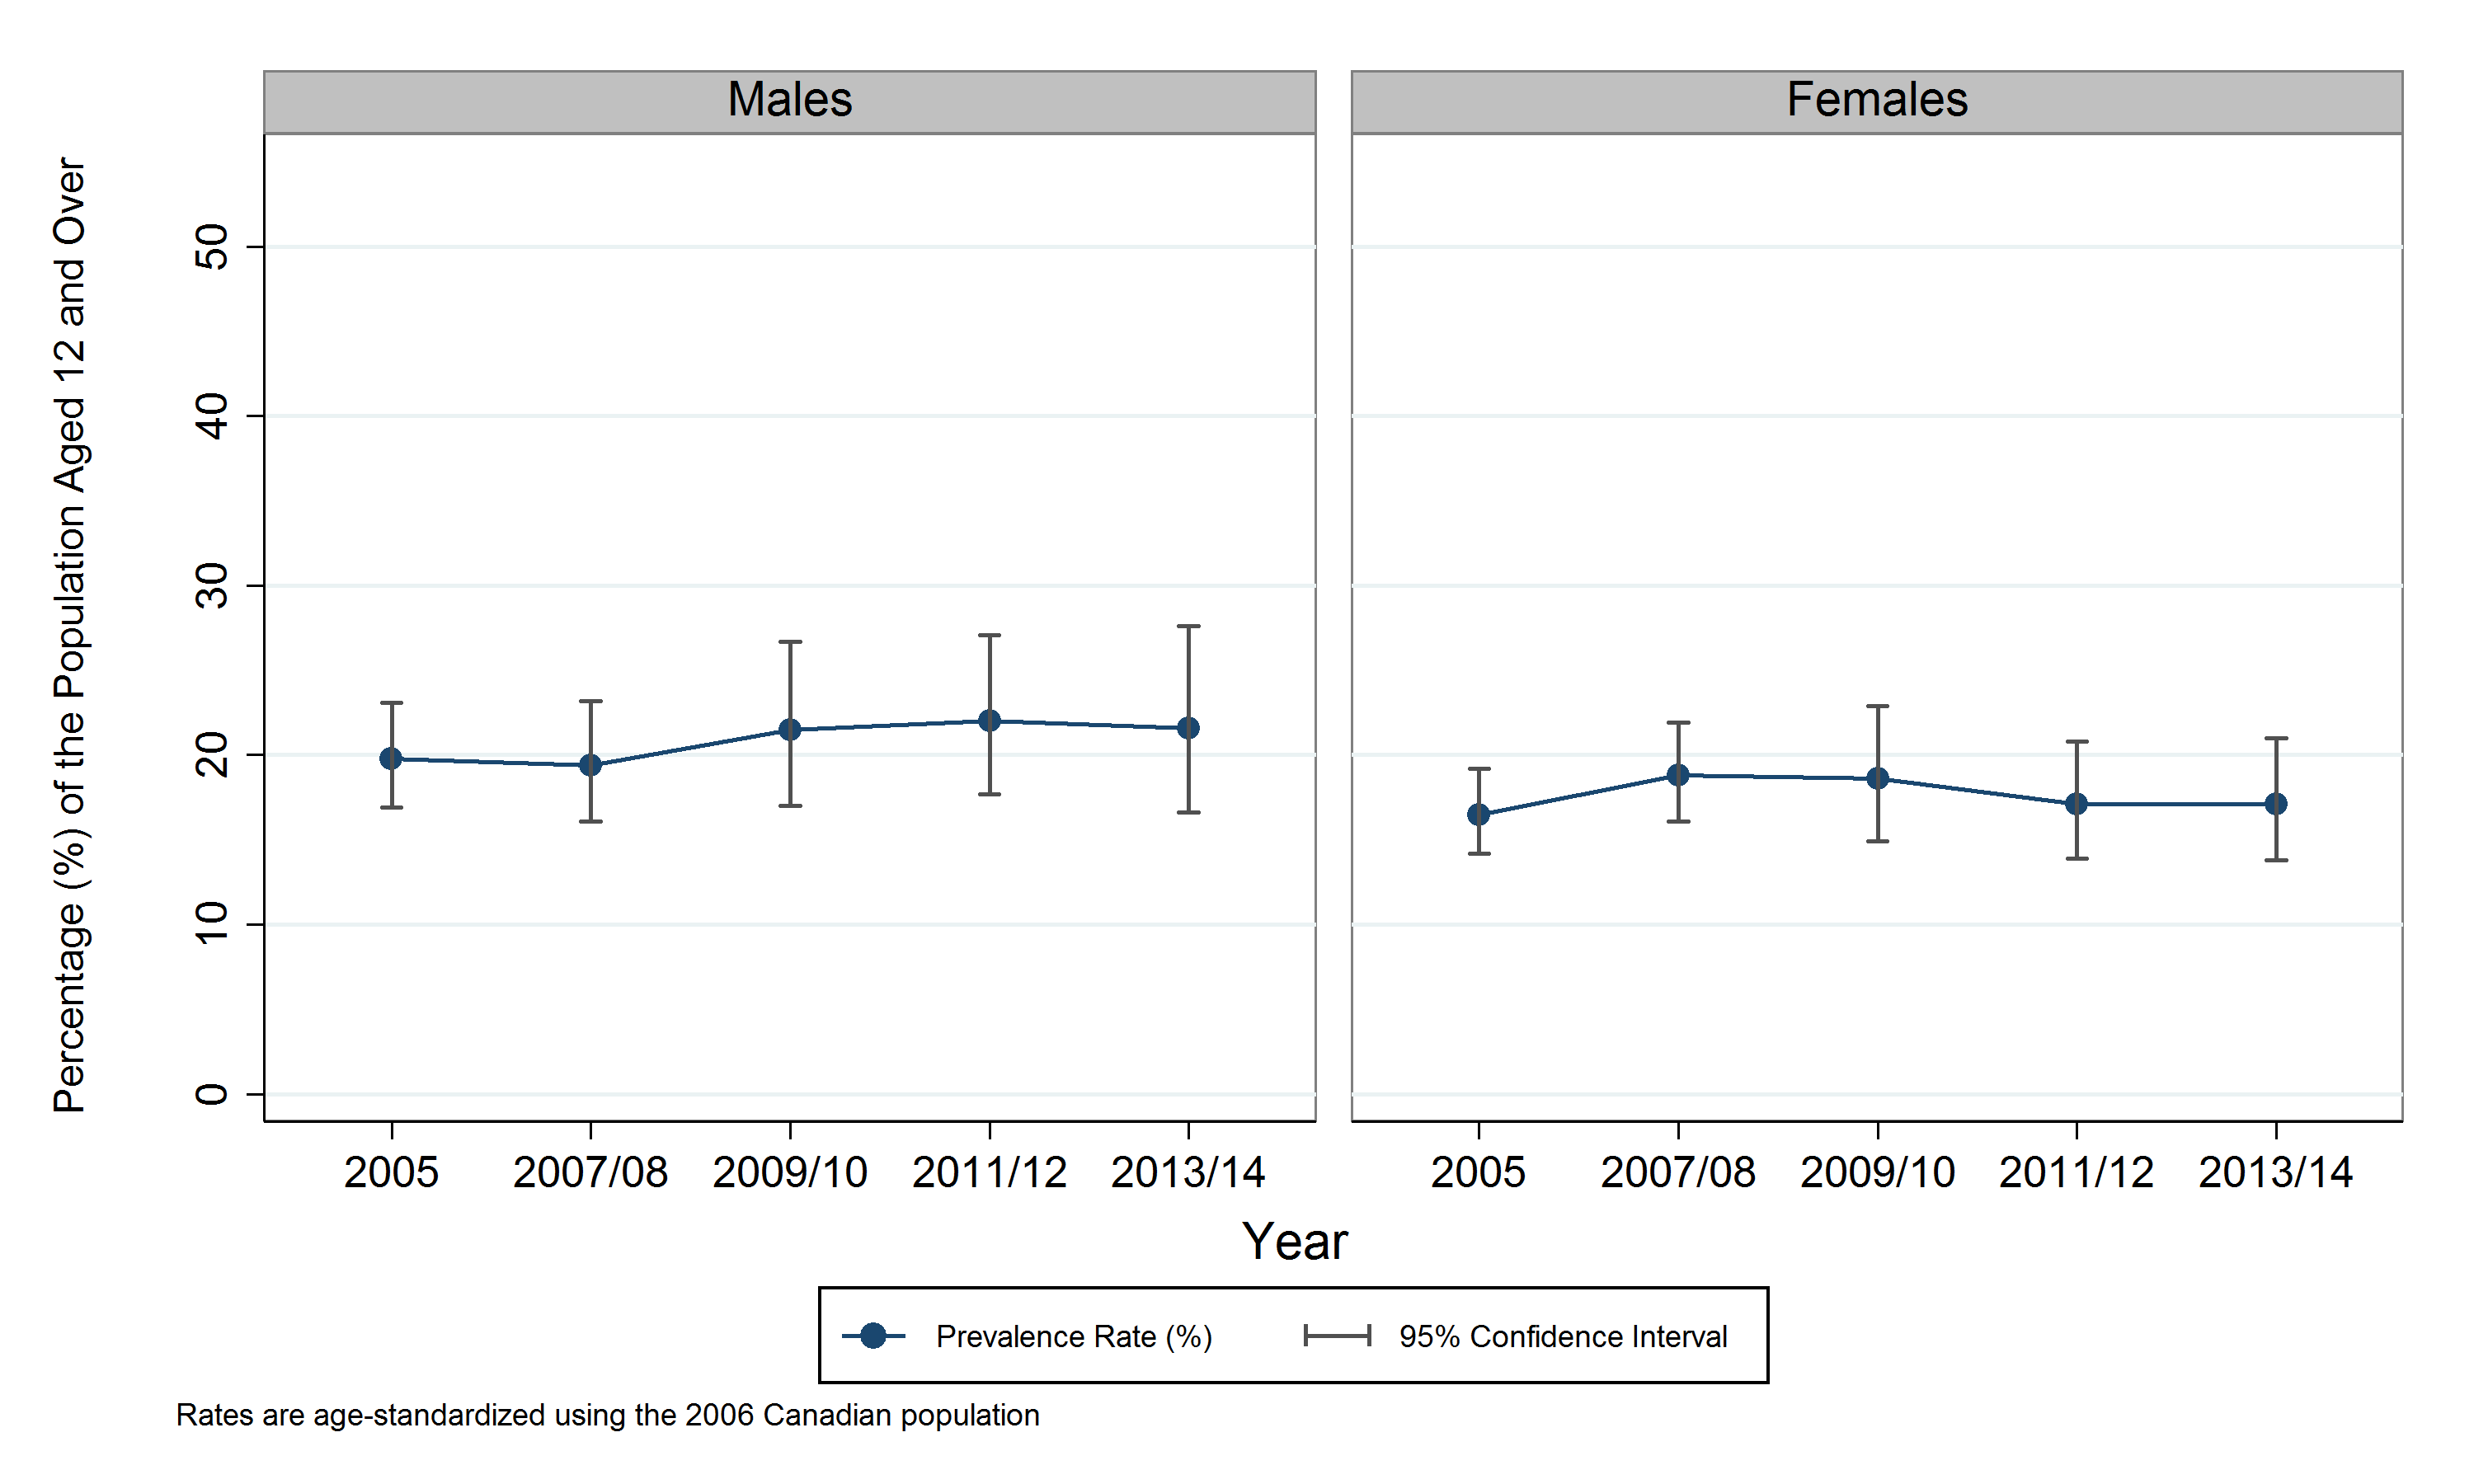
Table: Age-standardized prevalence rate, hypertension (self-reported), by year and sex, 2005 to 2013/14
| sex | measure | 2005 | 2007/08 | 2009/10 | 2011/12 | 2013/14 |
|---|---|---|---|---|---|---|
| Males | Percentage (%) | 19.8 | 19.4 | 21.5 | 22.0 | 21.6 |
| Males | 95% Confidence Interval | 16.9 to 23.1 | 16.1 to 23.2 | 17.0 to 26.7 | 17.7 to 27.1 | 16.6 to 27.6 |
| Females | Percentage (%) | 16.5 | 18.8 | 18.6 | 17.1 | 17.1 |
| Females | 95% Confidence Interval | 14.2 to 19.2 | 16.1 to 21.9 | 14.9 to 22.9 | 13.9 to 20.8 | 13.8 to 21.0 |
Hypertension by age group
Key findings:
- In 2013/14, survey results indicated that the prevalence rate of hypertension was 56% in adults aged 65 years and over in the SDHU area. This is much higher than the rate in younger age groups.
- Reported rates of hypertension varied from year to year between 2005 and 2013/14, but these differences are within the margin of error of the survey. Thus, there is no clear trend in the prevalence rate of hypertension within each age group.
Notes:
- Rates are for the population aged 12 years and older.
- Data Source: Canadian Community Health Survey, Ontario Share Files, Statistics Canada.
Figure: Prevalence rate, hypertension (self-reported), by year and age group, 2005 to 2013/14
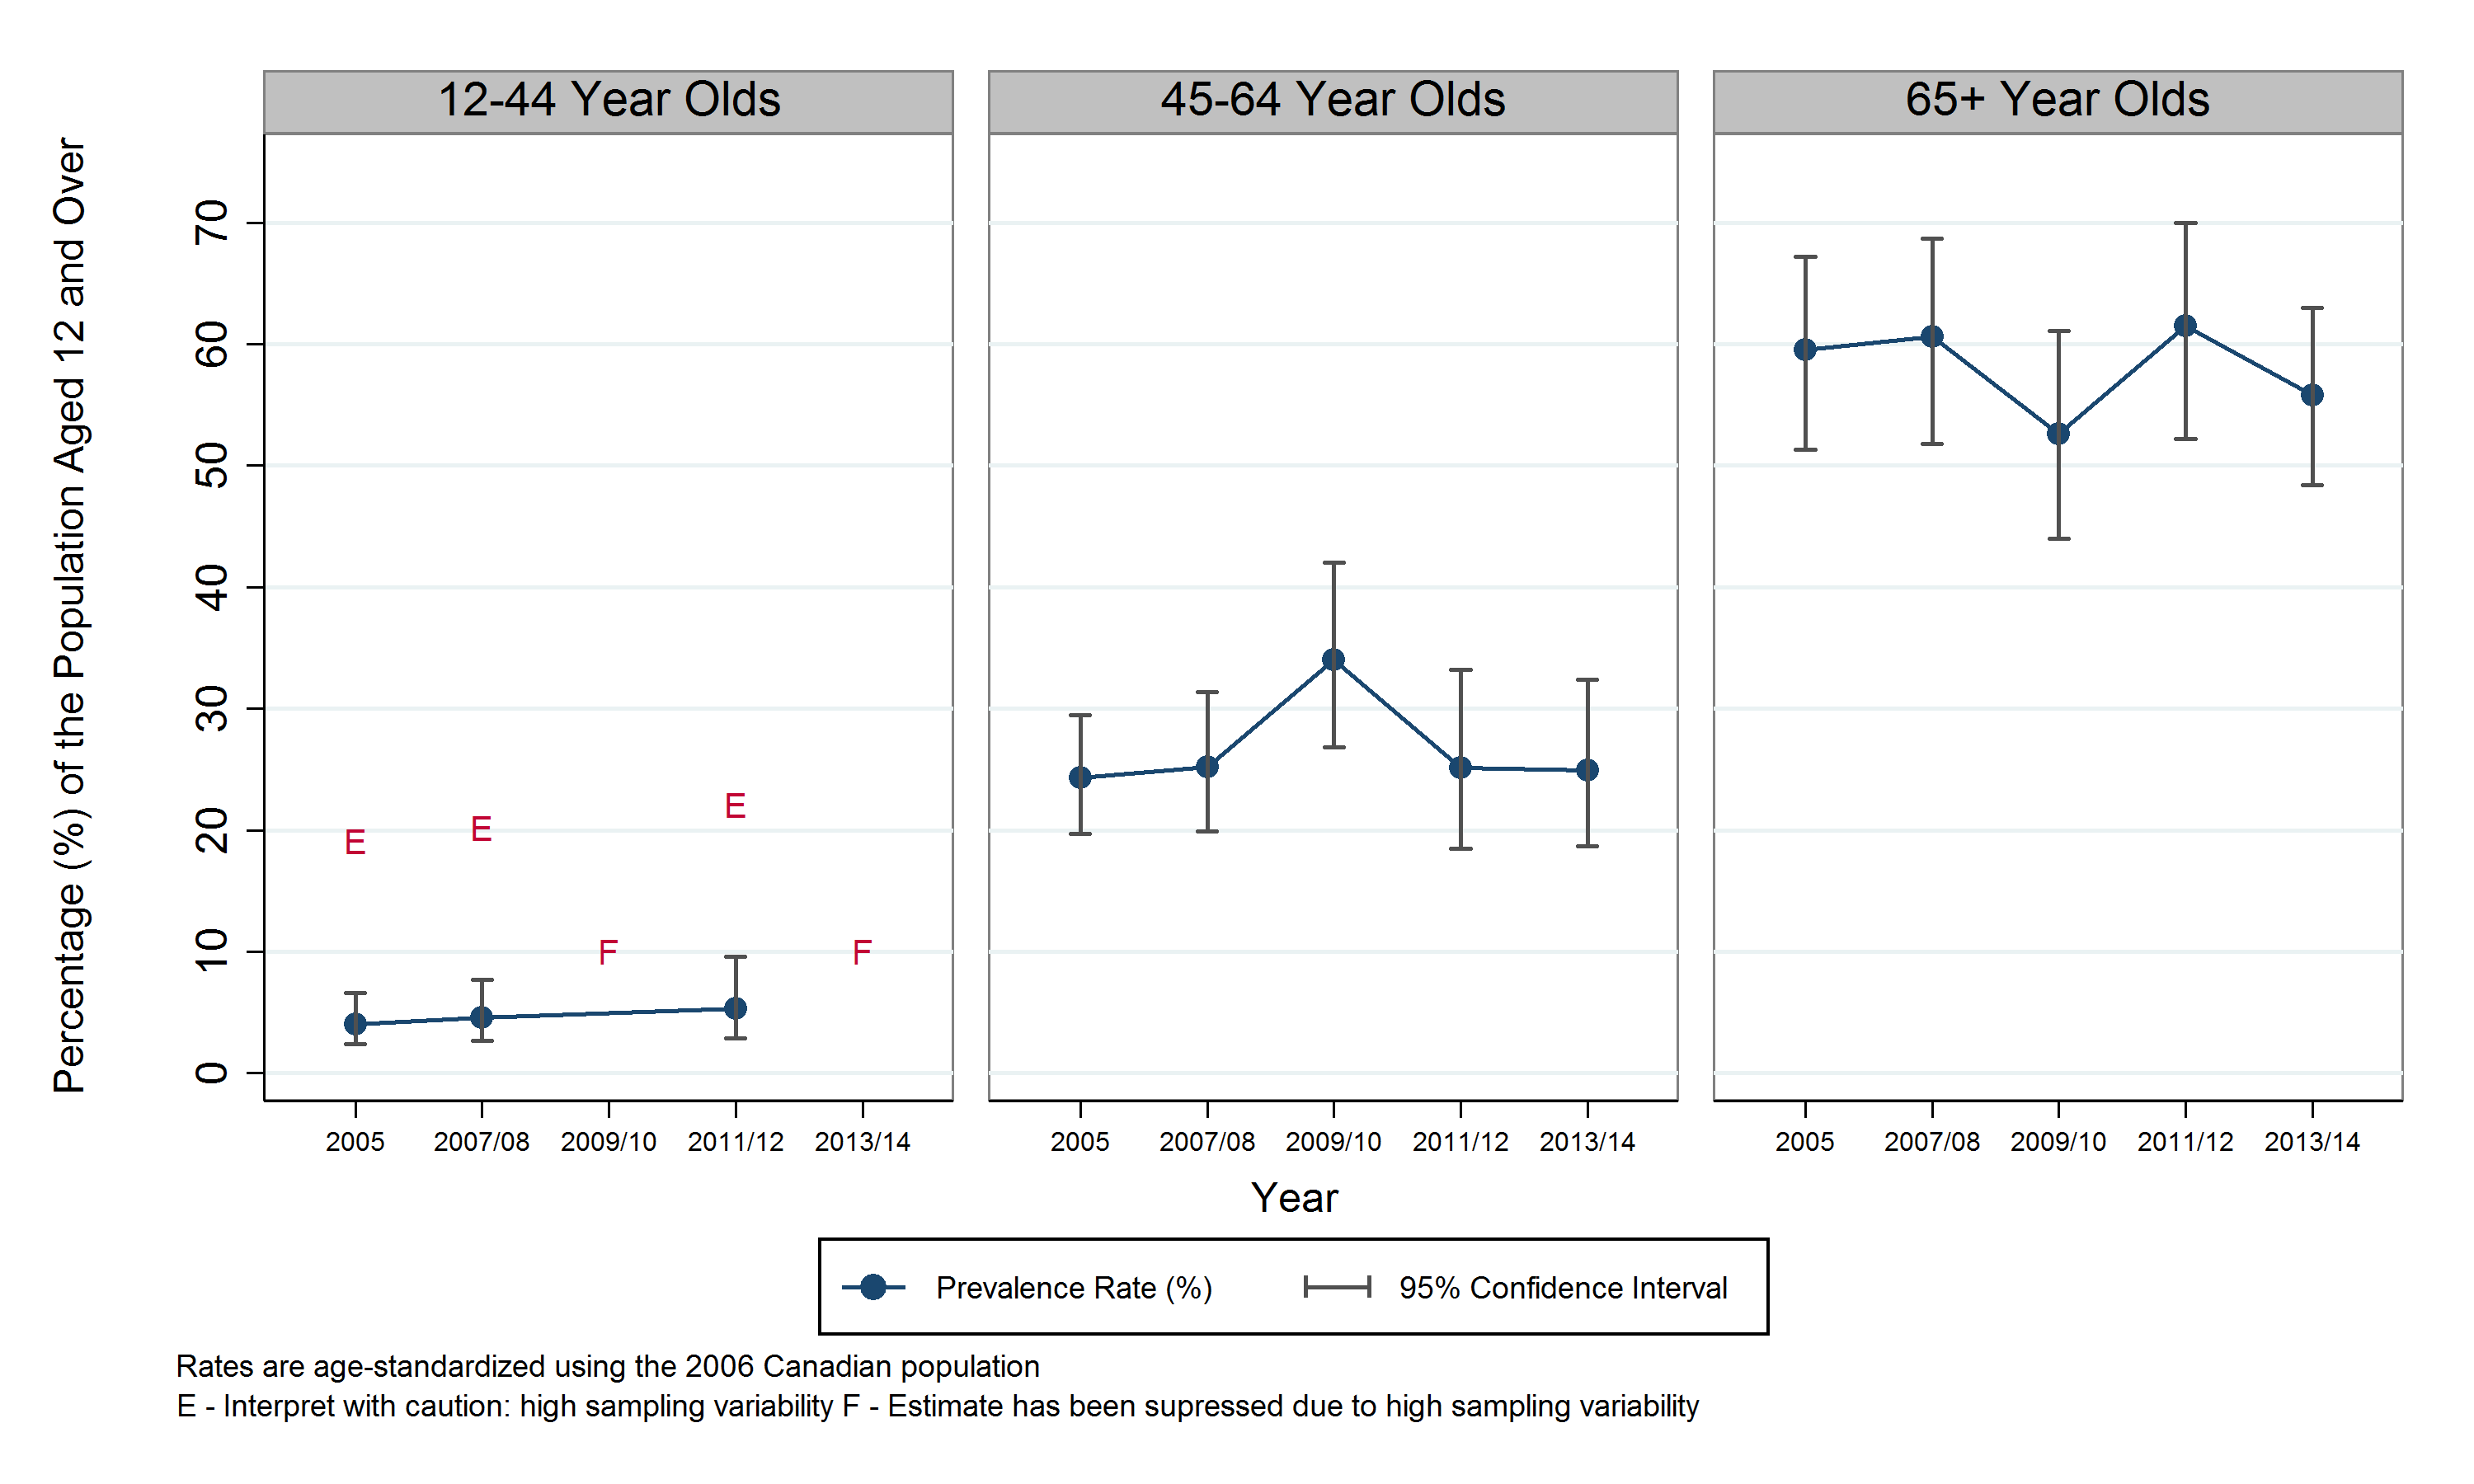
Table: Prevalence rate, hypertension (self-reported), by year and age group, 2005 to 2013/14
Note: Numbers followed by the letter “E” are to be interpreted with caution due to high sampling variability.
The letter “F” is to be interpreted as an estimate which has been suppressed due to high sampling variability.
| age groups | measure | 2005 | 2007/08 | 2009/10 | 2011/12 | 2013/14 |
|---|---|---|---|---|---|---|
| 12-44 | Percentage (%) | 4.0 E | 4.6 E | F | 5.3 E | F |
| 12-44 | 95% Confidence Interval | 2.4 to 6.6 E | 2.7 to 7.7 E | F | 2.9 to 9.6 E | F |
| 45-64 | Percentage (%) | 24.3 | 25.2 | 34.0 | 25.1 | 24.9 |
| 45-64 | 95% Confidence Interval | 19.7 to 29.5 | 19.9 to 31.4 | 26.8 to 42.0 | 18.5 to 33.2 | 18.7 to 32.4 |
| 65+ | Percentage (%) | 59.5 | 60.6 | 52.6 | 61.5 | 55.8 |
| 65+ | 95% Confidence Interval | 51.3 to 67.2 | 51.8 to 68.7 | 44.0 to 61.1 | 52.2 to 70.0 | 48.4 to 63.0 |
This item was last modified on April 15, 2024