Physical activity
How physically active a person is can be measured by the physical activity index (PAI). This index combines information on:
- the activities the person did
- the amount of time they spent doing those activities
- how demanding the activities are (measured in “kilo-calories” (kcal) of energy spent per hour)
- how much the person weighs (in kilograms)
Based on the above, the person is categorized as active, moderately active or inactive, as follows:
- Active: 3.0+kcal/kg/day of energy expenditure on average
- Moderately active: 1.5-2.9 kcal/kg/day of energy expenditure on average
- Inactive: less than 1.5 kcal/kg/day of energy expenditure on average
In this section, we present rates of individuals aged 12 and over who are classified as “active” based on activity they do during their leisure time.
- overall levels of physical activity
- by geographic area
- by sex
- by age group
- by income
- by education
- by first official language spoken
Overall Levels of Physical Activity
Overall findings:
- In 2013/14, survey results indicated that 31% of the Sudbury and districts population aged 12 years and older were physically active, while 26% were moderately physically active and 43% were inactive.
- Between 2007/08 and 2013/14, the prevalence rate of each category of physical activity in Sudbury and districts has not varied significantly.
Notes:
- Rates are age-standardized using the 2011 Canadian population.
- Rates are for the population aged 12 years and older.
- Data source: Canadian Community Health Survey (CCHS), 2007 to 2014, Statistics Canada, Share File, Ontario Ministry of Health and Long-Term Care.
Figure: Age-standardized prevalence rate, levels of physical activity, by year, Sudbury and districts, ages 12+, 2007/08 to 2013/14
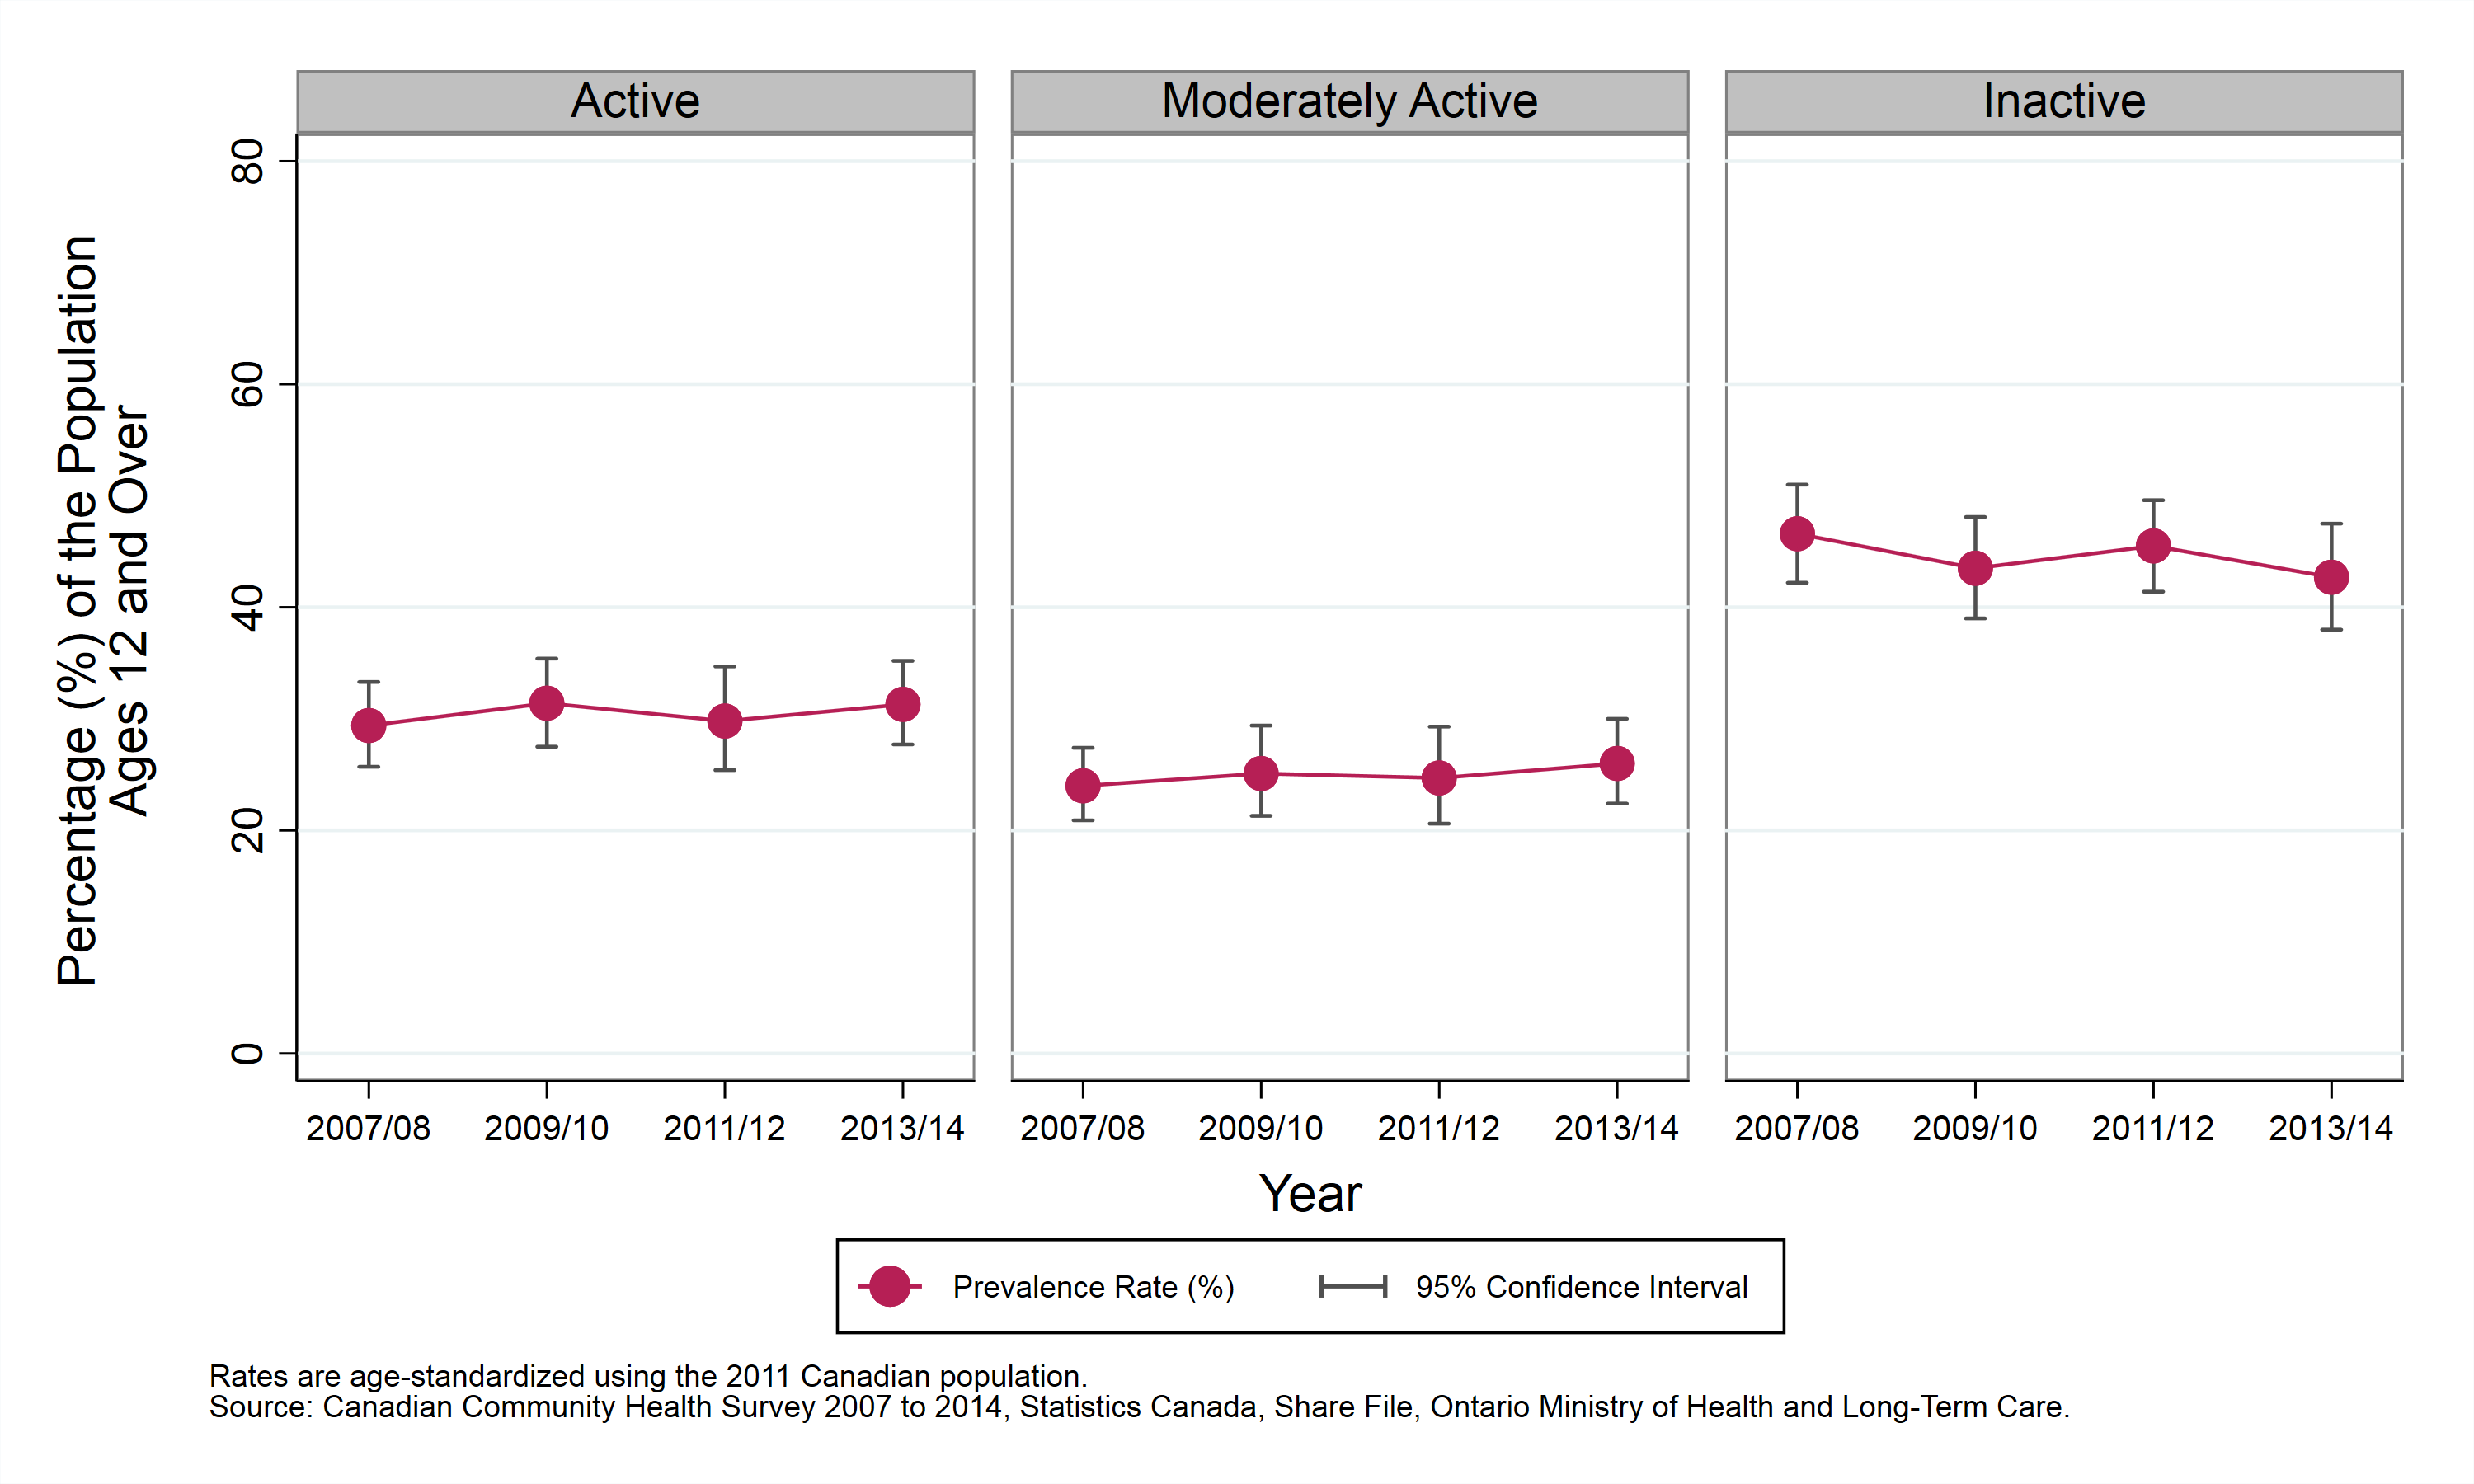
Table: Age-standardized prevalence rate, levels of physical activity, by year, Sudbury and districts, ages 12+, 2007/08 to 2013/14
| Physical Activity | Prevalence Rate, 2007 to 2008 | Prevalence Rate, 2009 to 2010 | Prevalence Rate, 2011 to 2012 | Prevalence Rate, 2013 to 2014 |
|---|---|---|---|---|
| Active | 29.4% (CI: 25.7% to 33.3%) | 31.4% (CI: 27.5% to 35.4%) | 29.8% (CI: 25.4% to 34.7%) | 31.3% (CI: 27.7% to 35.2%) |
| Moderately Active | 24.0% (CI: 20.9% to 27.4%) | 25.1% (CI: 21.3% to 29.4%) | 24.7% (CI: 20.6% to 29.3%) | 26.0% (CI: 22.4% to 30.0%) |
| Inactive | 46.6% (CI: 42.2% to 51.0%) | 43.5% (CI: 39.0% to 48.1%) | 45.5% (CI: 41.4% to 49.6%) | 42.7% (CI: 38.0% to 47.5%) |
Physical activity by geographic area
Key Findings
- In 2013/14, survey results indicated that 31% of the Sudbury and districts population aged 12 years and older was physically active.
- The prevalence rate of physically active individuals in Sudbury and districts has been similar to that reported in northeastern Ontario and Ontario overall.
- Between 2007/08 and 2013/14, the proportion of the Sudbury and districts population who were physically active has not varied significantly.
Notes:
- Rates are age-standardized using the 2011 Canadian population.
- Rates are for the population aged 12 years and older.
- Data source: Canadian Community Health Survey (CCHS), 2007 to 2014, Statistics Canada, Share File, Ontario Ministry of Health and Long-Term Care.
Figure: Age-standardized prevalence rate, physically active individuals, by year and geographic area, ages 12+, 2007/08 to 2013/14
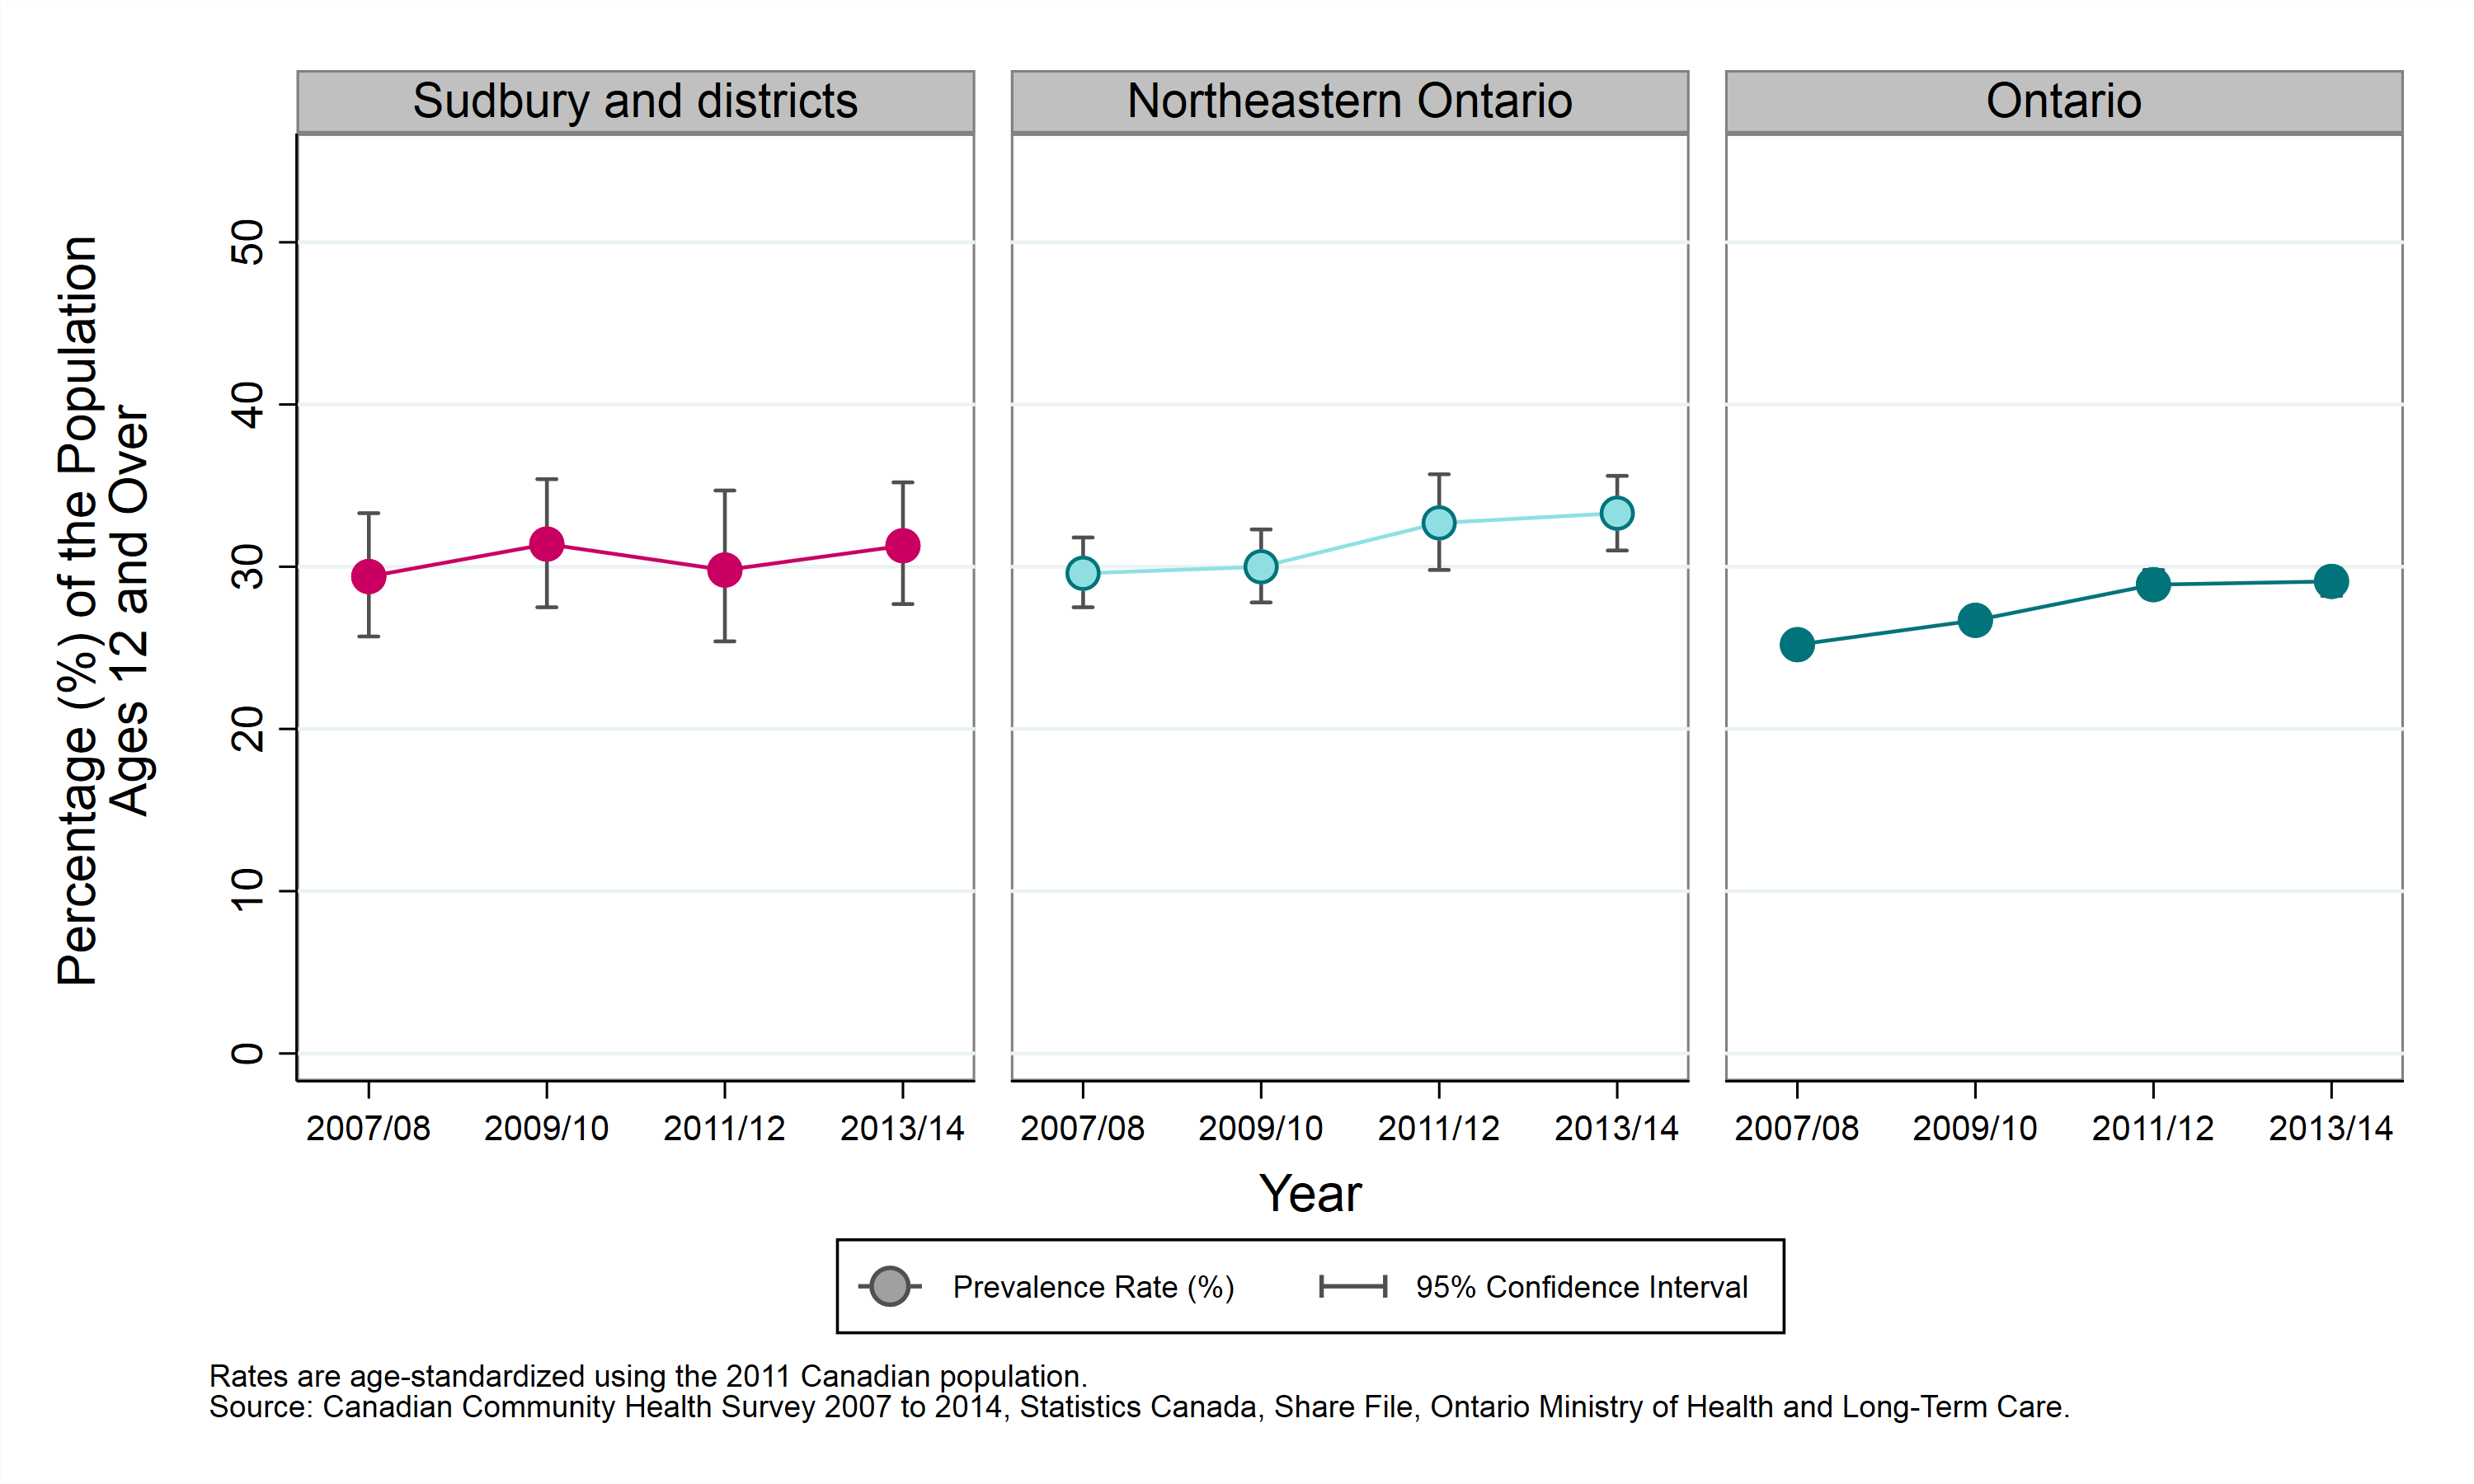
Table: Age-standardized prevalence rate, physically active individuals, by year and geographic area, ages 12+, 2007/08 to 2013/14
| Geographic Region | Prevalence Rate, 2007 to 2008 | Prevalence Rate, 2009 to 2010 | Prevalence Rate, 2011 to 2012 | Prevalence Rate, 2013 to 2014 |
|---|---|---|---|---|
| Sudbury and districts | 29.4% (CI: 25.7% to 33.3%) | 31.4% (CI: 27.5% to 35.4%) | 29.8% (CI: 25.4% to 34.7%) | 31.3% (CI: 27.7% to 35.2%) |
| Northeastern Ontario | 29.6% (CI: 27.5% to 31.8%) | 30.0% (CI: 27.8% to 32.3%) | 32.7% (CI: 29.8% to 35.7%) | 33.3% (CI: 31.0% to 35.6%) |
| Ontario | 25.2% (CI: 24.5% to 25.9%) | 26.7% (CI: 26.0% to 27.4%) | 28.9% (CI: 28.1% to 29.8%) | 29.1% (CI: 28.2% to 29.9%) |
Physical activity by sex
Key Findings
- Between 2011 and 2014, survey results indicated that there was no statistical difference in the rate of physical activity between males and females aged 12 years and older in Sudbury and districts.
- Between 2007 to 2010 and 2011 to 2014, the rate of physically active individuals in Sudbury and districts has not varied significantly in either males or females.
Notes:
- Rates are age-standardized using the 2011 Canadian population.
- Rates are for the population aged 12 years and older.
- Data source: Canadian Community Health Survey (CCHS), 2007 to 2014, Statistics Canada, Share File, Ontario Ministry of Health and Long-Term Care.
Figure: Age-standardized prevalence rate, physically active, by year and sex, ages 12+, 2007 to 2010 and 2011 to 2014
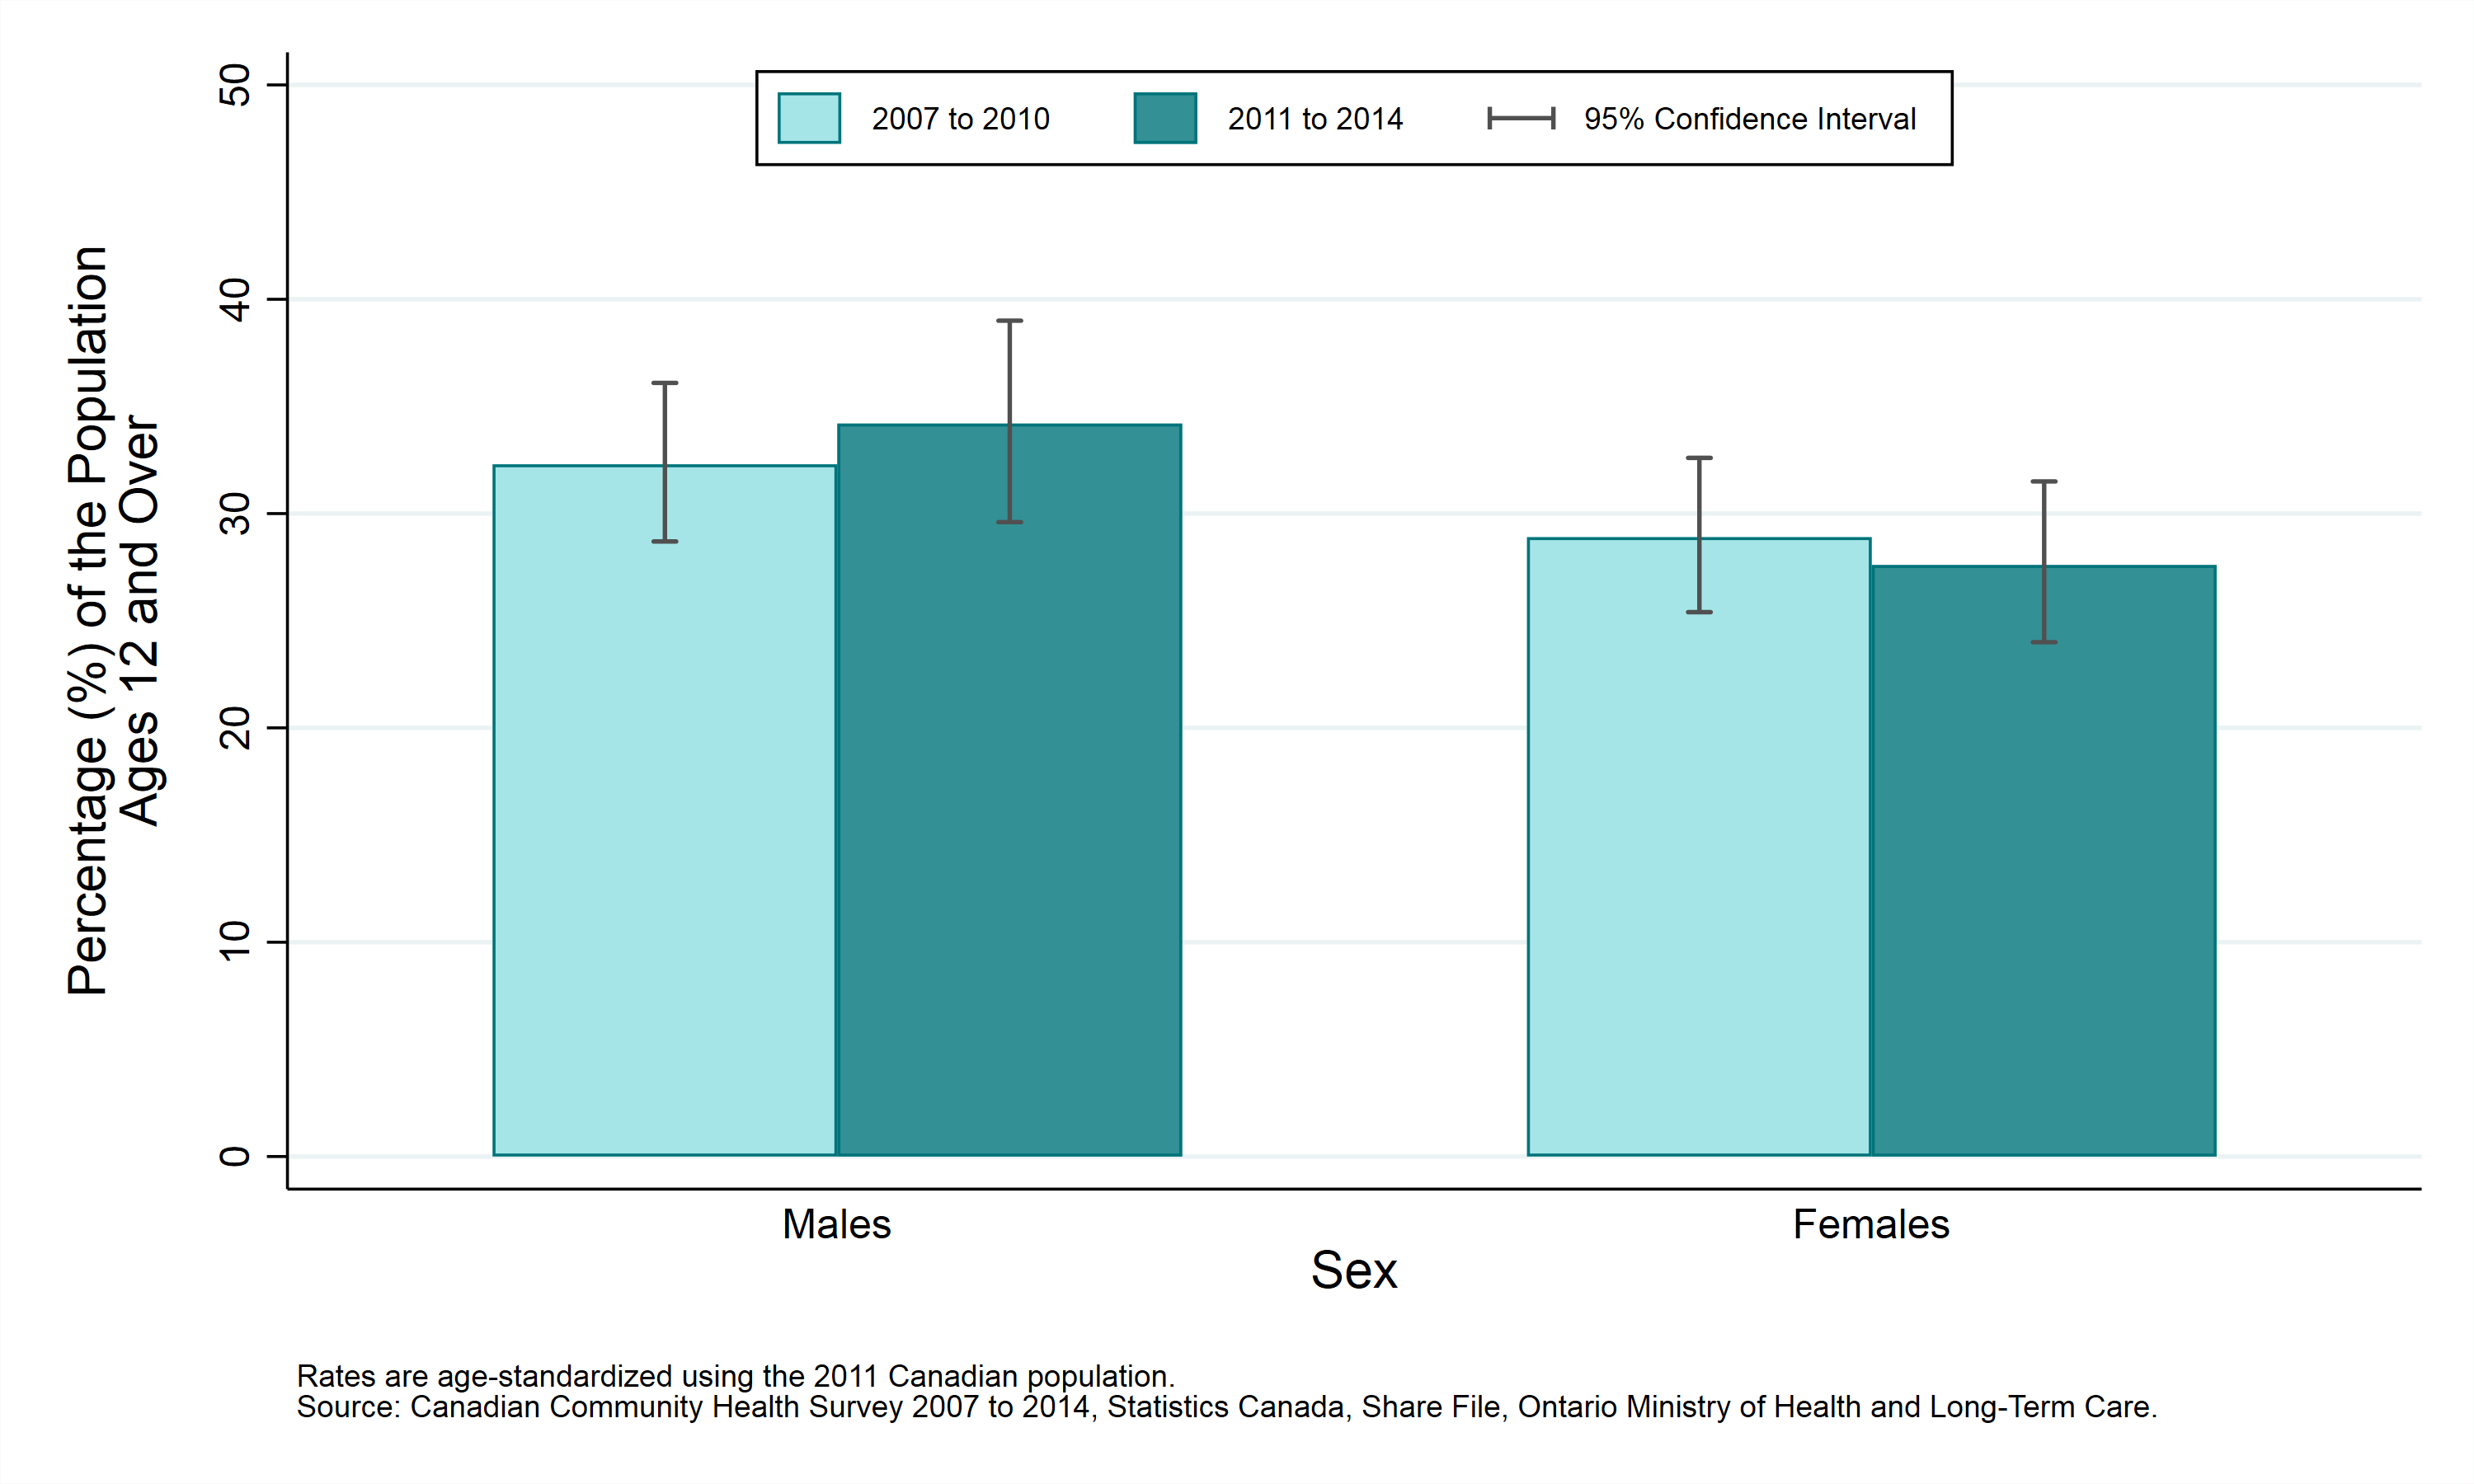
Table: Age-standardized prevalence rate, physically active, by year and sex, ages 12+, 2007 to 2010 and 2011 to 2014
| Sex | Prevalence Rate, 2007 to 2010 | Prevalence Rate, 2011 to 2014 |
|---|---|---|
| Males | 32.3% (CI: 28.7% to 36.1%) | 34.2% (CI: 29.6% to 39.0%) |
| Females | 28.9% (CI: 25.4% to 32.6%) | 27.6% (CI: 24.0% to 31.5%) |
Physical Activity by age group
Key Findings
- Between 2011 and 2014, survey results indicated that 54% of youth aged 12 to 19 years in Sudbury and districts were physically active, which is significantly higher than any other age group.
- Reported rates of physically active individuals have not varied significantly between 2007 to 2010 and 2011 to 2014 within any age group.
Notes:
- Rates are for the population aged 12 years and older.
- Data source: Canadian Community Health Survey (CCHS), 2007 to 2014, Statistics Canada, Share File, Ontario Ministry of Health and Long-Term Care.
Figure: Prevalence rate, physically active individuals, by year and age group, ages 12+, 2007 to 2010 and 2011 to 2014
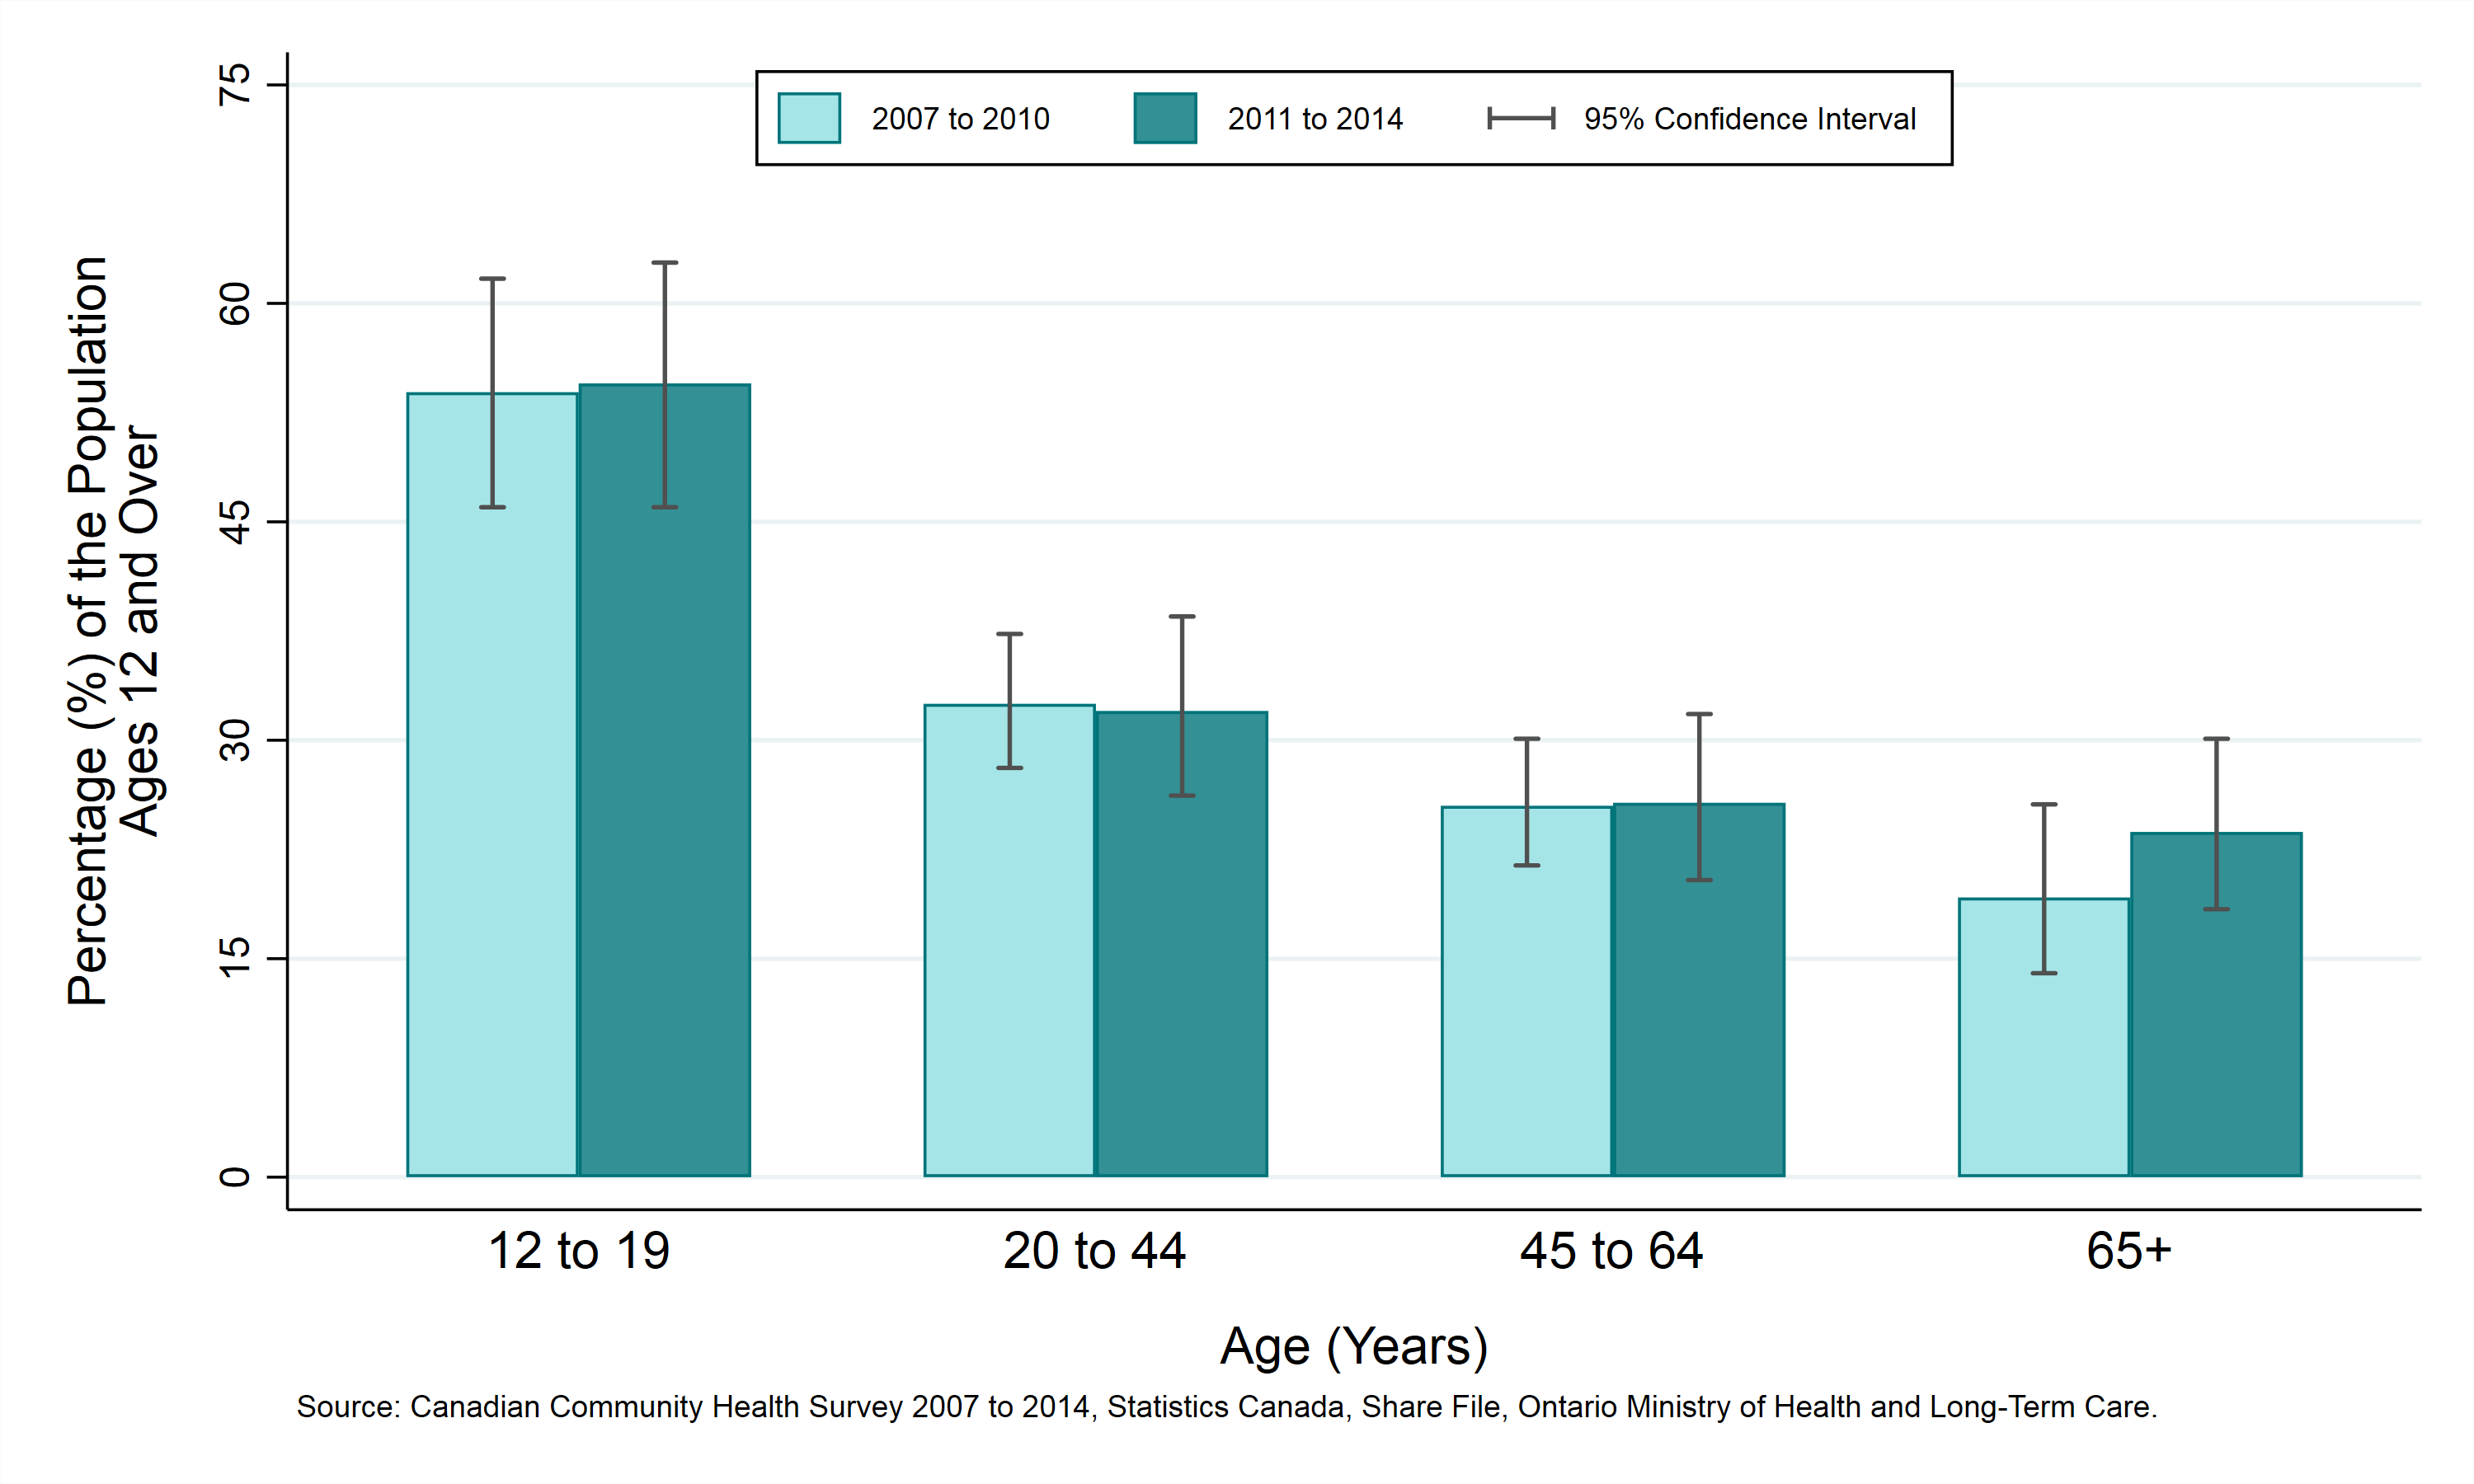
Table: Prevalence rate, physically active individuals, by year and age group, ages 12+, 2007 to 2010 and 2011 to 2014
| Age (Years) | Prevalence Rate, 2007 to 2010 | Prevalence Rate, 2011 to 2014 |
|---|---|---|
| 12 to 19 | 53.9% (CI: 46.0% to 61.7%) | 54.5% (CI: 46.0% to 62.8%) |
| 20 to 44 | 32.5% (CI: 28.1% to 37.3%) | 32.0% (CI: 26.2% to 38.5%) |
| 45 to 64 | 25.5% (CI: 21.4% to 30.1%) | 25.7% (CI: 20.4% to 31.8%) |
| 65+ | 19.2% (CI: 14.0% to 25.6%) | 23.7% (CI: 18.4% to 30.1%) |
Physical activity by household income
Key Findings:
- Between 2011 and 2014, survey results indicated that individuals in the highest household income quintile in Sudbury and districts had the highest proportion of individuals who were physically active. This was significantly higher than the rates in the lowest and middle income quintiles.
- Reported rates of physically active individuals have not varied significantly between 2007 to 2010 and 2011 to 2014 within any of the household income quintile groups.
Notes:
- In this analysis, individuals are divided into “income quintiles”, or 5 groups of roughly equal size based on their reported household income. The groups are ranked, so that Quintile 1 represents the 20% of the population with the lowest incomes, and Quintile 5 represents the 20% with the highest incomes.
- Rates are age-standardized using the 2011 Canadian population.
- Rates are for the population aged 12 years and older.
- Data source: Canadian Community Health Survey (CCHS), 2007 to 2014, Statistics Canada, Share File, Ontario Ministry of Health and Long-Term Care.
Figure: Age-standardized prevalence rate, physically active individuals, by year and household income, ages 12+, 2007 to 2010 and 2011 to 2014
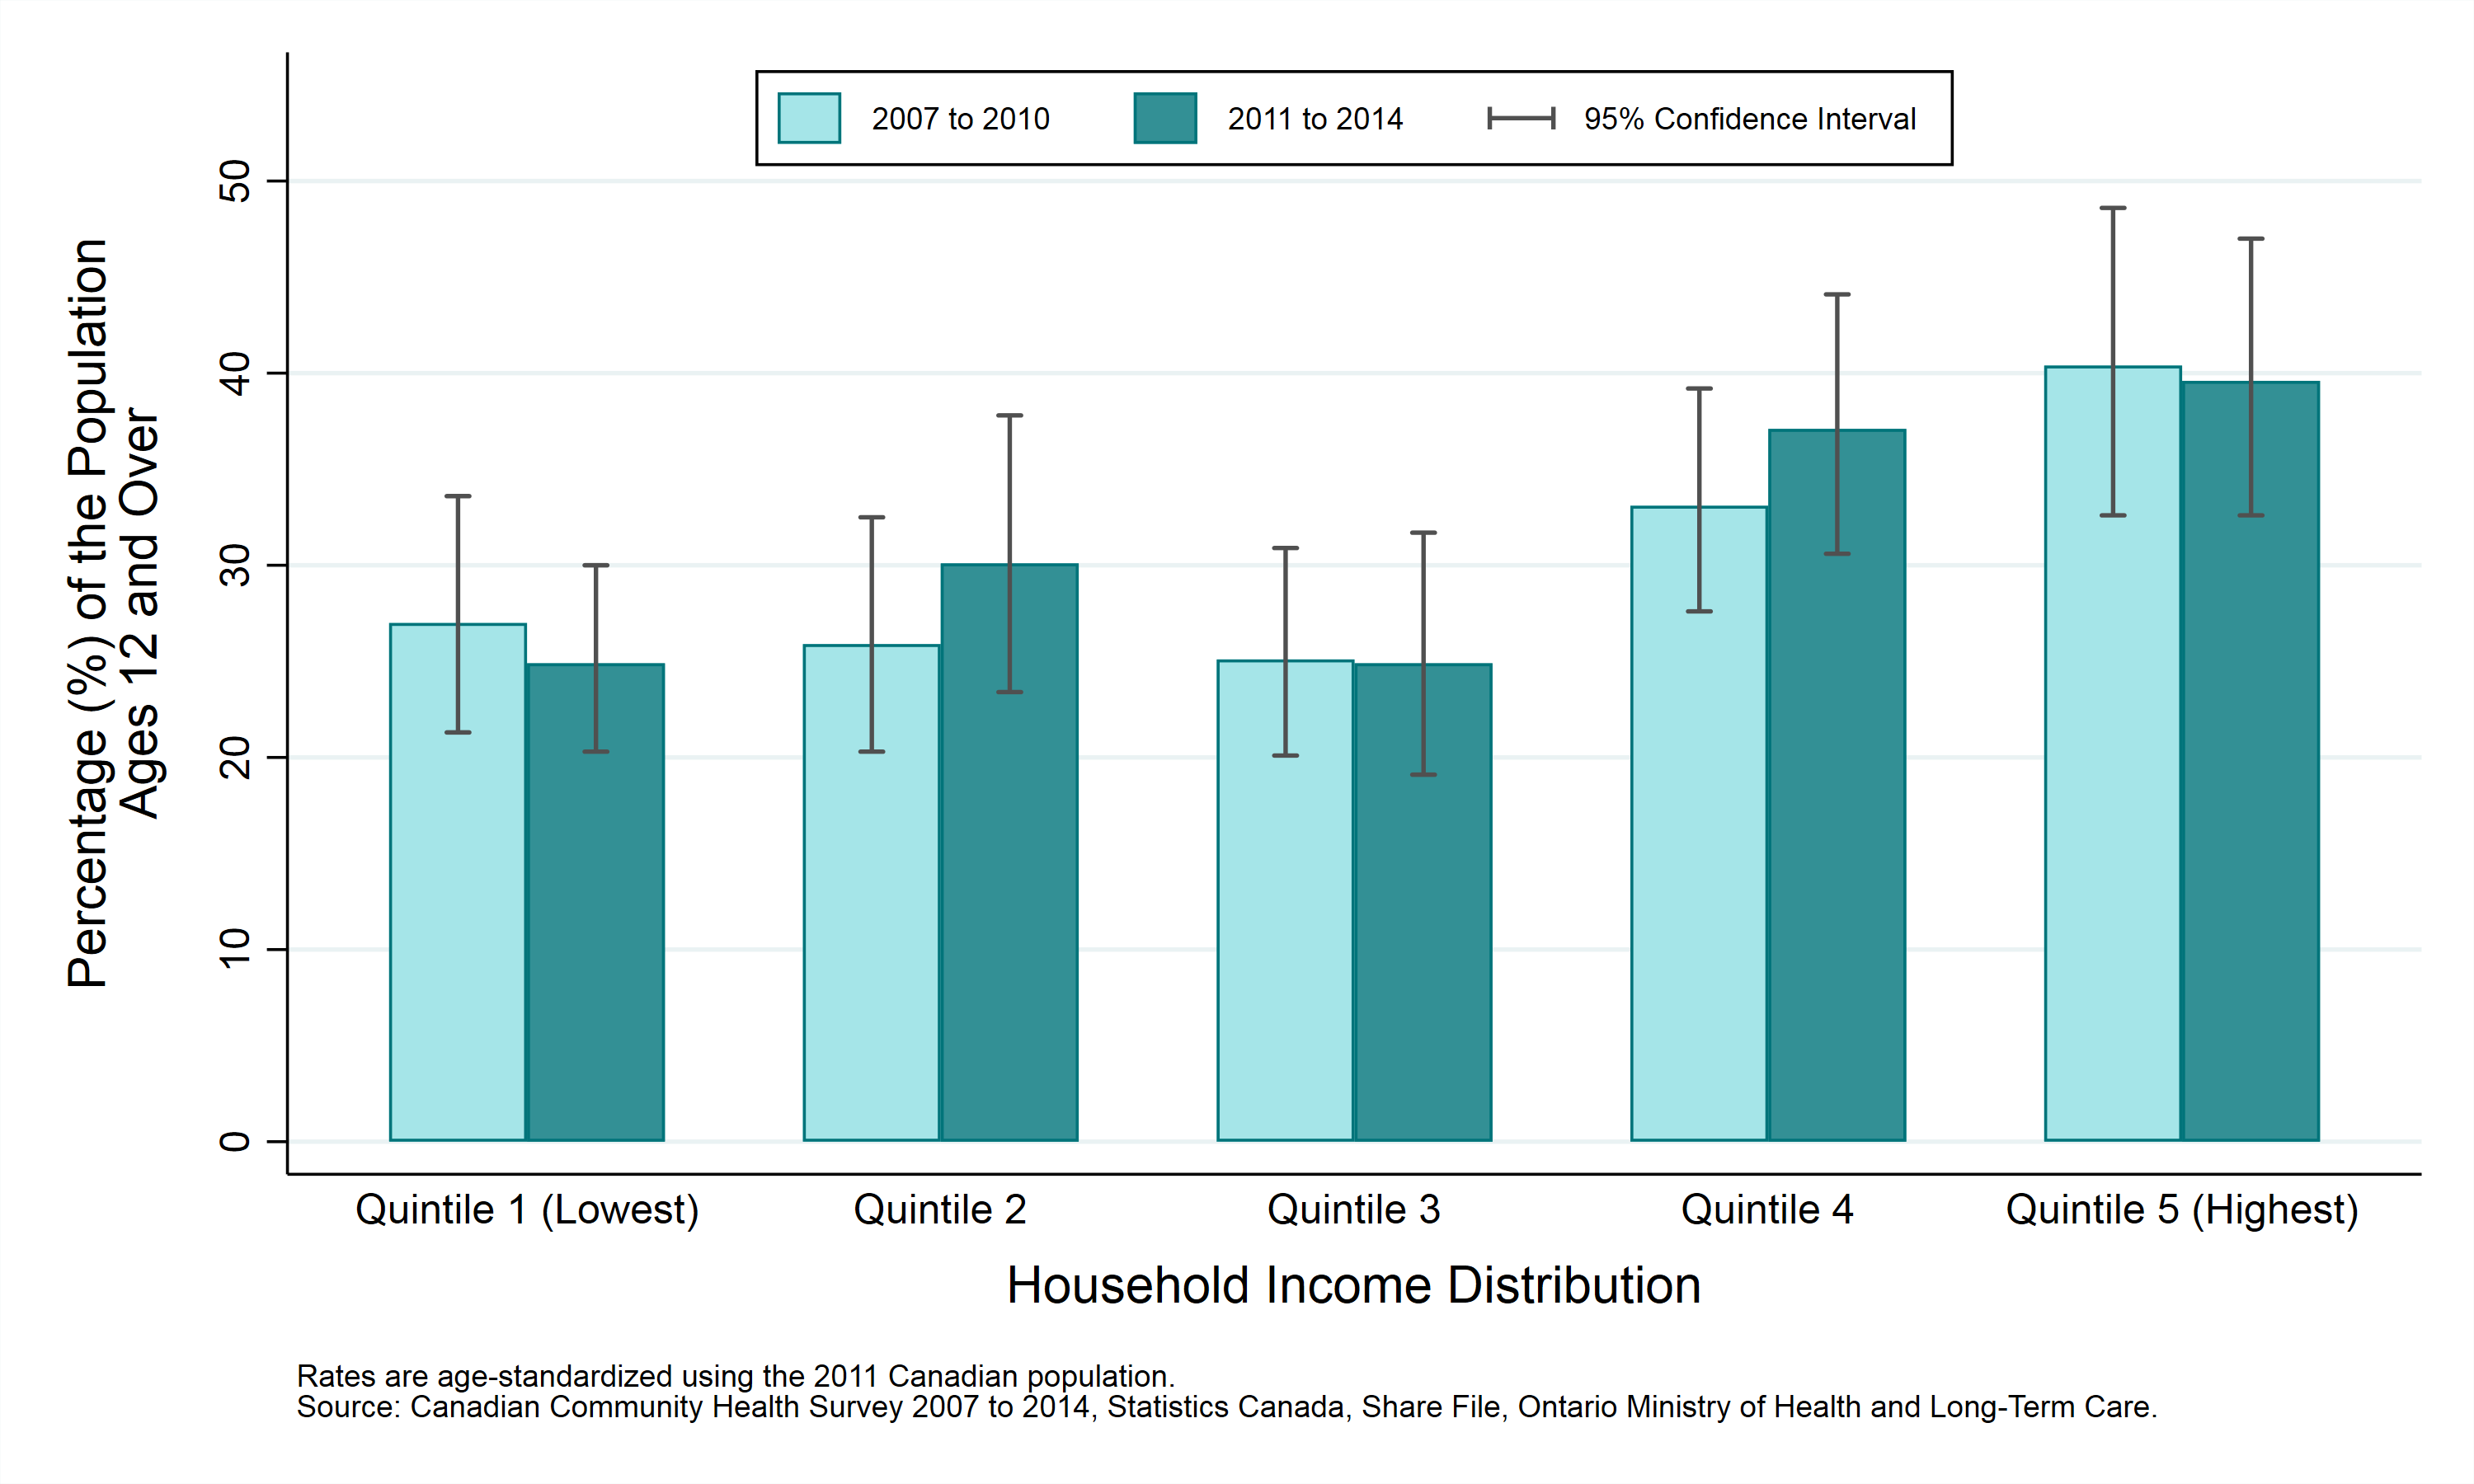
Table: Age-standardized prevalence rate, physically active individuals, by year and household income, ages 12+, 2007 to 2010 and 2011 to 2014
| Household Income Distribution | Prevalence Rate, 2007 to 2010 | Prevalence Rate, 2011 to 2014 |
|---|---|---|
| Quintile 1 (Lowest) | 27.0% (CI: 21.3% to 33.6%) | 24.9% (CI: 20.3% to 30.0%) |
| Quintile 2 | 25.9% (CI: 20.3% to 32.5%) | 30.1% (CI: 23.4% to 37.8%) |
| Quintile 3 | 25.1% (CI: 20.1% to 30.9%) | 24.9% (CI: 19.1% to 31.7%) |
| Quintile 4 | 33.1% (CI: 27.6% to 39.2%) | 37.1% (CI: 30.6% to 44.1%) |
| Quintile 5 (Highest) | 40.4% (CI: 32.6% to 48.6%) | 39.6% (CI: 32.6% to 47.0%) |
Physical activity by education
Key Findings
- Between 2011 and 2014, survey results indicated that 39% of individuals with an education level of university degree or higher in Sudbury and districts were physically active. This was significantly higher than those with other levels of education.
- Reported rates of physically active individuals have not varied significantly between 2007 to 2010 and 2011 to 2014 within any of the education level groups.
Notes:
- Rates are age-standardized using the 2011 Canadian population.
- Rates are for the population aged 12 years and older.
- Data source: Canadian Community Health Survey (CCHS), 2007 to 2014, Statistics Canada, Share File, Ontario Ministry of Health and Long-Term Care.
Figure: Age-standardized prevalence rate, physically active individuals, by year and education level, ages 12+, 2007 to 2010 and 2011 to 2014

Table: Age-standardized prevalence rate, physically active individuals, by year and education level, ages 12+, 2007 to 2010 and 2011 to 2014
Note: Numbers followed by the letter “E” are to be interpreted with caution due to high sampling variability.
| Education | Prevalence Rate, 2007 to 2010 | Prevalence Rate, 2011 to 2014 |
|---|---|---|
| < Highschool Diploma | 15.0% E (CI: 8.7% to 24.6%) | 18.4% E (CI: 10.4% to 30.3%) |
| Highschool Diploma | 32.6% (CI: 25.7% to 40.3%) | 22.9% (CI: 16.9% to 30.2%) |
| Trade, College or University Diploma or Certificate | 25.3% (CI: 21.8% to 29.1%) | 24.9% (CI: 20.4% to 29.9%) |
| University Degree | 35.8% (CI: 27.4% to 45.1%) | 39.2% (CI: 31.3% to 47.8%) |
Physical activity by first official language spoken
Key Findings:
- Between 2011 and 2014, survey results indicated that there was no statistical difference in the rate of physical activity among official language groups in Sudbury and districts.
- Reported rates of physically active individuals have not varied significantly between 2007 to 2010 and 2011 to 2014 within either official language group.
Notes:
- Canada’s official languages are French and English. An individual’s “first official language spoken” is determined using their answers to a number of questions about the languages they speak. A small percentage of people are classified as having both French and English as their “first” official language spoken. Such individuals are included here as French. People speaking neither French nor English are excluded from this analysis.
- Rates are age-standardized using the 2011 Canadian population.
- Rates are for the population aged 12 years and older.
- Data source: Canadian Community Health Survey (CCHS), 2007 to 2014, Statistics Canada, Share File, Ontario Ministry of Health and Long-Term Care.
Figure: Age-standardized prevalence rate, physically active individuals, by year and first official language spoken, ages 12+, 2007 to 2010 and 2011 to 2014
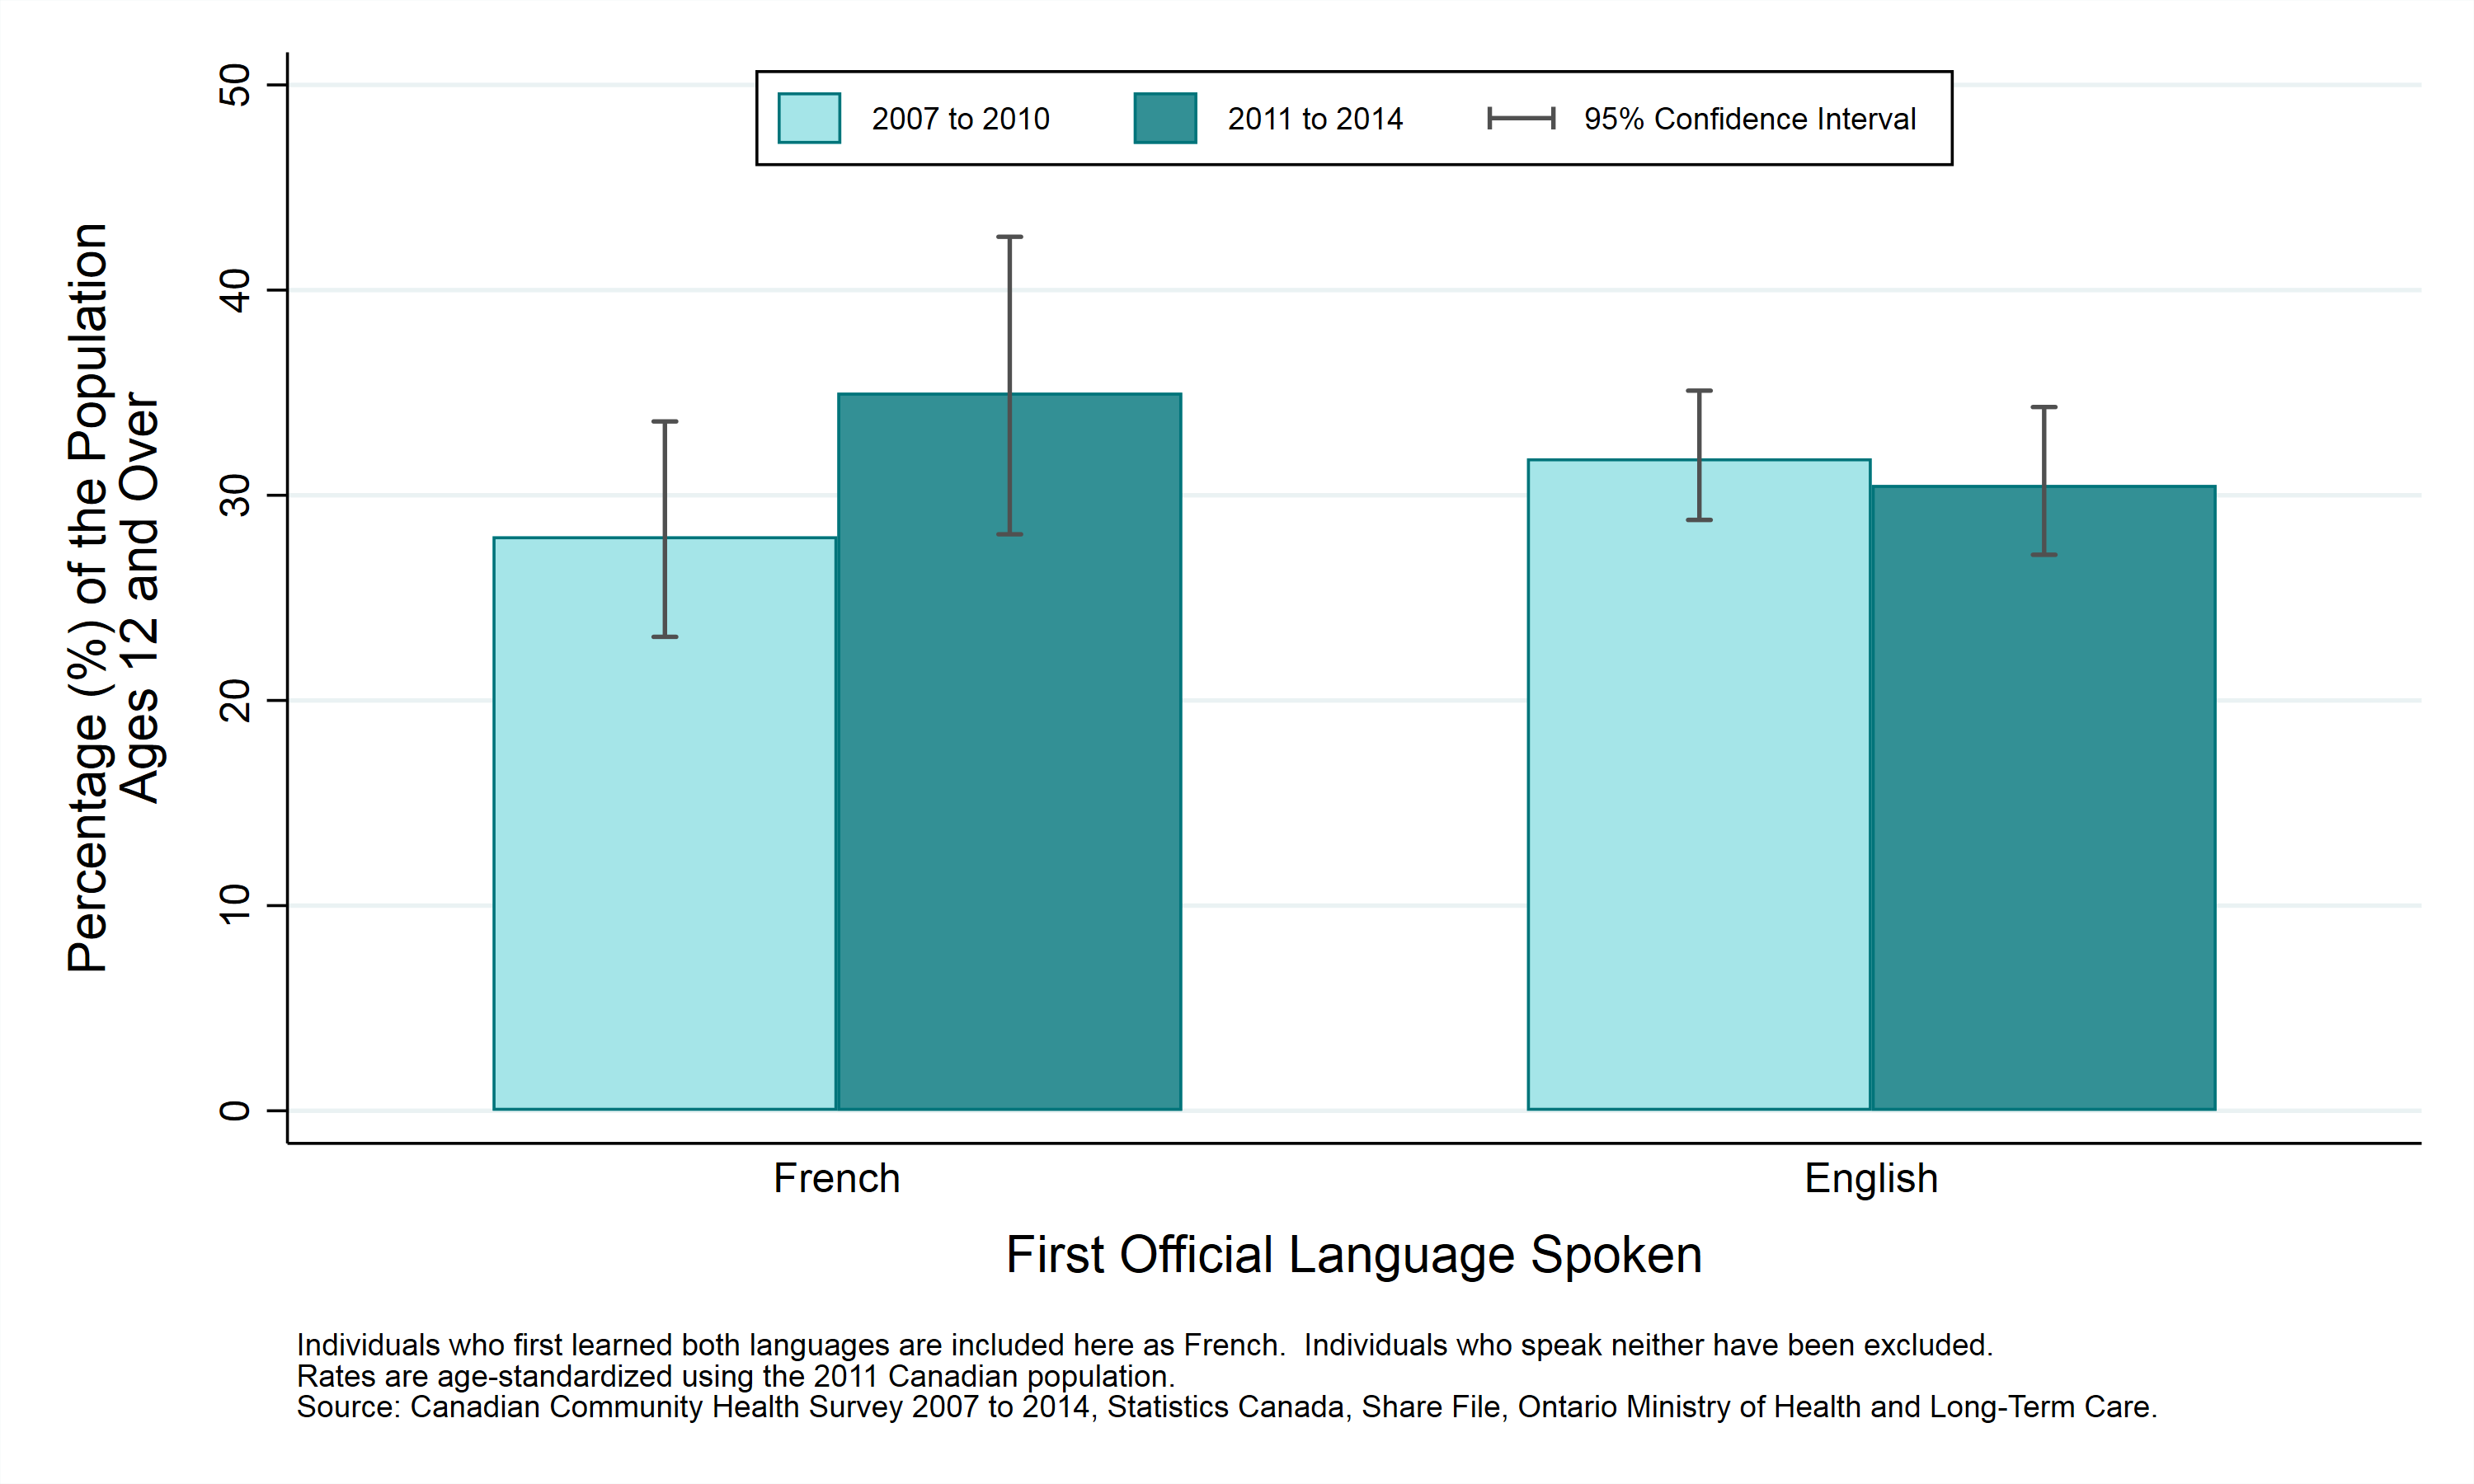
Table: Age-standardized prevalence rate, physically active individuals, by year and first official language spoken, ages 12+, 2007 to 2010 and 2011 to 2014
| First Official Language Spoken | Prevalence Rate, 2007 to 2010 | Prevalence Rate, 2011 to 2014 |
|---|---|---|
| French | 28.0% (CI: 23.1% to 33.6%) | 35.0% (CI: 28.1% to 42.6%) |
| English | 31.8% (CI: 28.8% to 35.1%) | 30.5% (CI: 27.1% to 34.3%) |
This item was last modified on August 22, 2018