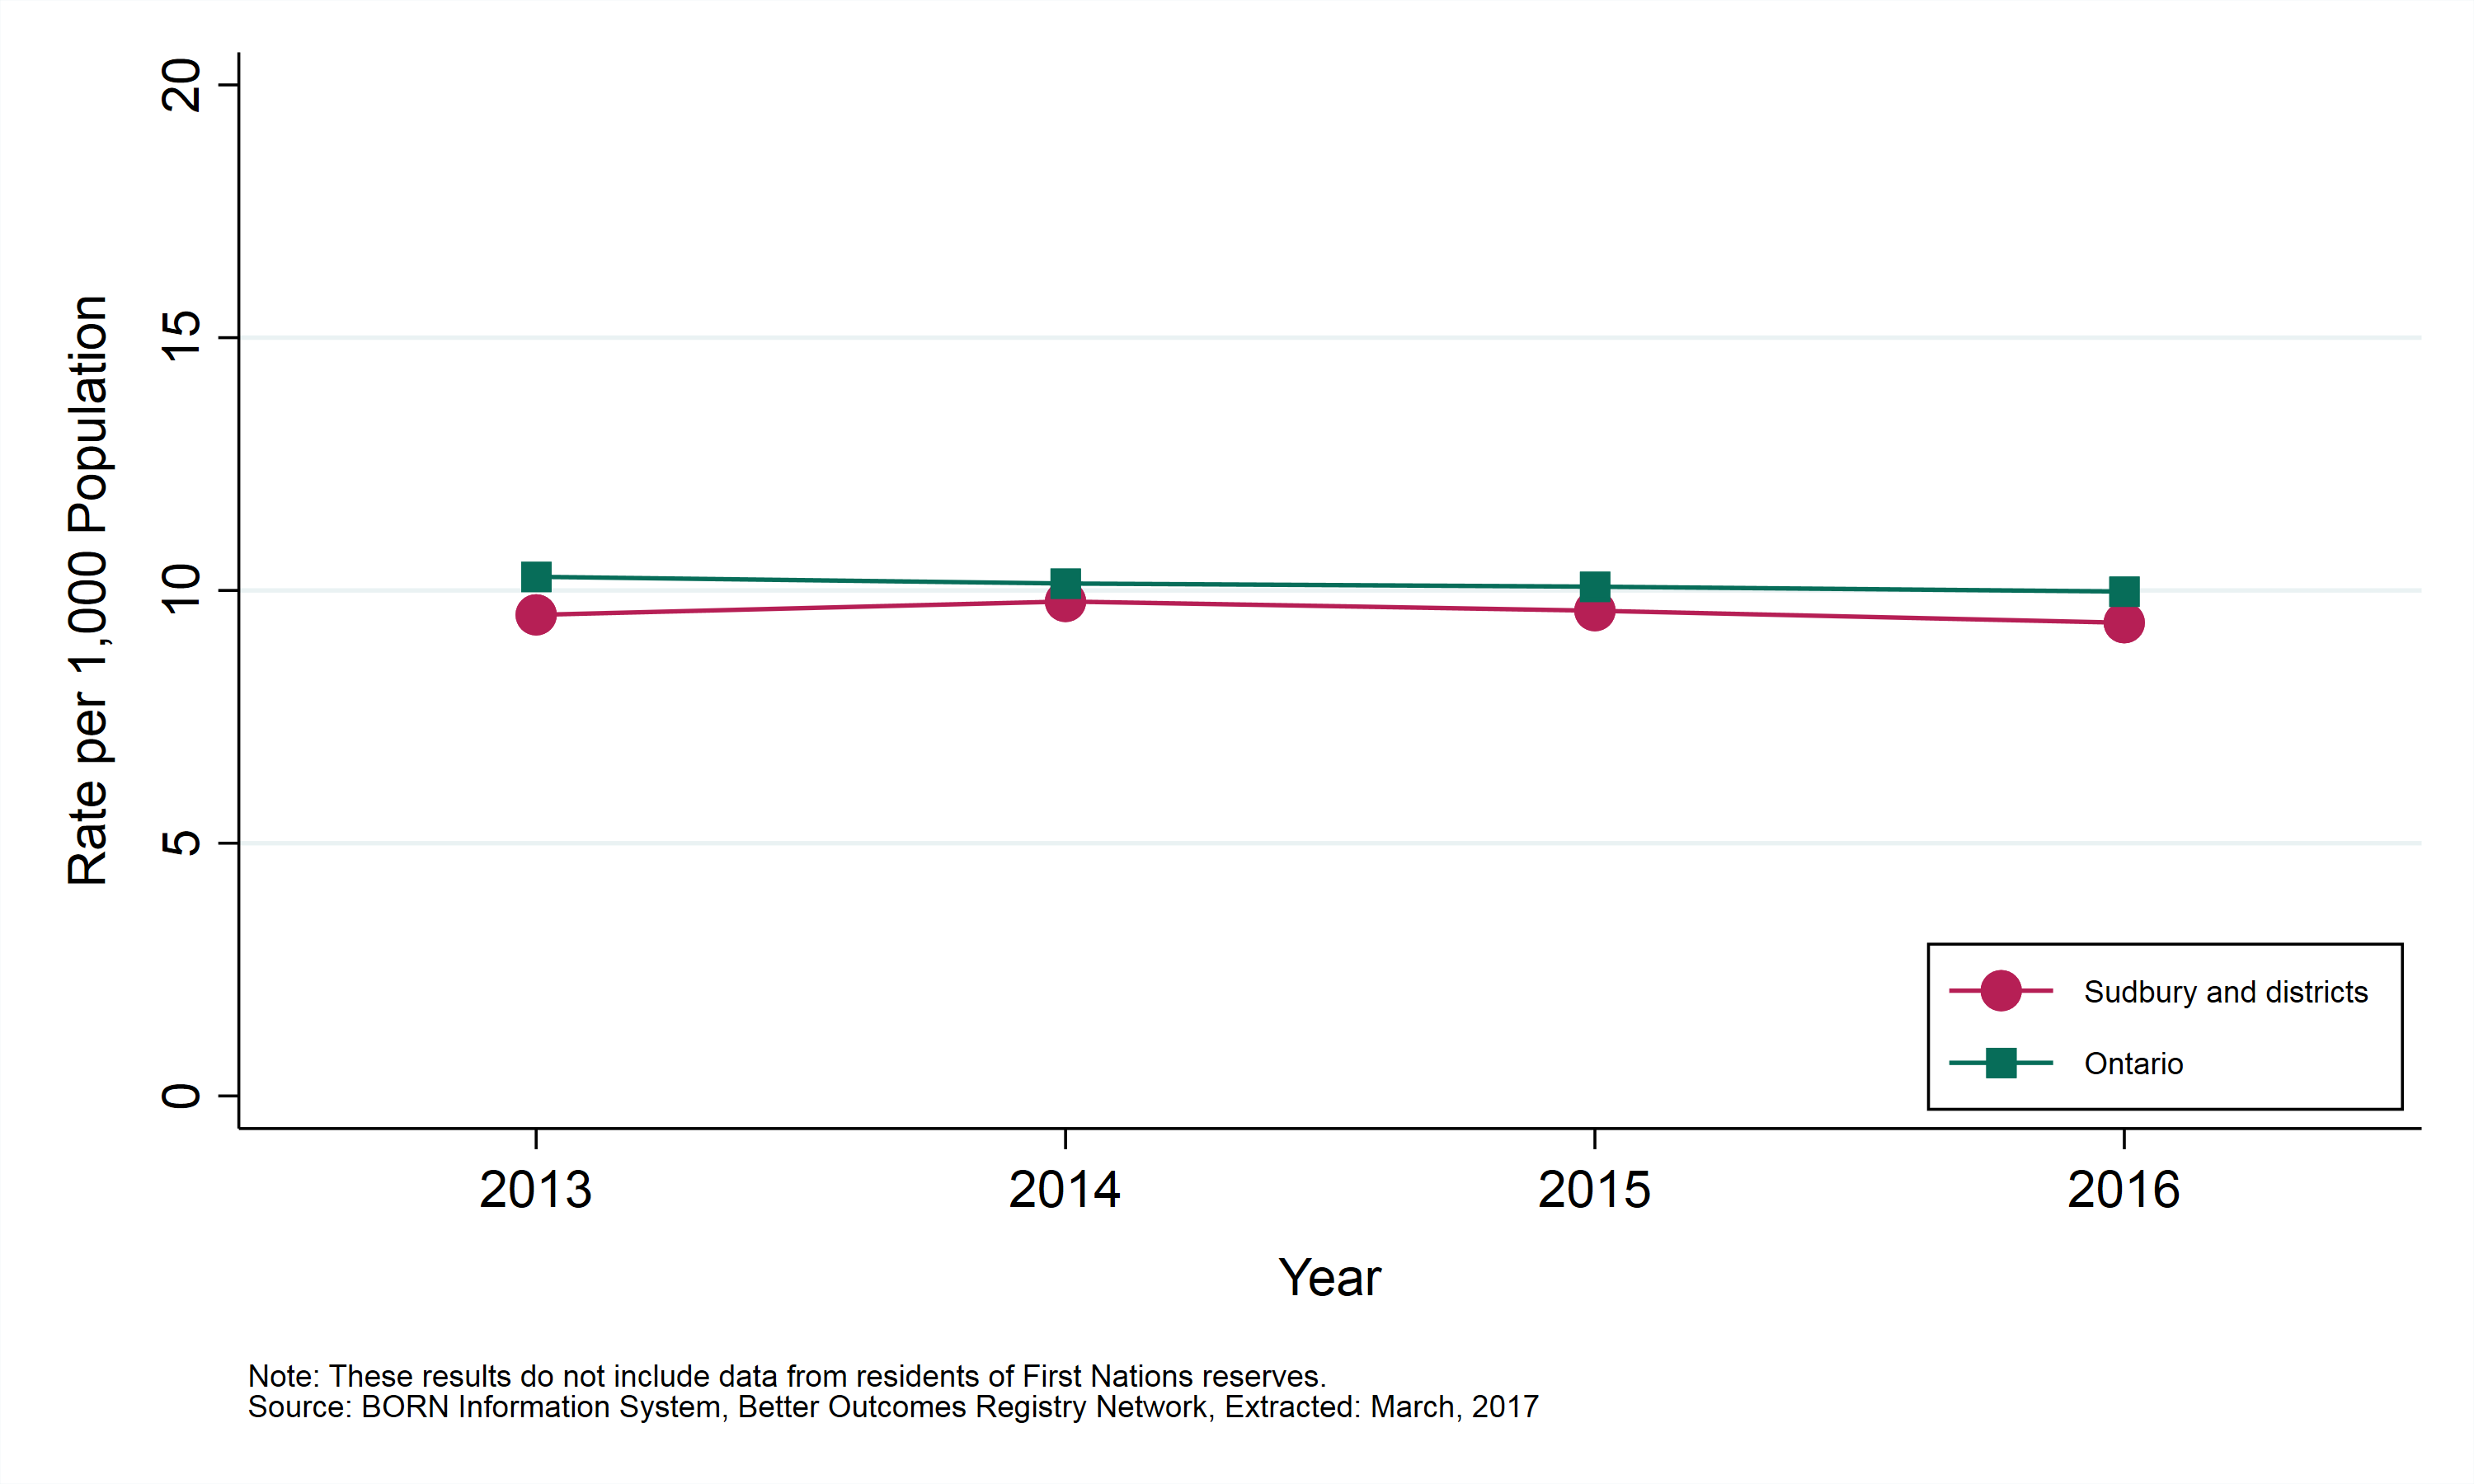
Live Births
The crude birth rate refers to the total number of live births per 1,000 people in the total population. This rate is strongly affected by the age structure of the population and it will be lower or higher depending on the number of women of childbearing age. Crude birth rate is an indicator of population growth and the reproductive capacity of a population.
Key findings:
- In Sudbury and districts, there were 1,866 live births in 2016.
- In 2016, the rate of live births in Sudbury and districts was 9.8 per 1,000 population.
- The annual rate of live births in Sudbury and districts has been similar to that in Ontario overall.
- Between 2013 and 2016, the rate of live births in Sudbury and districts has remained stable.
Notes:
- These results do not include data from residents of First Nations reserves.
- Data source: BORN Information System, Better Outcomes Registry Network. Extracted March, 2017.
Figure: Annual rate of live births, by geographic area, 2013 to 2016
 Table: Annual rate of live births, by geographic area, 2013 to 2016
| Geographic Area | 2013 | 2014 | 2015 | 2016 |
| Sudbury and districts | 9.8 | 10.1 | 9.9 | 9.7 |
| Ontario | 10.3 | 10.2 | 10.1 | 10.0 |
Table: Annual number of live births, by geographic area, 2013 to 2016
| Geographic Area | 2013 | 2014 | 2015 | 2016 |
| Sudbury and districts | 1,908 | 1,956 | 1,915 | 1,866 |
| Ontario | 139,251 | 138,749 | 139,012 | 139,537 |
Table: Average annual number of live births, by Greater Sudbury and Outlying Areas, 2014 to 2016
| Area | Total Live Births | Annual Average |
| Greater Sudbury | 4,847 | 1615.7 |
| Public Health District Office Areas | 826.0 | 275.3 |
| Total, Sudbury and districts | 5,673.0 | 1891.0 |
Table: Average annual number of live births, Espanola Area, by Municipality, 2014 to 2016
| Municipality | Total Live Births | Annual Average |
| Baldwin | 14 | 4.7 |
| Espanola | 111 | 37.0 |
| Nairn and Hyman | 10 | 3.3 |
| Sables-Spanish Rivers | 169 | 56.3 |
| Total | 304 | 101.3 |
Note: Due to small populations, there may be considerable variability in the number of events from year to year.
Table: Average annual number of live births, Manitoulin, by Municipality / Unorganized Area, 2014 to 2016
| Municipality / Unorganized Area | Total Live Births | Annual Average |
| Assiginack | 16 | 5.3 |
| Billings | 14 | 4.7 |
| Burpee and Mills | 6 | 2.0 |
| Central Manitoulin | 27 | 9.0 |
| Gore Bay | 16 | 5.3 |
| Manitoulin, Unorganized, West Part | <6 | - |
| Northeastern Manitoulin and the Islands | 77 | 25.7 |
| Tehkummah | 8 | 2.7 |
| Total (rounded to nearest 5) | 170 | 56.7 |
Note:
- Due to small populations, there may be considerable variability in the number of events from year to year. Counts less than 6 have been suppressed. As such, annual averages for those areas cannot be calculated, and the overall total has been rounded to the nearest 5.
Table: Average annual number of live births, Sudbury East, by Municipality, 2014 to 2016
| Municipality | Total Live Births | Annual Average |
| French River / Rivière des Français | 57 | 19.0 |
| Killarney | <6 | - |
| Markstay-Warren | 166 | 55.3 |
| St. Charles | 24 | 8.0 |
| Total (rounded to the nearest 5) | 250 | 83.3 |
Note:
- Due to small populations, there may be considerable variability in the number of events from year to year. Counts less than 6 have been suppressed. As such, annual averages for those areas cannot be calculated, and the overall total has been rounded to the nearest 5.
Table: Average annual number of live births, Sudbury North, by Municipality / Unorganized Area, 2014 to 2016
| Municipality / Unorganized Area | Total Live Births | Annual Average |
| Chapleau | 74 | 24.7 |
| Sudbury, Unorganized, North Part | 29 | 9.7 |
| Total | 103 | 34.3 |
Note:
- Due to small populations, there may be considerable variability in the number of events from year to year.
This item was last modified on October 26, 2018