Avoidable mortality
Avoidable mortality refers to deaths among persons less than 75 years of age from either a treatable or preventable cause.
Preventable causes are causes of death that can be avoided by prevention efforts, such as lifestyle changes like reducing smoking or excessive alcohol consumption, or by public health interventions, such as vaccinations and injury prevention programs. The social determinants of health—the social and economic factors that shape the conditions in which people are born, grow up, live and work—also impact health outcomes, including mortality. For more details please see the Opportunity for All Report.
Treatable causes are those causes of deaths that progress from illnesses or conditions that could have been avoided or delayed by screening, early detection, and appropriate treatment.
Avoidable mortality by geographic area
Key findings:
- In the Sudbury & District Health Unit (SDHU) area, there were 573 avoidable deaths in 2011.
- The avoidable mortality rate in the SDHU area was 243 deaths per 100,000 population in 2011.
- The SDHU area rate has consistently been similar to the northeastern Ontario rate and higher than the rate for Ontario.
- The SDHU area avoidable mortality rate decreased from 2002 to 2011.
Notes:
- Rates are age-standardized using the 2006 Canadian population.
- Data Source: Mortality Data and Population Estimates and Projections, Ontario Ministry of Health and Long-Term Care, IntelliHEALTH Ontario, Extracted April 2015.
Figure: Annual age-standardized avoidable mortality rate, by geographic area, 2002-2011
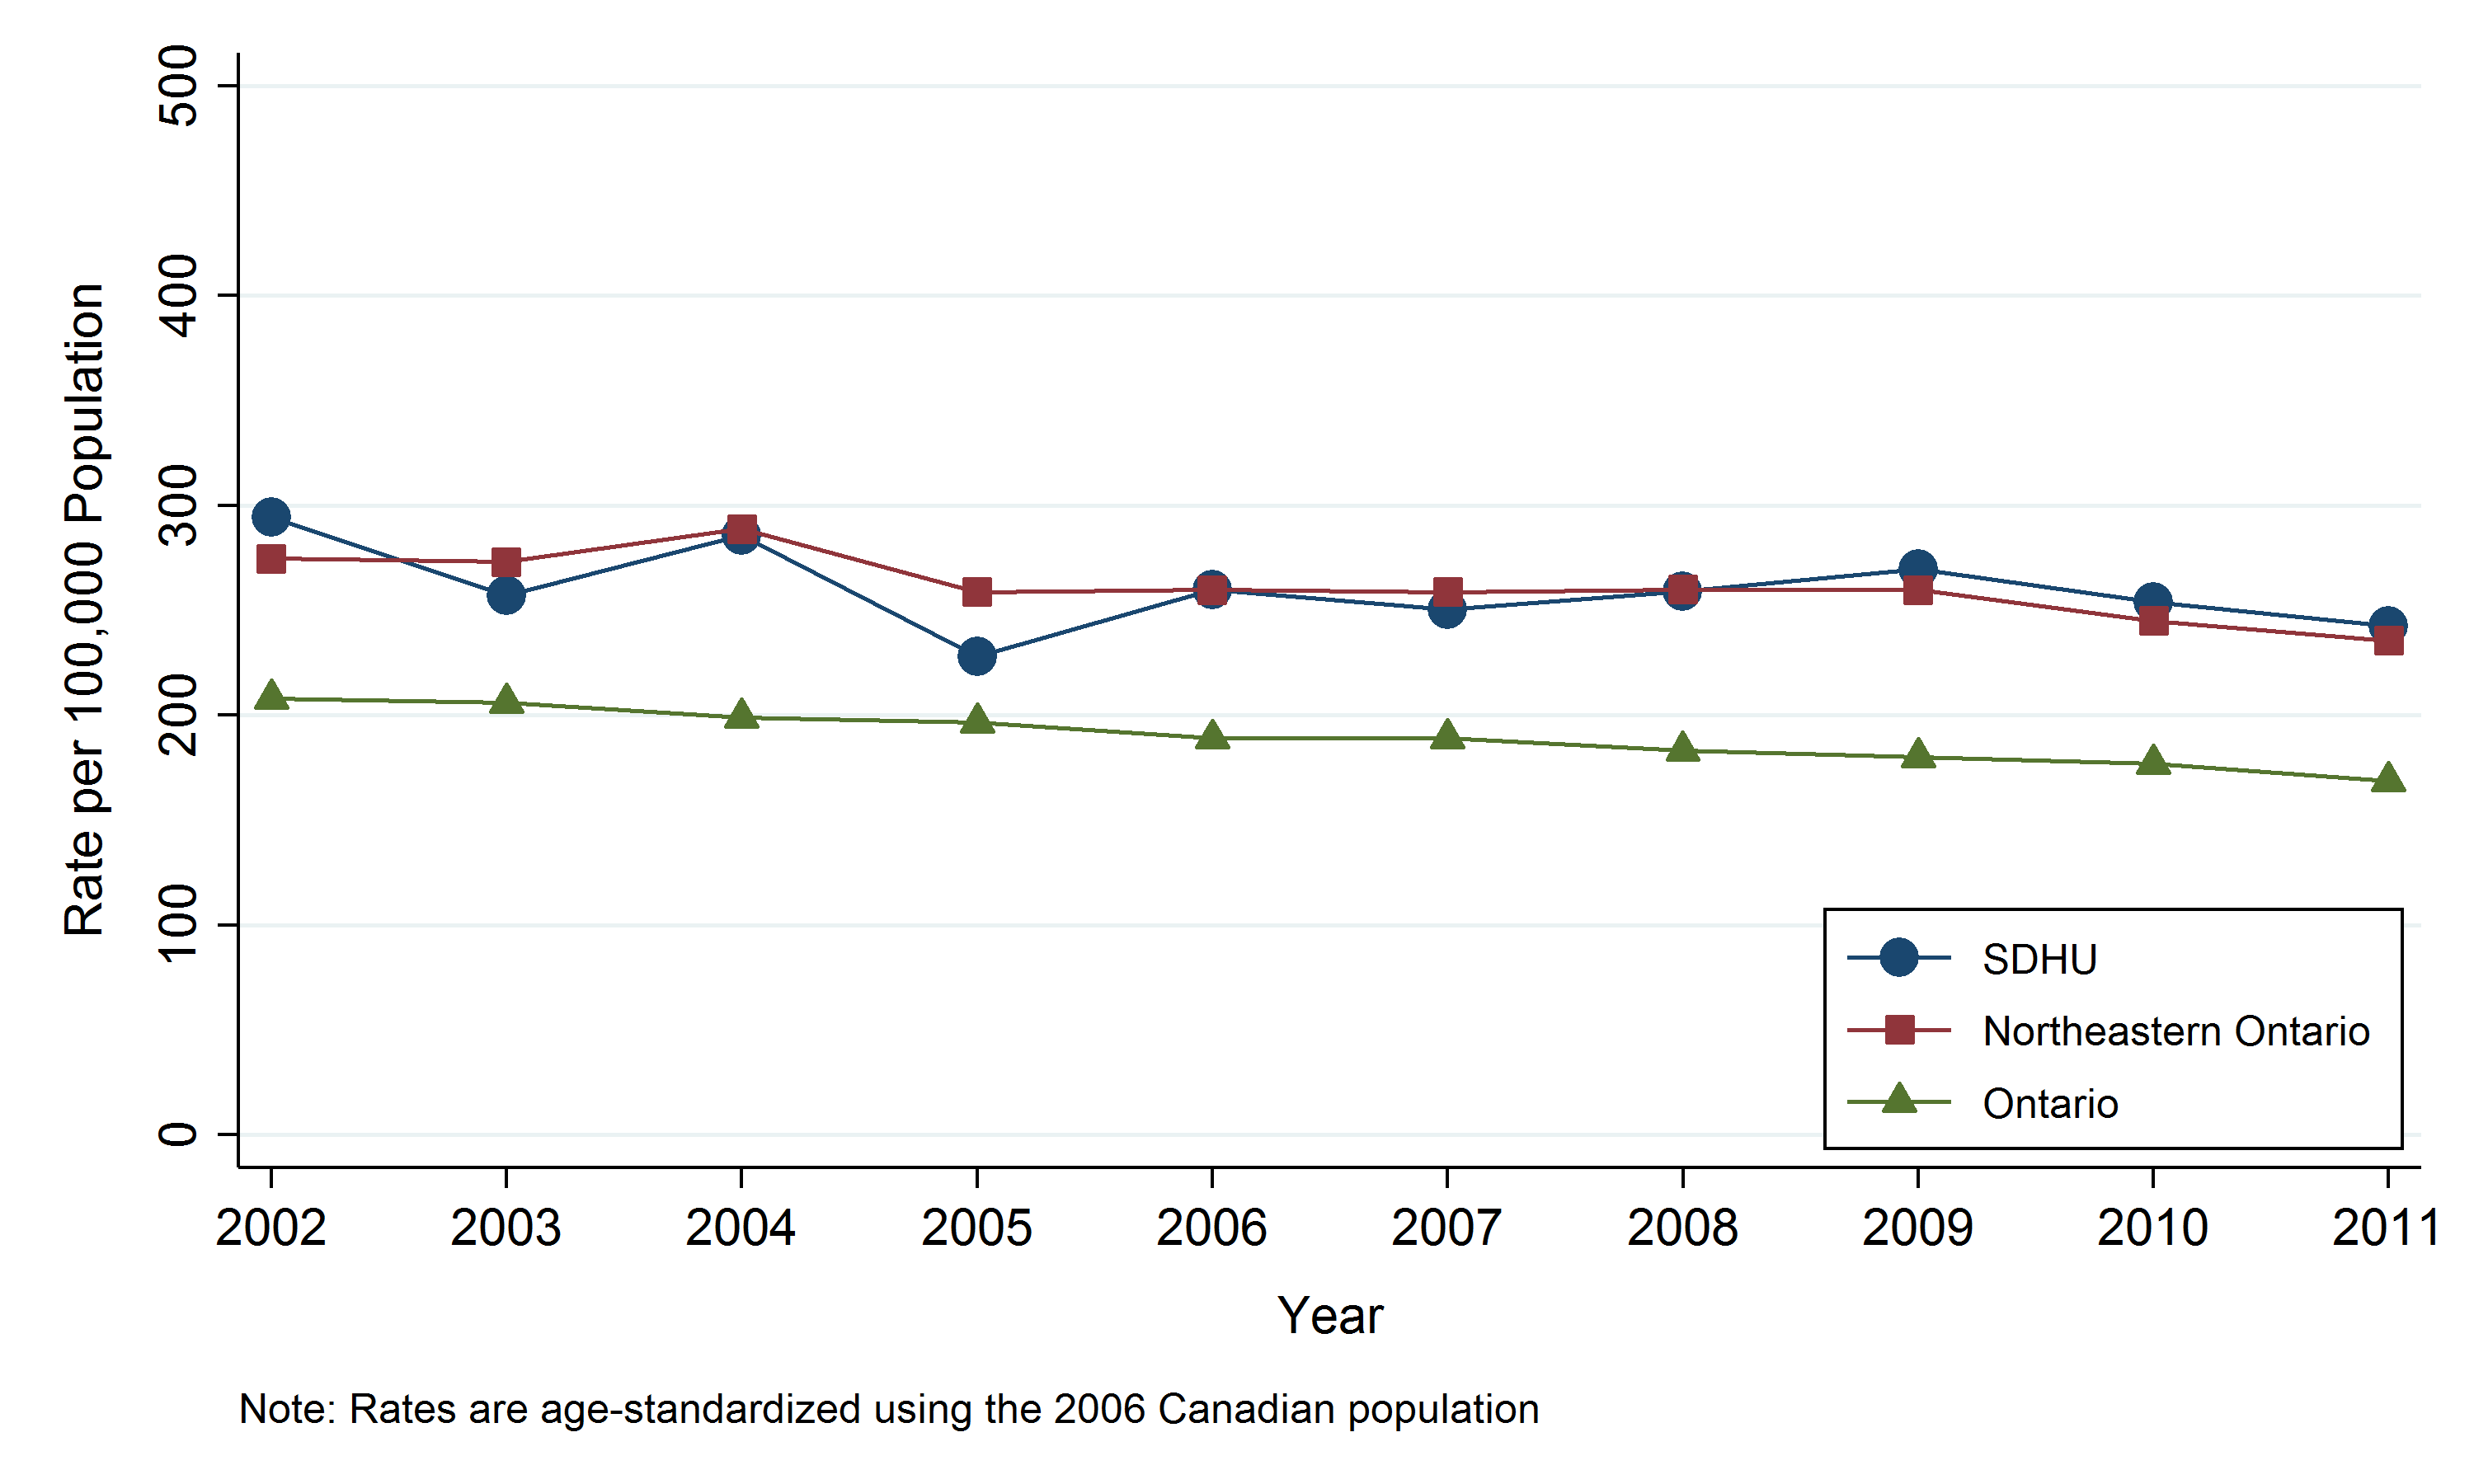
Table: Annual age-standardized avoidable mortality rate, by geographic area, 2002-2011
| Geographic Region | 2002 | 2003 | 2004 | 2005 | 2006 | 2007 | 2008 | 2009 | 2010 | 2011 |
|---|---|---|---|---|---|---|---|---|---|---|
| SDHU | 294.4 | 257.1 | 285.9 | 227.9 | 259.8 | 250.5 | 259 | 269.8 | 253.9 | 242.7 |
| Northeast | 274.6 | 273.2 | 288.7 | 258.8 | 259.8 | 258.9 | 260 | 259.8 | 245.1 | 235.7 |
| Ontario | 208 | 206.1 | 196.6 | 196.6 | 189 | 189.1 | 183.4 | 180 | 176.8 | 168.6 |
Table: Annual number of avoidable mortality cases, by geographic area, 2002-2011
| Geographic Region | 2002 | 2003 | 2004 | 2005 | 2006 | 2007 | 2008 | 2009 | 2010 | 2011 |
|---|---|---|---|---|---|---|---|---|---|---|
| SDHU | 610 | 542 | 610 | 490 | 567 | 557 | 586 | 616 | 590 | 573 |
| Northeast | 1719 | 1730 | 1853 | 1665 | 1697 | 1713 | 1759 | 1768 | 1684 | 1654 |
| Ontario | 23823 | 24067 | 23735 | 23884 | 23405 | 23970 | 23856 | 24044 | 24248 | 23752 |
Avoidable mortality by Greater Sudbury and outlying areas
Key findings:
- In Greater Sudbury there were 439 avoidable deaths and in the SDHU district office areas there were 134 avoidable deaths in 2011.
- In 2011, the avoidable mortality rate in Greater Sudbury was 281 per 100,000 population and in the SDHU district office areas it was 235 per 100,000 population.
- The rate in Greater Sudbury has decreased from 2002 to 2011, whereas the rate in the SDHU district office areas has fluctuated with no clear trend.
- The rate in Greater Sudbury has generally been lower than the rate in the SDHU district office areas.
Notes:
- Rates are age-standardized using the 2006 Canadian population.
- Data Source: Mortality Data and Population Estimates and Projections, Ontario Ministry of Health and Long-Term Care, IntelliHEALTH Ontario, Extracted April 2015.
Figure: Annual age-standardized avoidable mortality rate, Greater Sudbury vs. Sudbury & District Health Unit (SDHU) District Office areas, 2002-2011
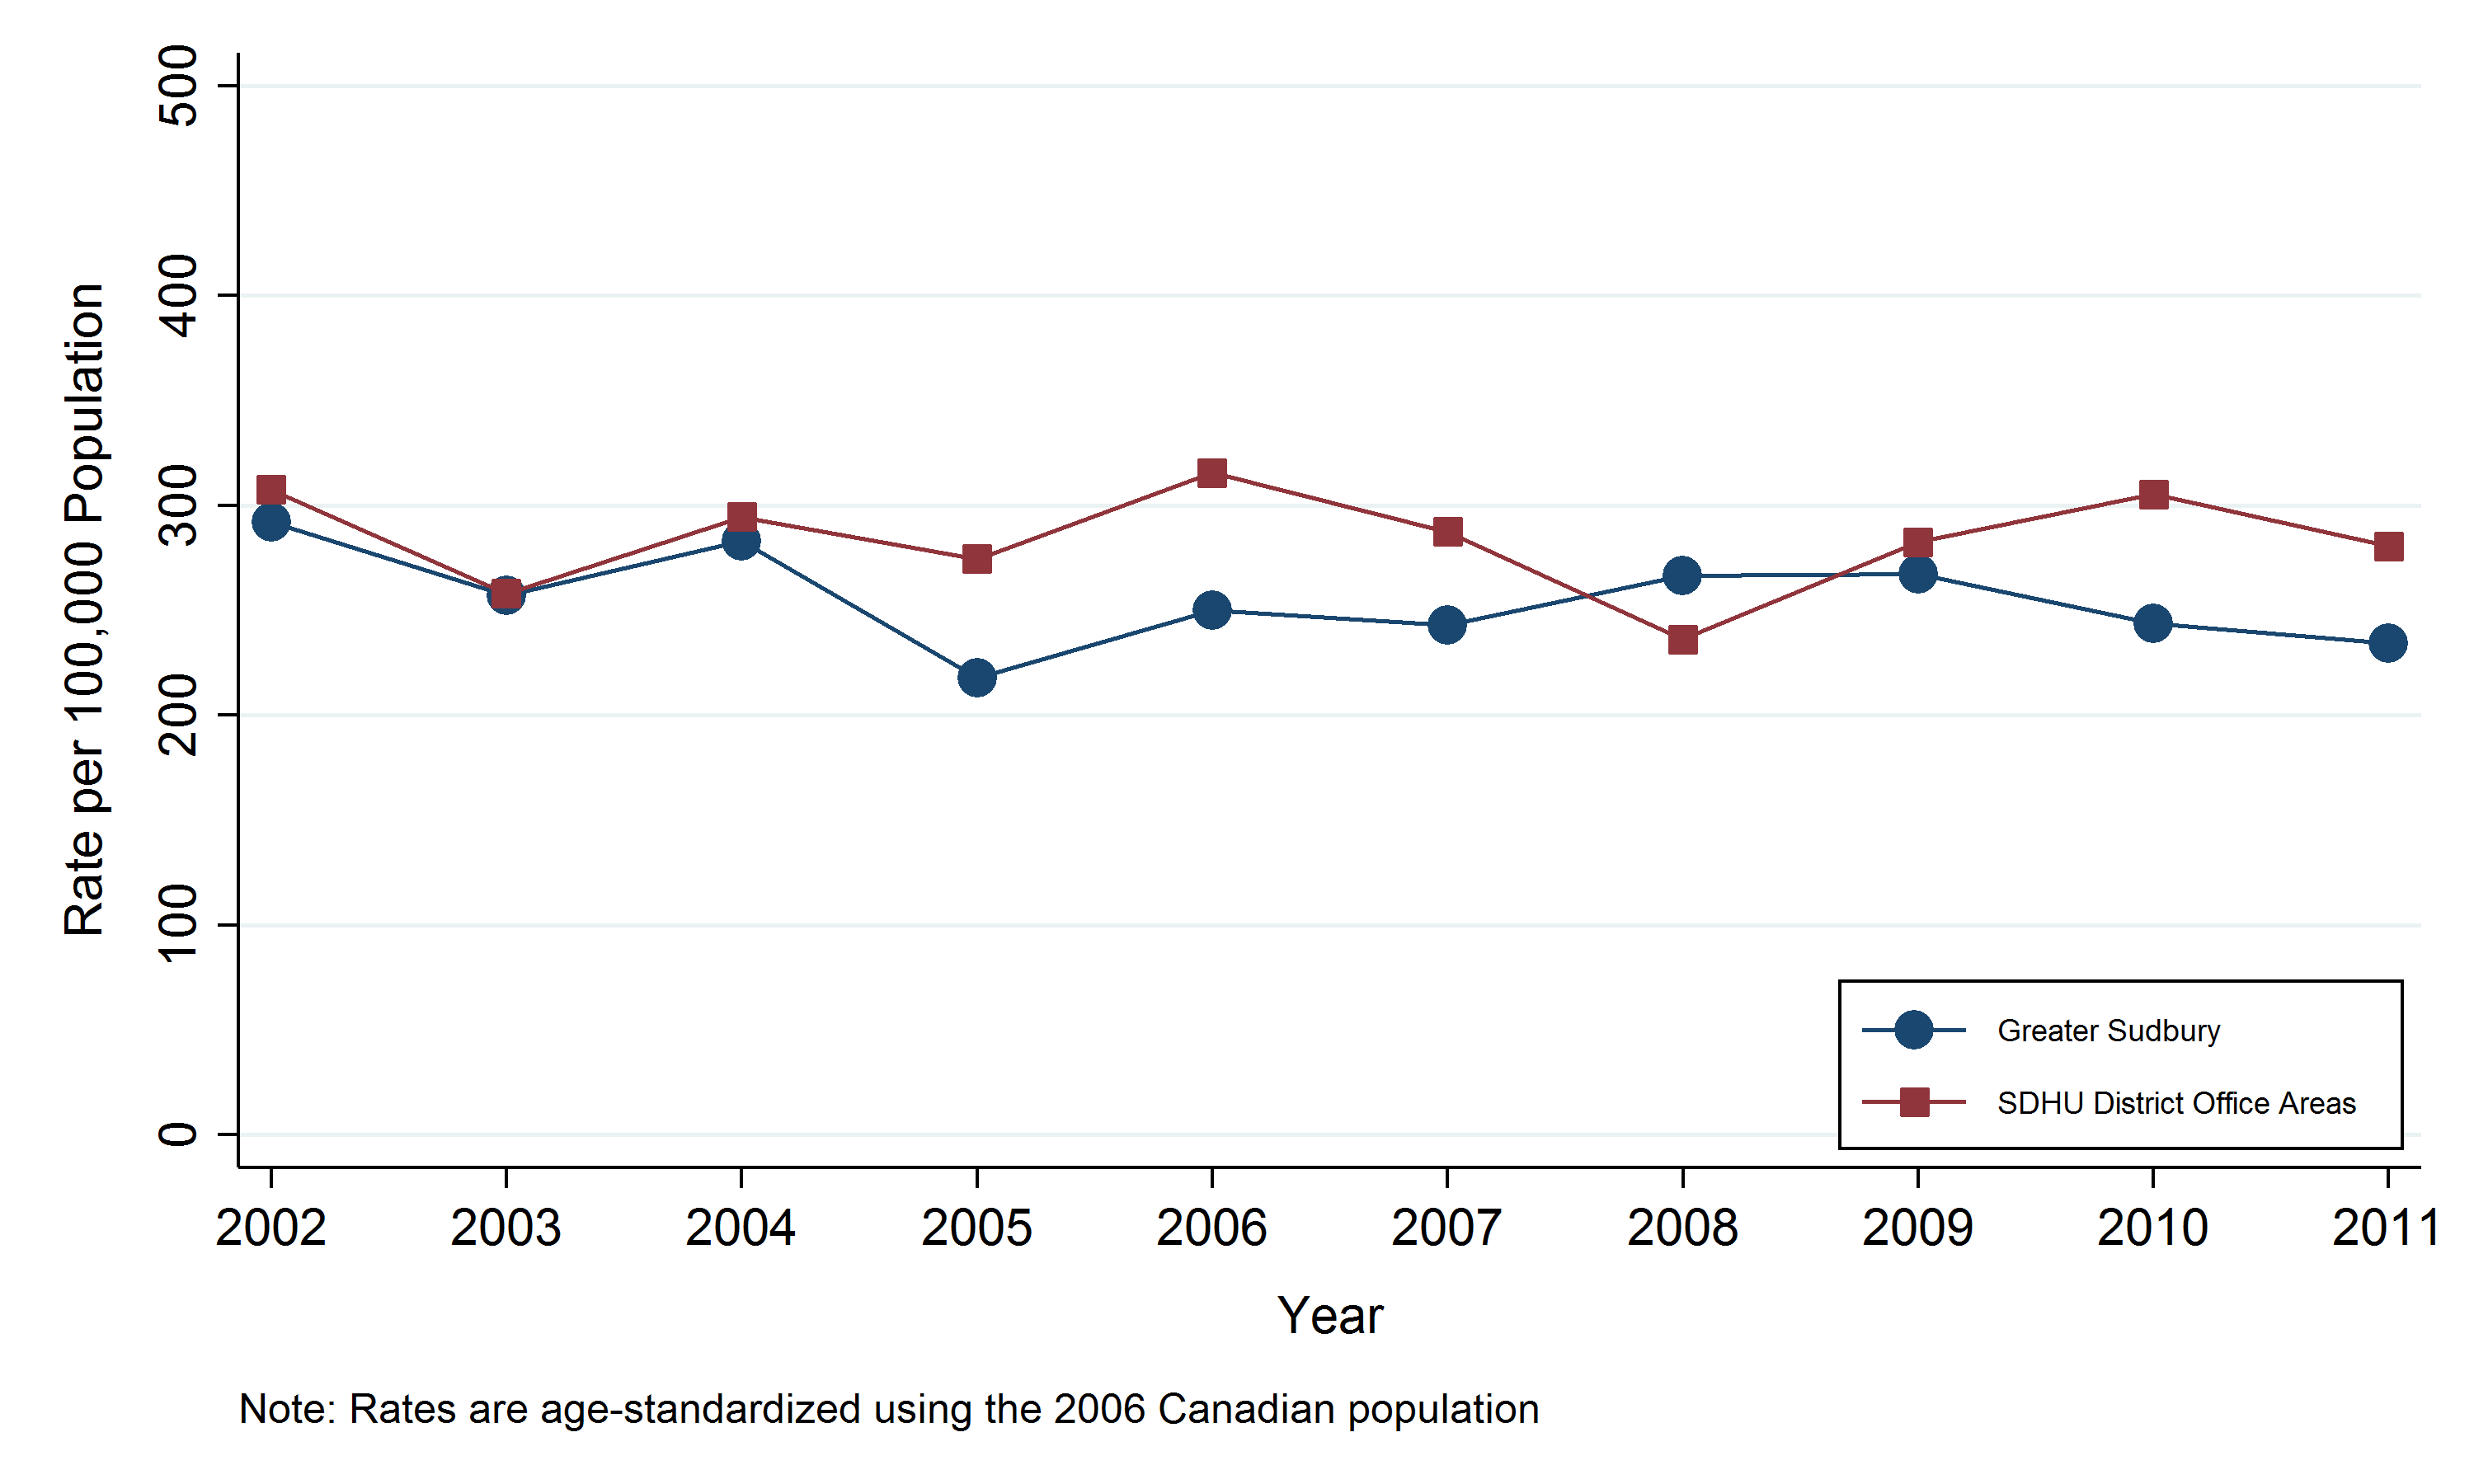
Table: Annual age-standardized avoidable mortality rate, Greater Sudbury vs. Sudbury & District Health Unit (SDHU) district office areas, 2002-2011.
| Geographic Region | 2002 | 2003 | 2004 | 2005 | 2006 | 2007 | 2008 | 2009 | 2010 | 2011 |
|---|---|---|---|---|---|---|---|---|---|---|
| SDHU District Office Area | 307.4 | 258.0 | 294.6 | 274.4 | 315.5 | 287.5 | 236.3 | 282.5 | 305.3 | 280.5 |
| Greater Sudbury | 291.9 | 256.9 | 283.1 | 217.9 | 250.1 | 243.1 | 266.5 | 267.1 | 243.6 | 234.5 |
Table: Annual number of avoidable mortality cases, Greater Sudbury vs. Sudbury & District Health Unit (SDHU) district office areas, 2002-2011.
| Geographic Region | 2002 | 2003 | 2004 | 2005 | 2006 | 2007 | 2008 | 2009 | 2010 | 2011 |
|---|---|---|---|---|---|---|---|---|---|---|
| SDHU District Office Area | 129 | 110 | 130 | 115 | 131 | 126 | 106 | 131 | 140 | 134 |
| Greater Sudbury | 481 | 432 | 480 | 375 | 436 | 431 | 480 | 485 | 450 | 439 |
Avoidable mortality by sex
Key findings:
- In the SDHU area there were 333 avoidable deaths among males and 240 avoidable deaths among females in 2011.
- In 2011, the avoidable mortality rate was 287 per 100,000 males and 200 per 100,000 females in the SDHU area.
- The rate among males has been consistently higher than the rate among females.
- In the SDHU area, the avoidable mortality rate for males generally decreased between 2002 and 2011 (with some fluctuations), while the rate for females remained relatively stable.
Notes:
- Rates are age-standardized using the 2006 Canadian population.
- Data Source: Mortality Data and Population Estimates and Projections, Ontario Ministry of Health and Long-Term Care, IntelliHEALTH Ontario, Extracted April 2015.
Figure: Annual age-standardized avoidable mortality rate, by sex, Sudbury & District Health Unit (SDHU) area, 2002-2011
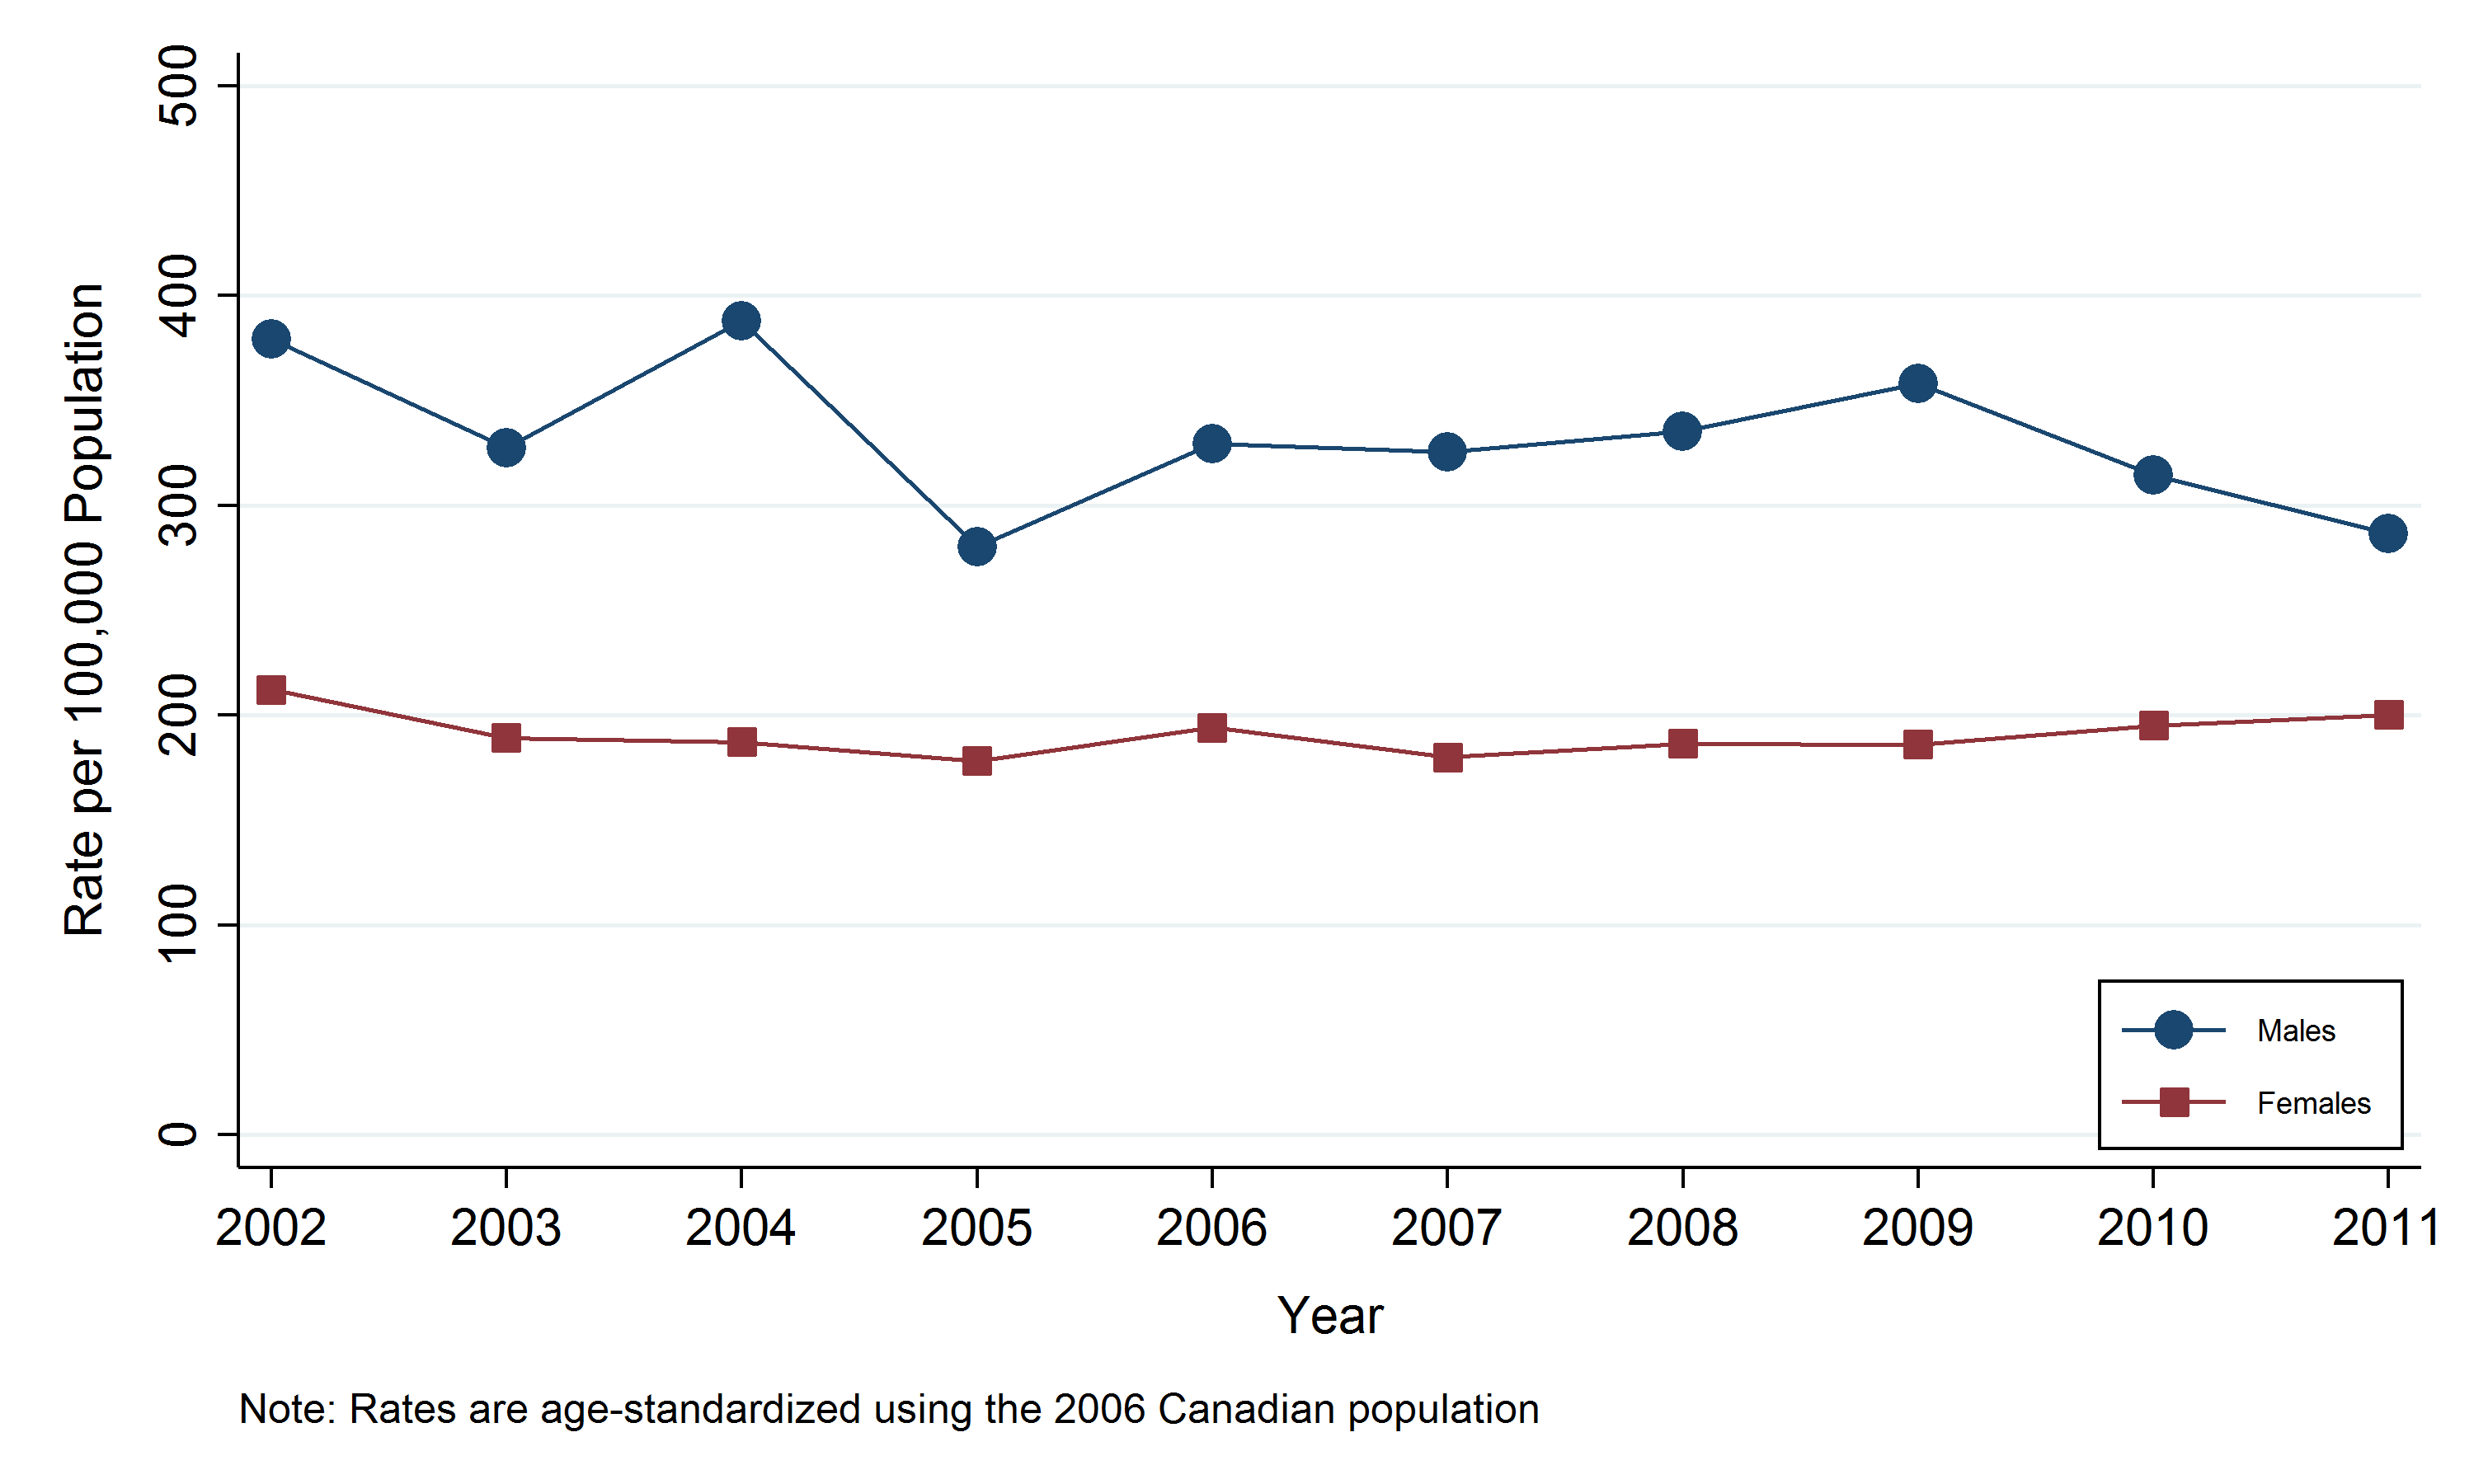
Table: Annual age-standardized avoidable mortality rate, by sex, Sudbury & District Health Unit (SDHU) area, 2002-2011
| Sex | 2002 | 2003 | 2004 | 2005 | 2006 | 2007 | 2008 | 2009 | 2010 | 2011 |
|---|---|---|---|---|---|---|---|---|---|---|
| Males | 379.0 | 327.5 | 387.9 | 280.1 | 329.5 | 325.6 | 335.3 | 358.1 | 314.5 | 286.6 |
| Females | 212.2 | 189.2 | 187.2 | 178.2 | 194.2 | 180.0 | 186.4 | 186.0 | 195.2 | 200.3 |
Table: Annual number of avoidable mortality cases, by sex, Sudbury & District Health Unit (SDHU) area, 2002-2011
| Sex | 2002 | 2003 | 2004 | 2005 | 2006 | 2007 | 2008 | 2009 | 2010 | 2011 |
|---|---|---|---|---|---|---|---|---|---|---|
| Males | 384 | 338 | 404 | 294 | 350 | 354 | 370 | 399 | 358 | 333 |
| Females | 226 | 204 | 206 | 196 | 217 | 203 | 216 | 217 | 232 | 240 |
This item was last modified on October 16, 2019