Leading causes of death
This section looks at the most common causes of death in the SDHU area. They are mostly related to chronic diseases, which is consistent with causes of death in all developed nations. It also looks at which diseases result in more deaths before the age of 75, or causing the most “years of life lost”.
The data are presented in two different ways: 1) with different types of cancers shown separately, and 2) with all cancers grouped as a single category.
Leading causes of death by geographic area
Key findings:
- The two most common causes of death in the Sudbury & District Health Unit (SDHU) area between 2002 and 2011 have been ischemic heart disease (heart attack) and lung cancer, with ischemic heart disease causing 19% of deaths and lung cancer causing 9% of deaths.
- Between 2002 and 2011, on average 329 people died of ischemic heart disease and 157 people died of lung cancer each year in the SDHU area.
- The percentage of deaths from both ischemic heart disease and lung cancer in the SDHU area is higher than the percentage of deaths by these diseases in Ontario.
Notes:
- Data Source: Mortality Data and Population Estimates and Projections, Ontario Ministry of Health and Long-Term Care, IntelliHEALTH Ontario, Extracted April 2015.
Figure: Percentage (%) of deaths from leading causes, by geographic area, 2002-2011
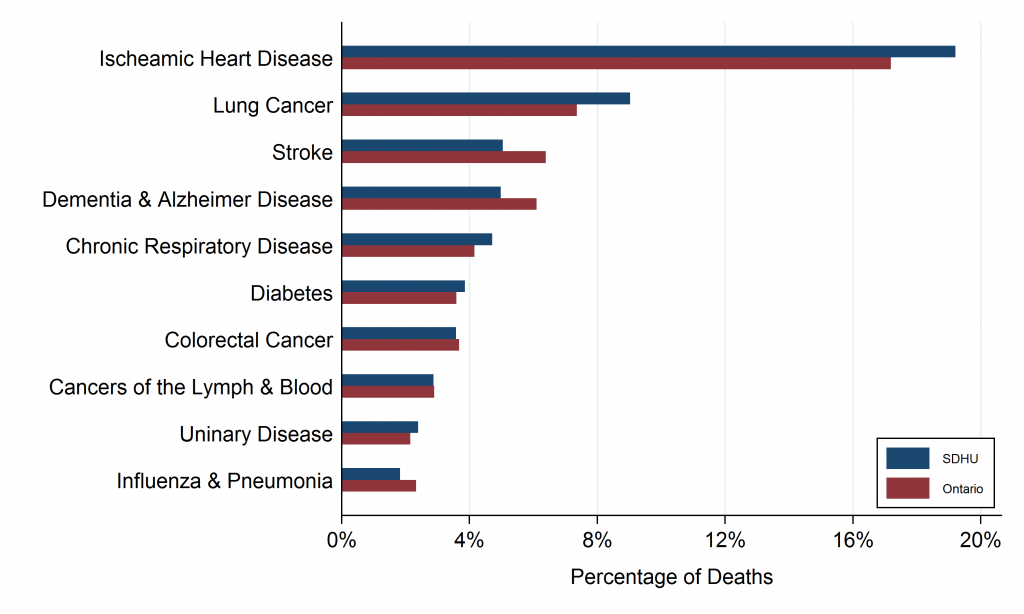
Table: Percentage (%) of deaths from leading causes, by geographic area, 2002-2011
| Rank | Leading Cause | SDHU | Northeast Ontario | Ontario |
| 1 | Ischemic Heart Disease | 19.2 | 18.9 | 17.2 |
| 2 | Lung Cancer | 9.0 | 8.8 | 7.4 |
| 3 | Stroke | 5.0 | 5.3 | 6.4 |
| 4 | Dementia & Alzheimer Disease | 5.0 | 5.3 | 6.1 |
| 5 | Chronic Respiratory Disease | 4.7 | 5.2 | 4.2 |
| 6 | Diabetes | 3.9 | 4.0 | 3.6 |
| 7 | Colorectal Cancer | 3.6 | 3.6 | 3.7 |
| 8 | Cancers of the Lymph & Blood | 2.9 | 2.8 | 2.9 |
| 9 | Urinary Disease | 2.4 | 2.0 | 2.1 |
| 10 | Influenza & Pneumonia | 1.8 | 1.8 | 2.3 |
Table: Number of deaths from leading causes, by geographic area, 2002-2011
| Rank | Leading Cause | SDHU | Northeast Ontario | Ontario |
| 1 | Ischeamic Heart Disease | 3290 | 9877 | 145979 |
| 2 | Lung Cancer | 1547 | 4579 | 62566 |
| 3 | Stroke | 864 | 2770 | 54258 |
| 4 | Dementia & Alzheimer Disease | 853 | 2742 | 51869 |
| 5 | Chronic Respiratory Disease | 807 | 2708 | 35310 |
| 6 | Diabetes | 661 | 2089 | 30483 |
| 7 | Colorectal Cancer | 614 | 1897 | 31226 |
| 8 | Cancers of the Lymph & Blood | 492 | 1471 | 24628 |
| 9 | Uninary Disease | 410 | 1061 | 18235 |
| 10 | Influenza & Pneumonia | 314 | 934 | 19797 |
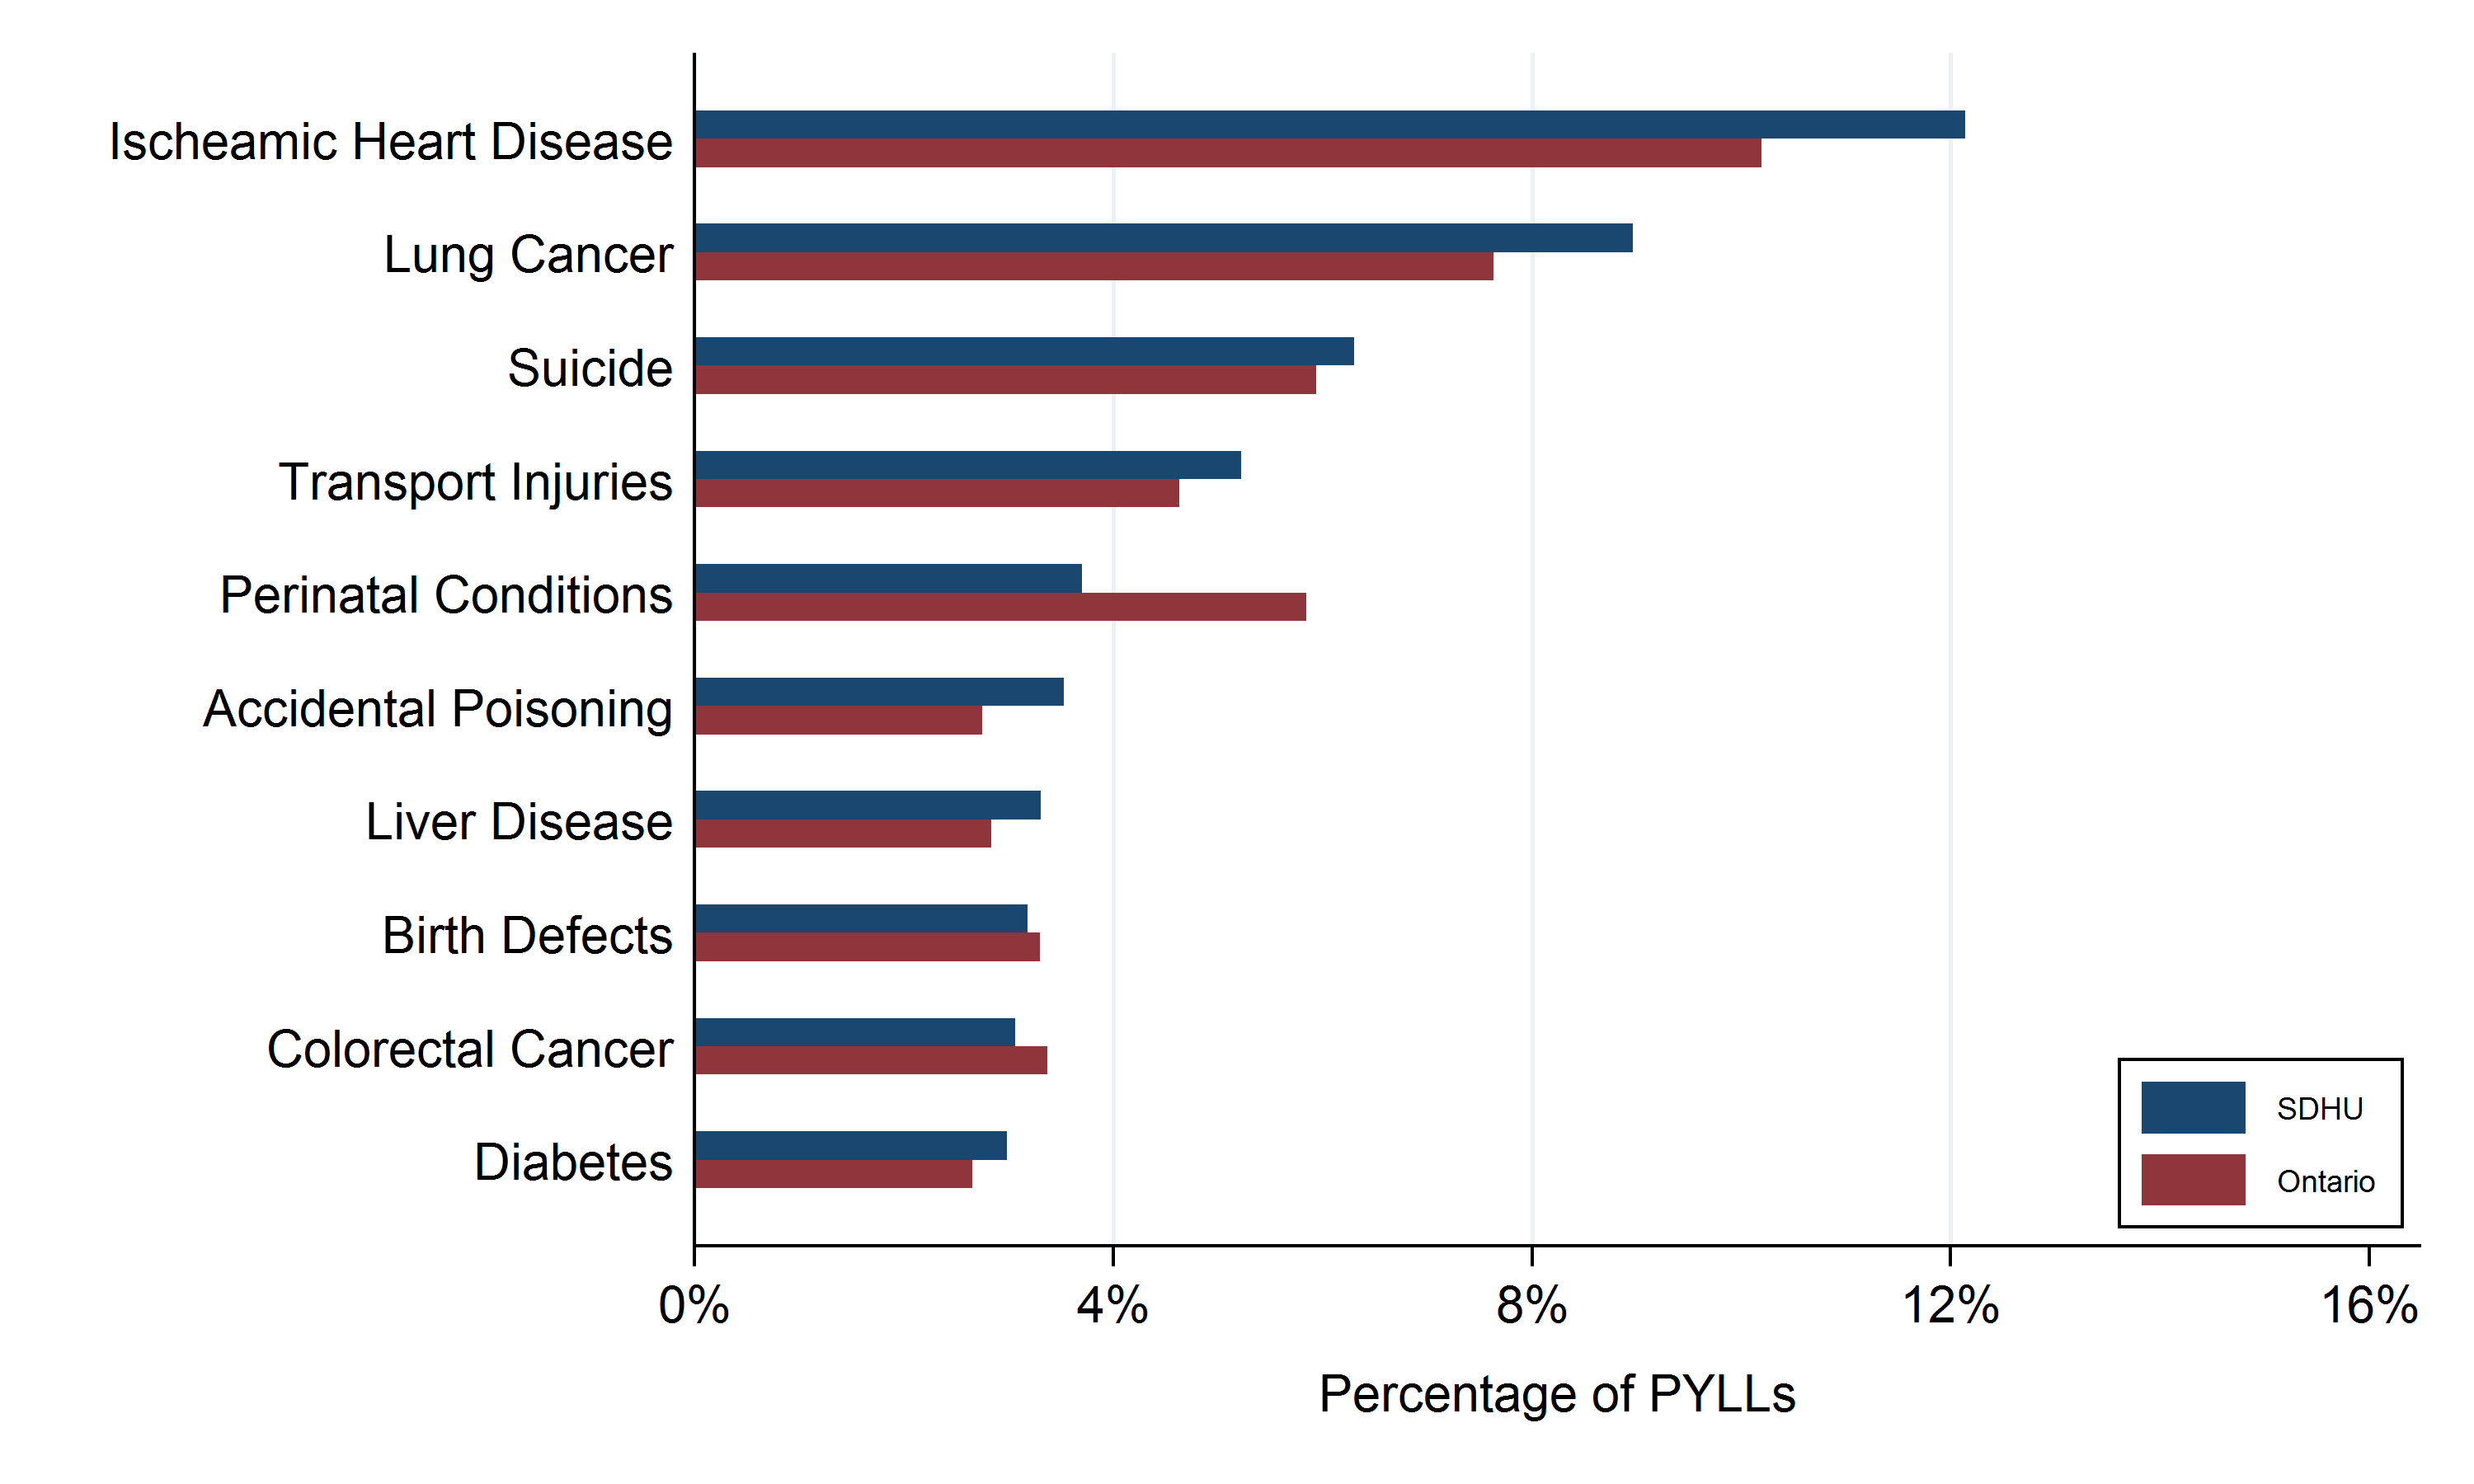
Leading causes of potential years of life lost by geographic area
Key findings:
- Between 2002 and 2011, ischemic heart disease (heart attack), lung cancer, and suicide resulted in the largest number of potential years of life lost (PYLL) in the SDHU area.
- Ischemic heart disease caused 12% of PYLL, lung cancer caused 9% of PYLL, and suicide accounted for 6% of PYLL.
- On average, between 2002 and 2011, early death from ischemic heart disease resulted in 1,453 PYLL, lung cancer resulted in 1,073 PYLL, and suicide accounted for 754 PYLL each year.
- The percentage of PYLL caused by ischemic heart disease, lung cancer, and suicide in the SDHU area is higher than in Ontario overall.
Notes:
- Data Source: Mortality Data and Population Estimates and Projections, Ontario Ministry of Health and Long-Term Care, IntelliHEALTH Ontario, Extracted April 2015.
Figure: Percentage (%) of potential years of life lost (PYLL) from leading causes, by geographic area, 2002-2011

Table: Percentage (%) of potential years of life lost (PYLL) from leading causes, by geographic area, 2002-2011
| Rank | Leading Cause | SDHU | Northeast Ontario | Ontario |
| 1 | Ischeamic Heart Disease | 12.1 | 12.0 | 10.2 |
| 2 | Lung Cancer | 9.0 | 8.7 | 7.6 |
| 3 | Suicide | 6.3 | 7.1 | 5.9 |
| 4 | Transport Injuries | 5.2 | 5.3 | 4.6 |
| 5 | Perinatal Conditions | 3.7 | 3.4 | 5.8 |
| 6 | Accidental Poisoning | 3.5 | 3.1 | 2.7 |
| 7 | Liver Disease | 3.3 | 2.8 | 2.8 |
| 8 | Birth Defects | 3.2 | 3.1 | 3.3 |
| 9 | Colorectal Cancer | 3.1 | 3.2 | 3.4 |
| 10 | Diabetes | 3.0 | 3.1 | 2.7 |
Table: Number of potential years of life lost (PYLL) from leading causes, by geographic area, 2002-2011
| Rank | Leading Cause | SDHU | Northeast Ontario | Ontario |
| 1 | Ischeamic Heart Disease | 14529 | 42458 | 543169 |
| 2 | Lung Cancer | 10726 | 30739 | 406771 |
| 3 | Suicide | 7540 | 25290 | 316578 |
| 4 | Transport Injuries | 6249 | 18785 | 246591 |
| 5 | Perinatal Conditions | 4425 | 12225 | 311511 |
| 6 | Accidental Poisoning | 4223 | 11150 | 146480 |
| 7 | Liver Disease | 3957 | 10016 | 150973 |
| 8 | Birth Defects | 3804 | 11150 | 175676 |
| 9 | Colorectal Cancer | 3664 | 11383 | 179452 |
| 10 | Diabetes | 3576 | 10856 | 141279 |
Leading causes of death (all cancers combined) by geographic area
Key findings:
- When all cancers are grouped together, it is by far the most common cause of death in the SDHU area. Between 2002 and 2011, 31% of local deaths were due to cancer. Ischemic heart disease (heart attack) caused 19% of deaths.
- Between 2002 and 2011, on average 527 people died of cancer and 329 people died of ischemic heart disease each year.
- The percentage of deaths from ischemic heart disease is higher in the SDHU area than it is in Ontario.
Notes:
- Data Source: Mortality Data and Population Estimates and Projections, Ontario Ministry of Health and Long-Term Care, IntelliHEALTH Ontario, Extracted April 2015.
Figure: Percentage (%) of deaths from leading causes (all cancers combined), by geographic area, 2002-2011
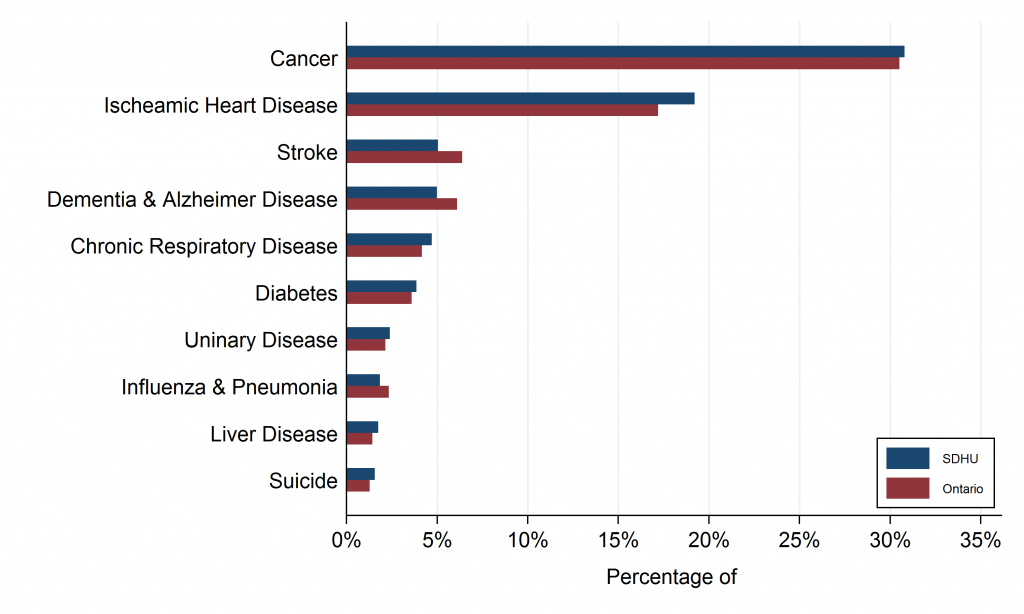
Table: Percentage of deaths from leading causes of death (all cancers combined), by geographic area, 2002-2011 – All cancers combined
| Rank | Leading Cause | SDHU | Northeast Ontario | Ontario |
| 1 | Cancer | 30.8 | 30.5 | 30.5 |
| 2 | Ischeamic Heart Disease | 19.2 | 18.9 | 17.2 |
| 3 | Stroke | 5.0 | 5.3 | 6.4 |
| 4 | Dementia & Alzheimer Disease | 5.0 | 5.3 | 6.1 |
| 5 | Chronic Respiratory Disease | 4.7 | 5.2 | 4.2 |
| 6 | Diabetes | 3.9 | 4.0 | 3.6 |
| 7 | Uninary Disease | 2.4 | 2.0 | 2.1 |
| 8 | Influenza & Pneumonia | 1.8 | 1.8 | 2.3 |
| 9 | Liver Disease | 1.7 | 1.5 | 1.4 |
| 10 | Suicide | 1.6 | 1.5 | 1.3 |
Table: Number of deaths from leading causes (all cancers combined), by geographic area, 2002-2011
| Rank | Leading Cause | SDHU | Northeast Ontario | Ontario |
| 1 | Cancer | 5273 | 15902 | 259265 |
| 2 | Ischeamic Heart Disease | 3290 | 9877 | 145979 |
| 3 | Stroke | 864 | 2770 | 54258 |
| 4 | Dementia & Alzheimer Disease | 853 | 2742 | 51869 |
| 5 | Chronic Respiratory Disease | 807 | 2708 | 35310 |
| 6 | Diabetes | 661 | 2089 | 30483 |
| 7 | Uninary Disease | 410 | 1061 | 18235 |
| 8 | Influenza & Pneumonia | 314 | 934 | 19797 |
| 9 | Liver Disease | 299 | 807 | 12102 |
| 10 | Suicide | 268 | 807 | 10778 |
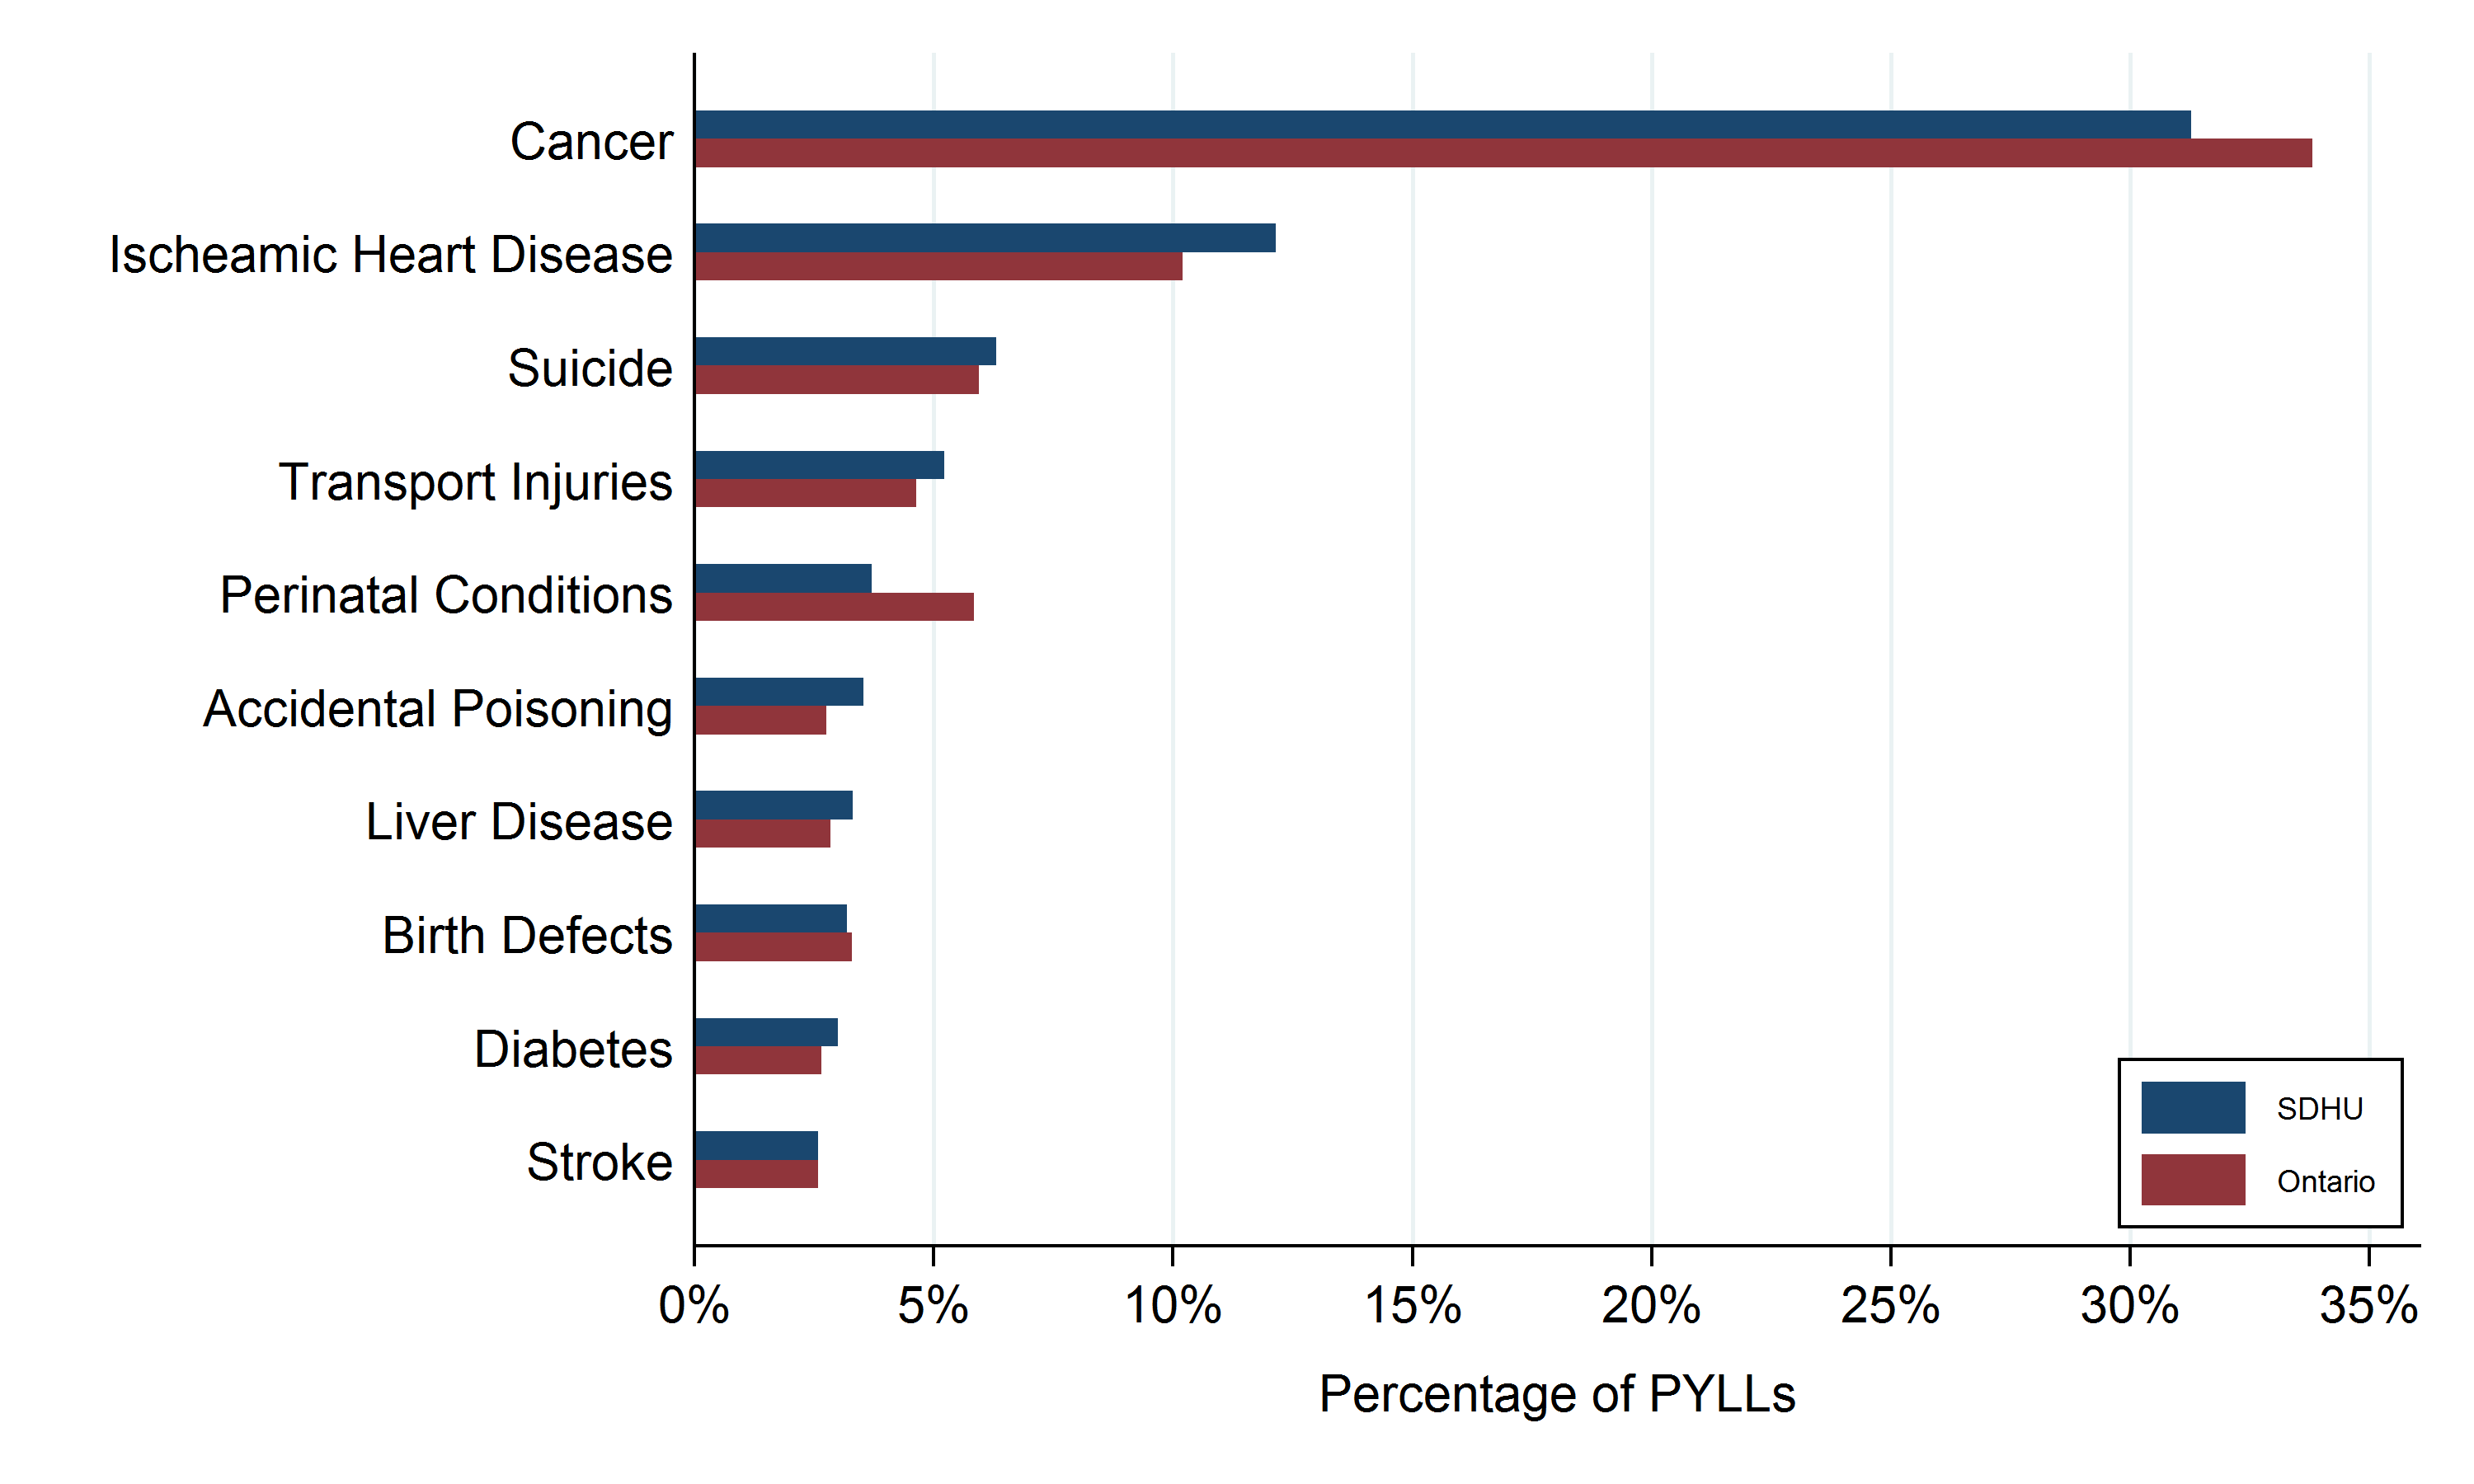
Leading causes of potential years of life lost (all cancers combined) by geographic area
Key findings:
- The most common causes of potential years of life lost (PYLL) in the SDHU area between 2002 and 2011 was cancer, which accounted for 31% of PYLL. Ischemic heart disease (heart attack) caused 12% of PYLL during that period.
- On average between 2002 and 2011, cancer resulted in 3,743 PYLL each year.
- The percentage of PYLL from cancer in the SDHU area is lower than in Ontario overall.
Notes:
- Data Source: Mortality Data and Population Estimates and Projections, Ontario Ministry of Health and Long-Term Care, IntelliHEALTH Ontario, Extracted April 2015.
Figure: Percentage (%) of potential years of life lost (PYLL) from leading causes (all cancers combined), by geographic area, 2002-2011

Table: Percentage (%) of potential years of life lost (PYLL) from leading causes (all cancers combined), by geographic area, 2002-2011
| Rank | Leading Cause | SDHU | Northeast Ontario | Ontario |
| 1 | Cancer | 31.3 | 30.9 | 33.8 |
| 2 | Ischeamic Heart Disease | 12.1 | 12.0 | 10.2 |
| 3 | Suicide | 6.3 | 7.1 | 5.9 |
| 4 | Transport Injuries | 5.2 | 5.3 | 4.6 |
| 5 | Perinatal Conditions | 3.7 | 3.4 | 5.8 |
| 6 | Accidental Poisoning | 3.5 | 3.1 | 2.7 |
| 7 | Liver Disease | 3.3 | 2.8 | 2.8 |
| 8 | Birth Defects | 3.2 | 3.1 | 3.3 |
| 9 | Diabetes | 3.0 | 3.1 | 2.7 |
| 10 | Stroke | 2.6 | 2.6 | 2.6 |
Table: Number of potential years of life lost (PYLL) from leading causes (all cancers combined), by geographic area, 2002-2011
| Rank | Leading Causes | SDHU | Northeast Ontario | Ontario |
| 1 | Cancer | 37425 | 109758 | 1801942 |
| 2 | Ischeamic Heart Disease | 14529 | 42458 | 543169 |
| 3 | Suicide | 7540 | 25290 | 316578 |
| 4 | Transport Injuries | 6249 | 18785 | 246591 |
| 5 | Perinatal Conditions | 4425 | 12225 | 311511 |
| 6 | Accidental Poisoning | 4223 | 11150 | 146480 |
| 7 | Liver Disease | 3957 | 10016 | 150973 |
| 8 | Birth Defects | 3804 | 11150 | 175676 |
| 9 | Diabetes | 3576 | 10856 | 141279 |
| 10 | Stroke | 3097 | 9120 | 137611 |
This item was last modified on March 26, 2018