Opportunities for Health for All: A Focus on Income
- Health is more than health care
- Health includes mental and physical health
- Income is one of the strongest predictors of health
- Income impacts mental health
- Income impacts physical health
- Income impacts how we feel about our health
- Income matters
- Methodological notes
- References
- Endnotes
- Board of Health motion
This report is intended to help planners, leaders and everyday people use local data to inspire meaningful action.
Health is more than health care1
The social and economic environments where we live, work, play, learn, and grow are critical to our health and well-being. Collectively, these factors and conditions are known as the determinants of health. The determinants of health have a powerful impact on how health is experienced and distributed in our communities. The impact of these factors on health is, in fact, more powerful than the impact of biology and access to the health care system.2 These social factors, or determinants of health, contribute to the health experienced by individuals and by communities overall.
Health Includes Mental and Physical Health
Mental health and physical health are equally important to our overall picture of health. We can’t truly be healthy without mental health. It involves how we feel, think, act, and interact with the world around us. Mental health is about realizing our potential and coping with the normal stresses of life. In other words, there is no health without mental health.3
Figure 1: Social Determinants of Health4
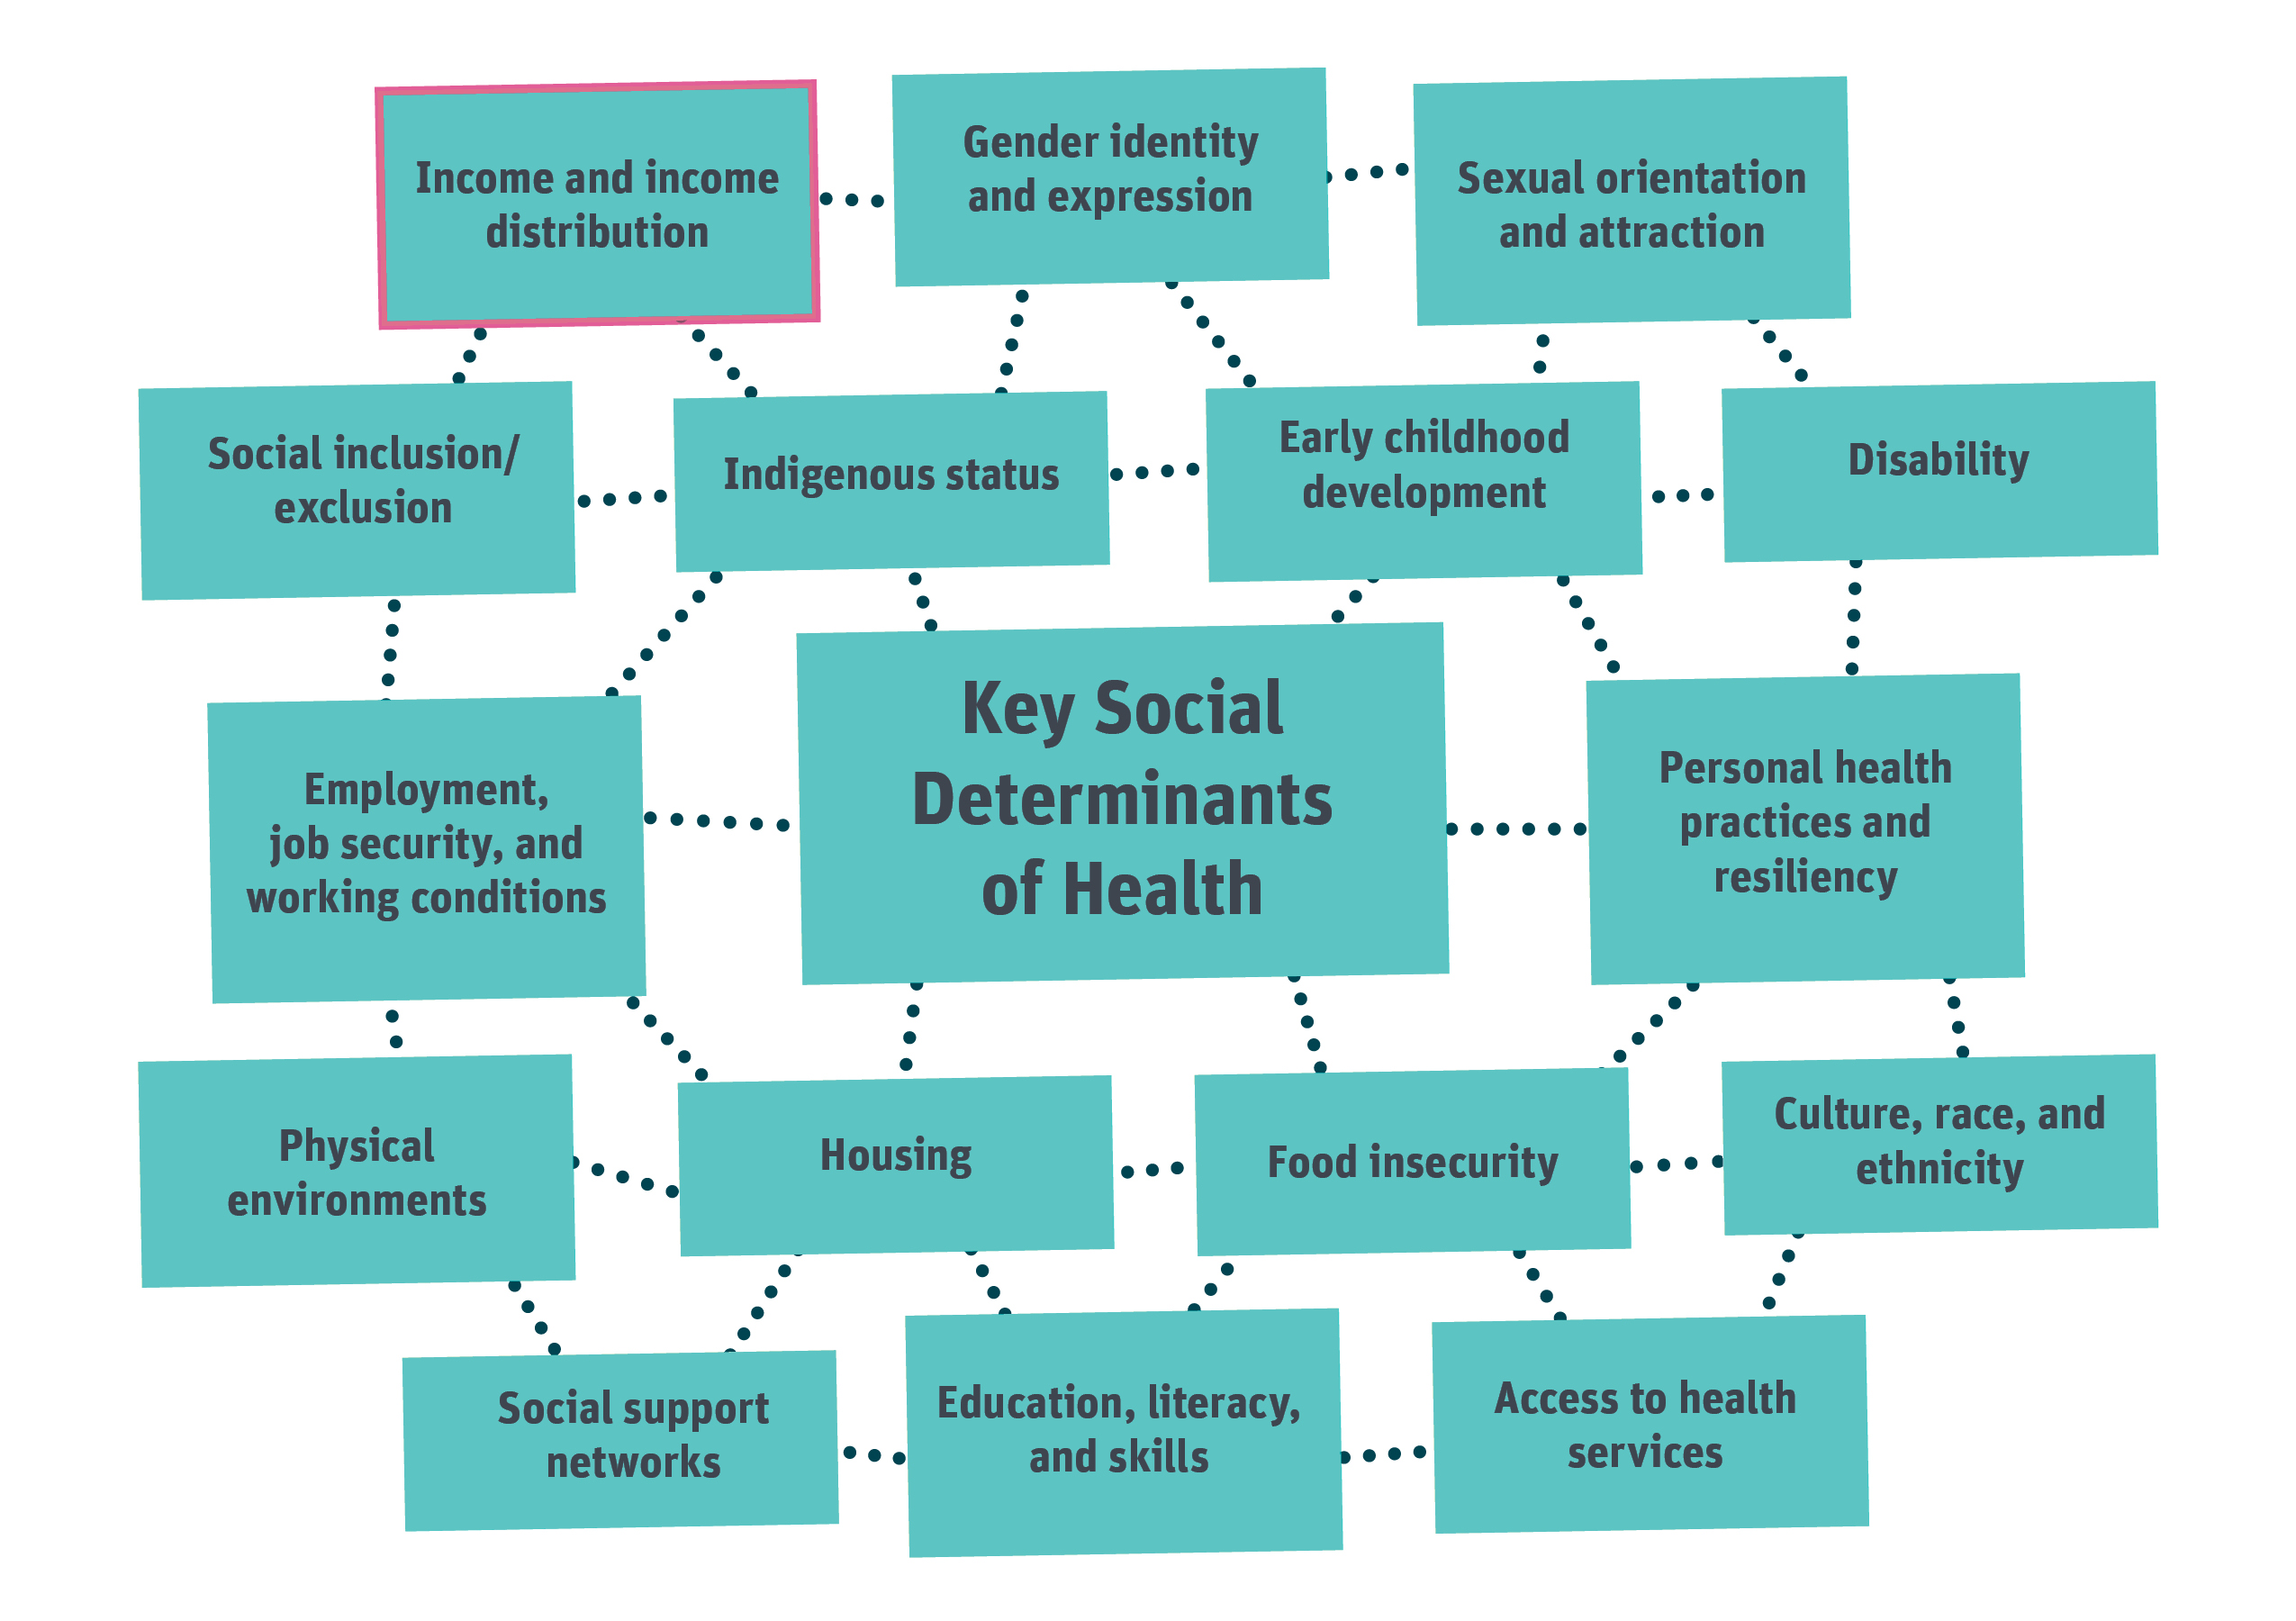
The sixteen key determinants of health recognized by the province include the following:
- Income and income distribution
- Gender identity and expression
- Sexual orientation and attraction
- Social inclusion / exclusion
- Indigenous status
- Early childhood development
- Disability
- Employment, job security, and working conditions
- Personal health practices and resiliency
- Physical environments
- Housing
- Food Security
- Culture, race, and ethnicity
- Social support networks
- Education, literacy and skills
- Access to health services
Income is one of the strongest predictors of health
Not everyone has the same opportunities for health. Opportunities for health are largely influenced by the everyday social and economic conditions of life.5 Most simply, we know that income alone is the single strongest predictor of health, and that health improves at every step up the income ladder.6,7
Income provides access to and improves experiences with nearly all other determinants of health. Adequate income removes barriers, stressors, and challenges to achieving health. On the other hand, poverty increases the risk of poor mental and physical health across the life course.
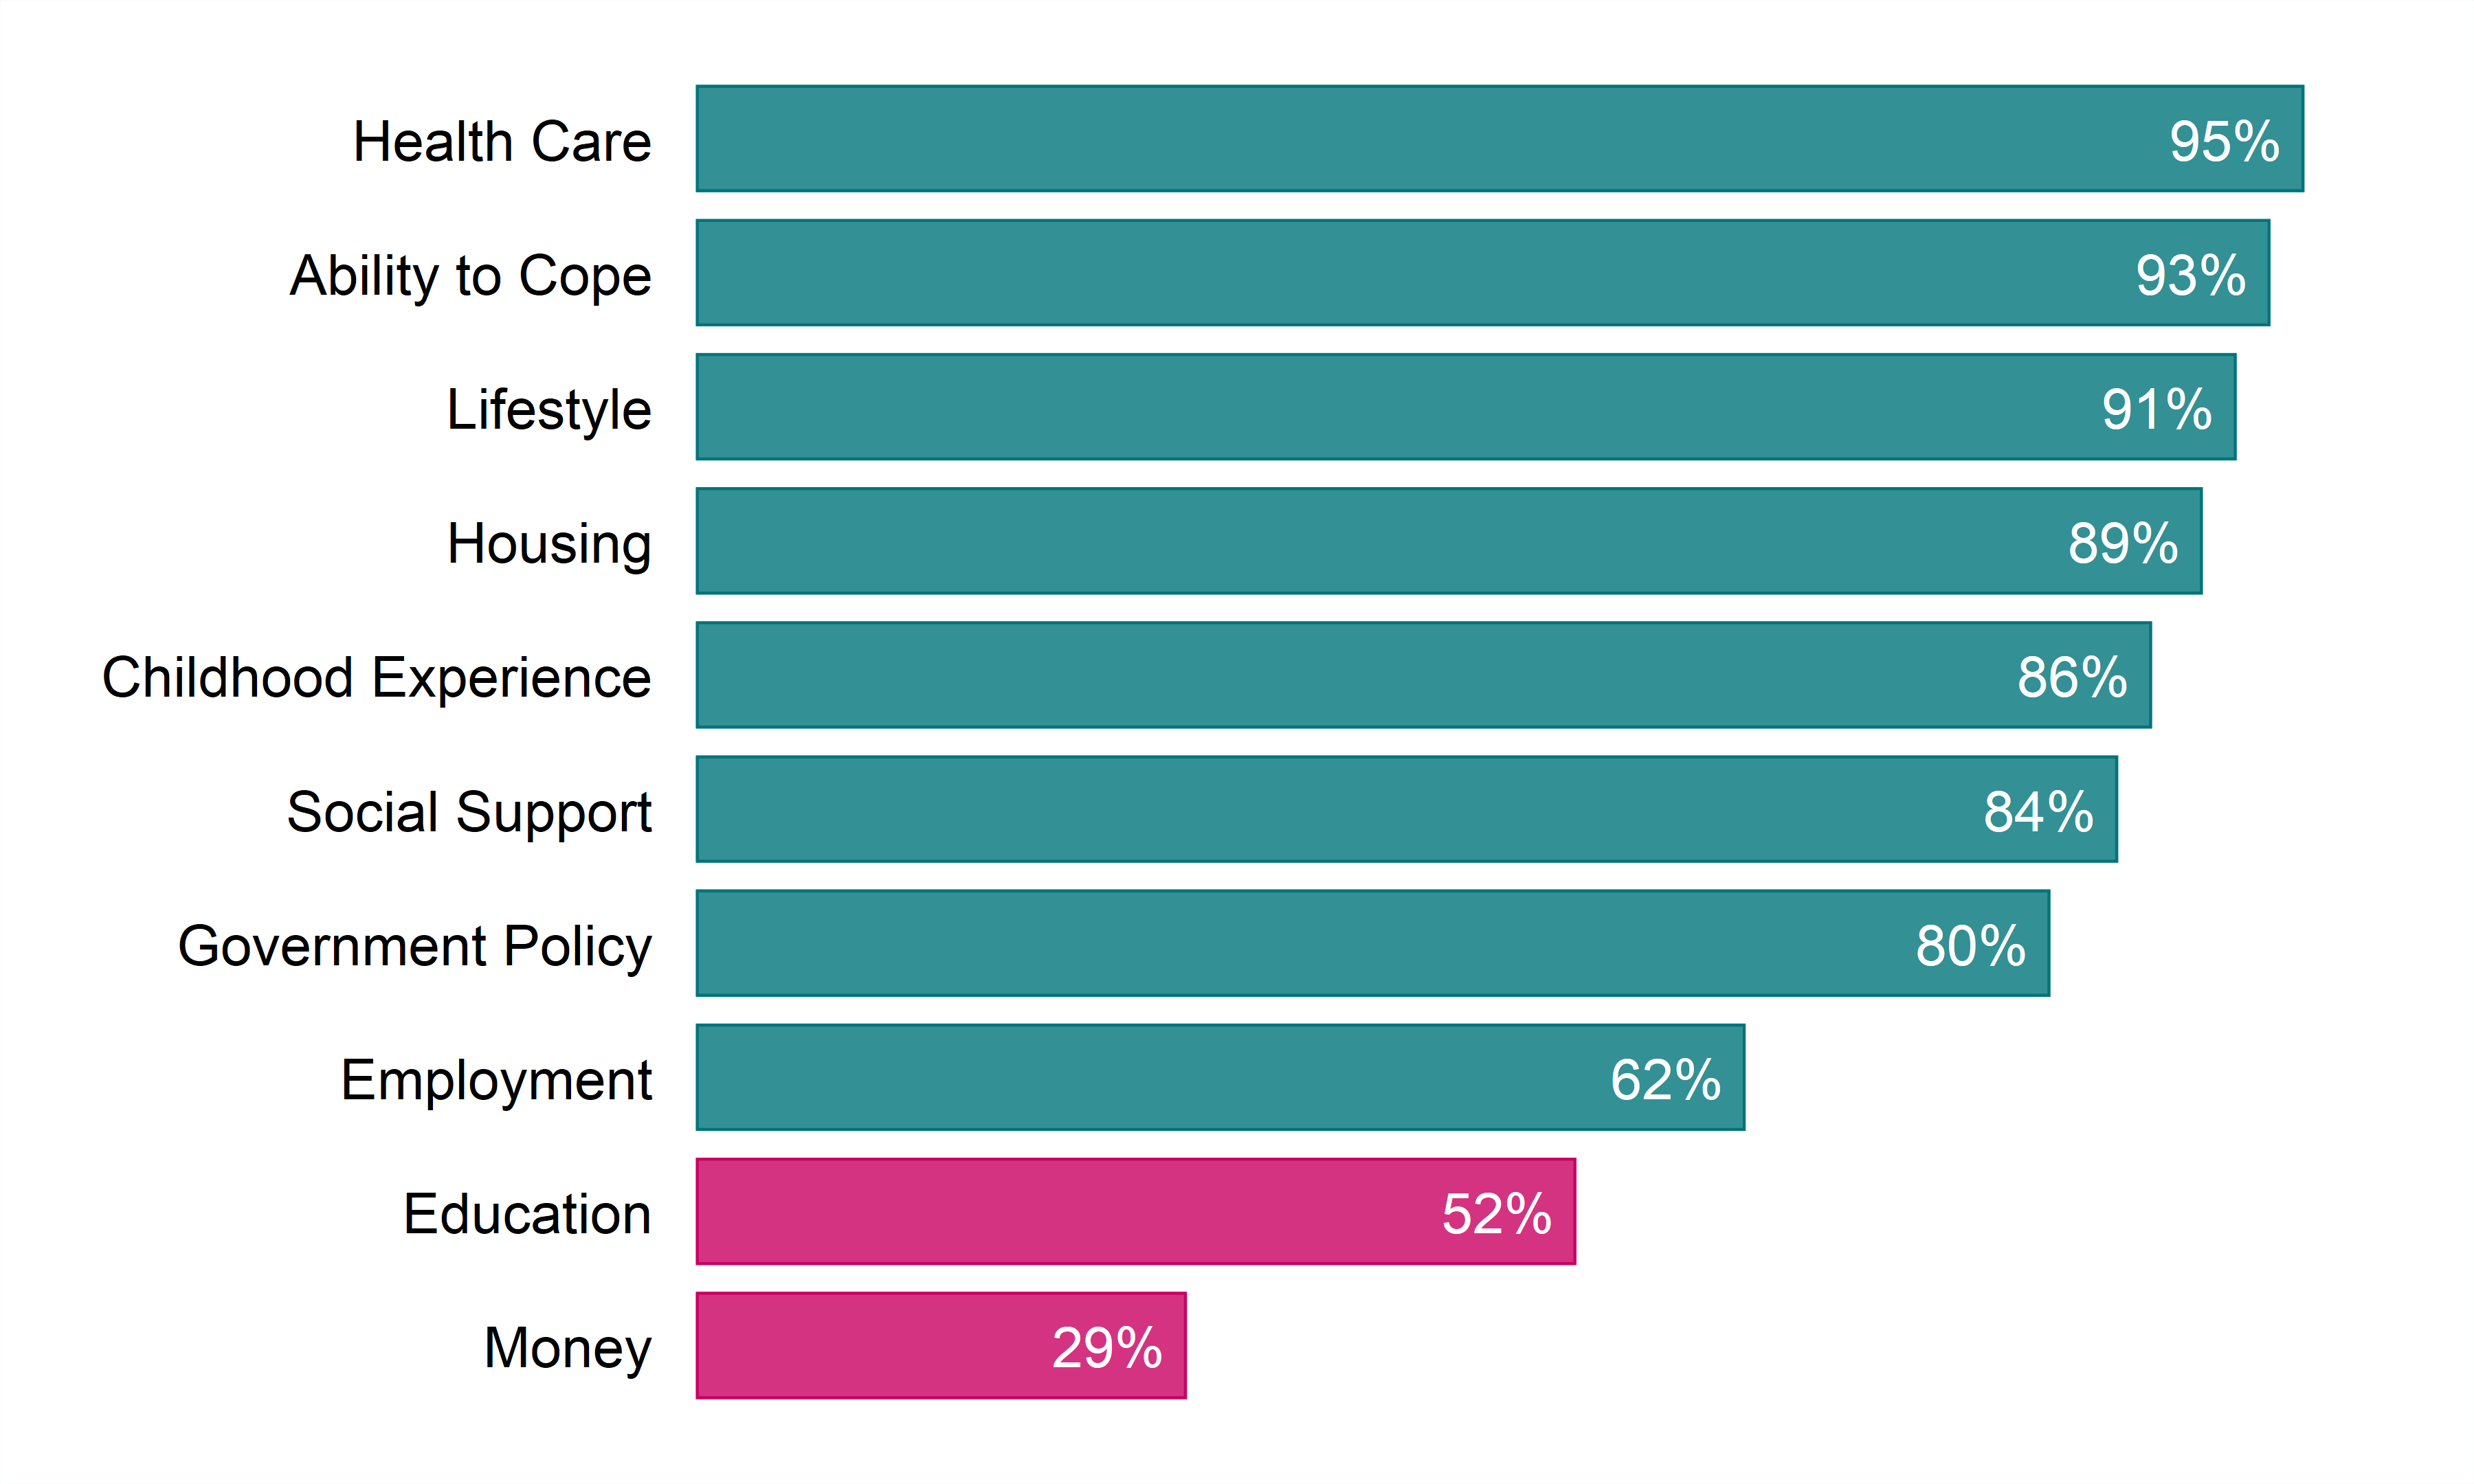
The poorer we are, the earlier we die and the more illness and disability we experience in our lifetimes. This is a fact that is borne out locally, just as it is provincially and nationally. Despite the global evidence of the powerful link between income and health, a common response in thinking about health is to focus on what we need when we are not healthy, namely health care or illness care. This common view of health care as the key to good health is also held here locally. A survey in 2017 of residents from Sudbury and districts found that people consider health care to be more important to a person’s overall physical and mental health than money.
Figure 2. Social Determinants of Health Indicators by Level of Importance, Sudbury and districts, ages 16+, RRFSS 2017
| Social Determinants of Health Indicators | Percentage of level of Importance |
|---|---|
| Health Care | 95% |
| Ability to Cope | 93% |
| Lifestyle | 91% |
| Housing | 89% |
| Childhood Experience | 86% |
| Social Support | 84% |
| Government Policy | 80% |
| Employment | 62% |
| Education | 52% |
| Money | 29% |
Question to participants: I am going to read you a list of things that could help make a person healthy. By “healthy” we mean both a person’s physical and mental health, being free from disease and pain and being satisfied with life. Please tell me if you think each of the following are extremely important, very important, somewhat important, not very important, or not at all important in helping to make a person healthy?
Focusing on health care and the immediate benefits of treating illness is a common and understandable preoccupation for many of us. Less common, is a focus and understanding of the health benefits of adequate income and the long-term personal and societal benefits of preventing illness in the first place. Of course, access to health services is essential when we are ill, but no amount of health care can prevent people from getting sick in the first place. It may not be as obvious as we think, but income is critical to the health of individuals and communities. This report uses available data to highlight some of the impacts of income on mental health, physical health, and perceived health in our region. The data show that not everyone has the same or equal opportunities for health. Our neighbours and friends with lower levels of income generally experience worse mental and physical health. Knowing all this compels us to address poverty to improve health for everyone.
Income Impacts Mental Health
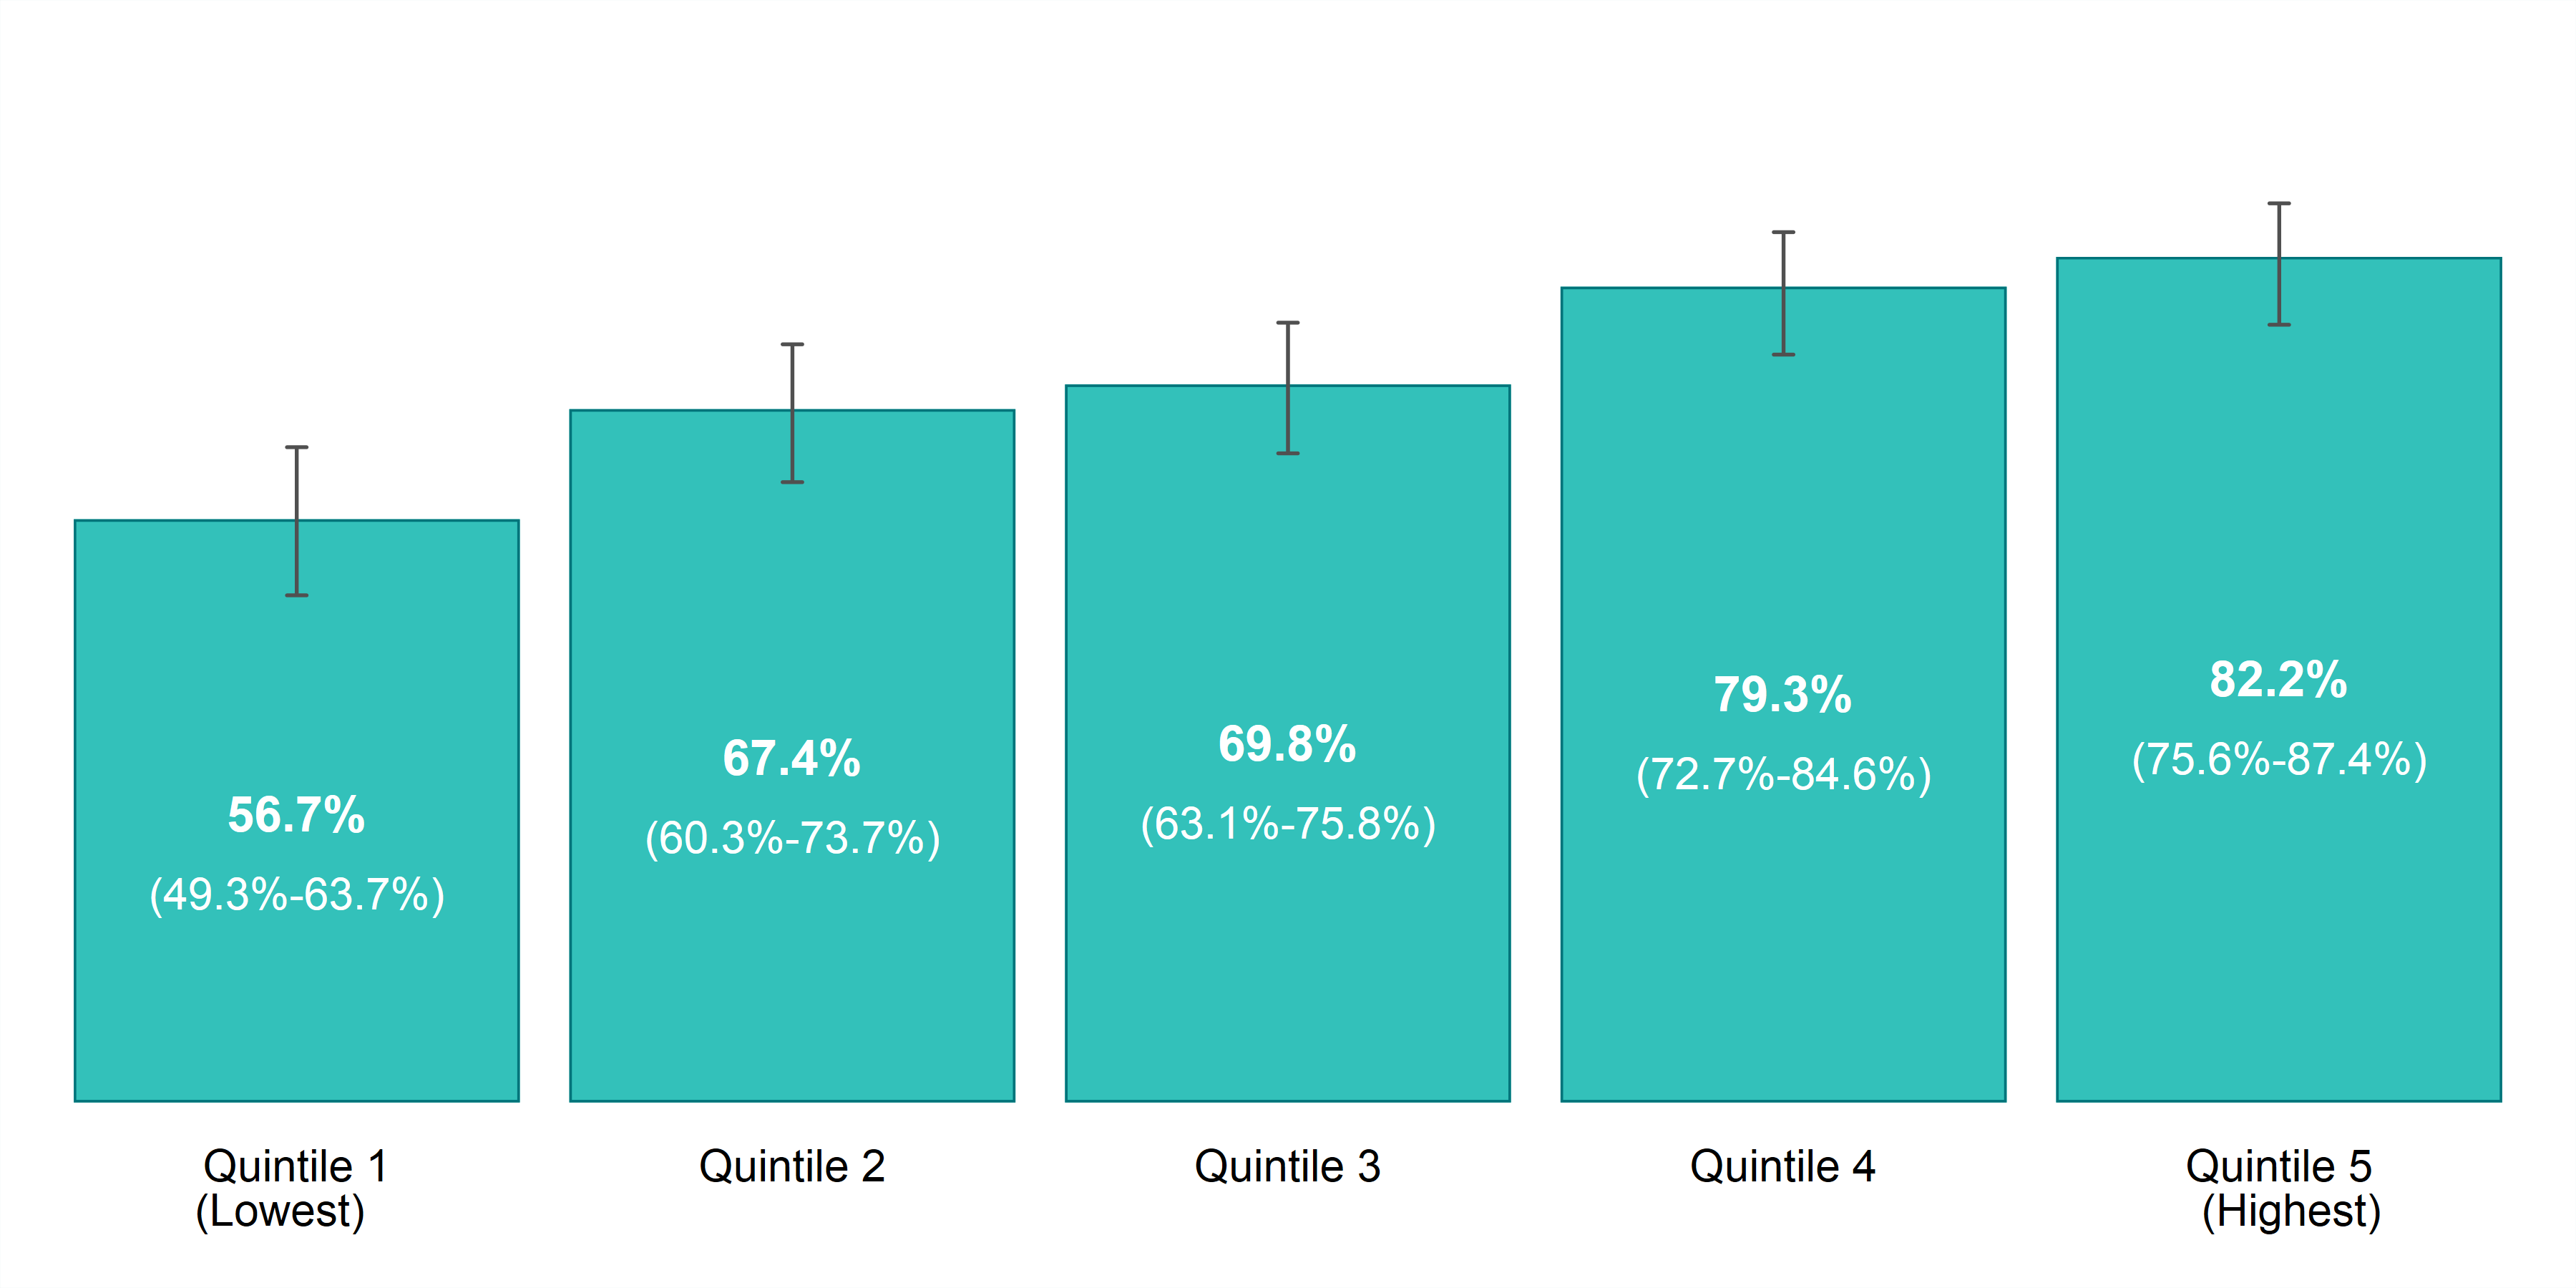
Populations living in low income are disproportionately affected by mental health problems and challenges.8,9 Nationally, the percentage of adults reporting poor or fair self-rated mental health has been increasing among our country’s poorest.10 In Sudbury and districts, the rate of excellent or very good self-rated mental health is lowest among our community members living with the lowest level of income.
Higher rates of mental illness
“I was suicidal for a long time, but wouldn’t do it because I have a son, you know, I wouldn’t hurt him like that.”
~
“My son passed away. I took this very hard and things went back to the way they were with me suffering from severe depression and my anxiety took over, along with PTSD.”
Figure 3. Prevalence rate, self-rated mental health (excellent or very good), by year and household income, ages 12+, Sudbury and districts, 2011 to 2014
| Household Income Distribution | Prevalence Rate, 2011 to 2014 | CV - 2011 to 2014 |
|---|---|---|
| Quintile 1 (Lowest) | 56.7% (CI: 49.3% to 63.7%) | 7 |
| Quintile 2 | 67.4% (CI: 60.3% to 73.7%) | 5 |
| Quintile 3 | 69.8% (CI: 63.1% to 75.8%) | 5 |
| Quintile 4 | 79.3% (CI: 72.7% to 84.6%) | 4 |
| Quintile 5 (Highest) | 82.2% (CI: 75.6% to 87.4%) | 4 |
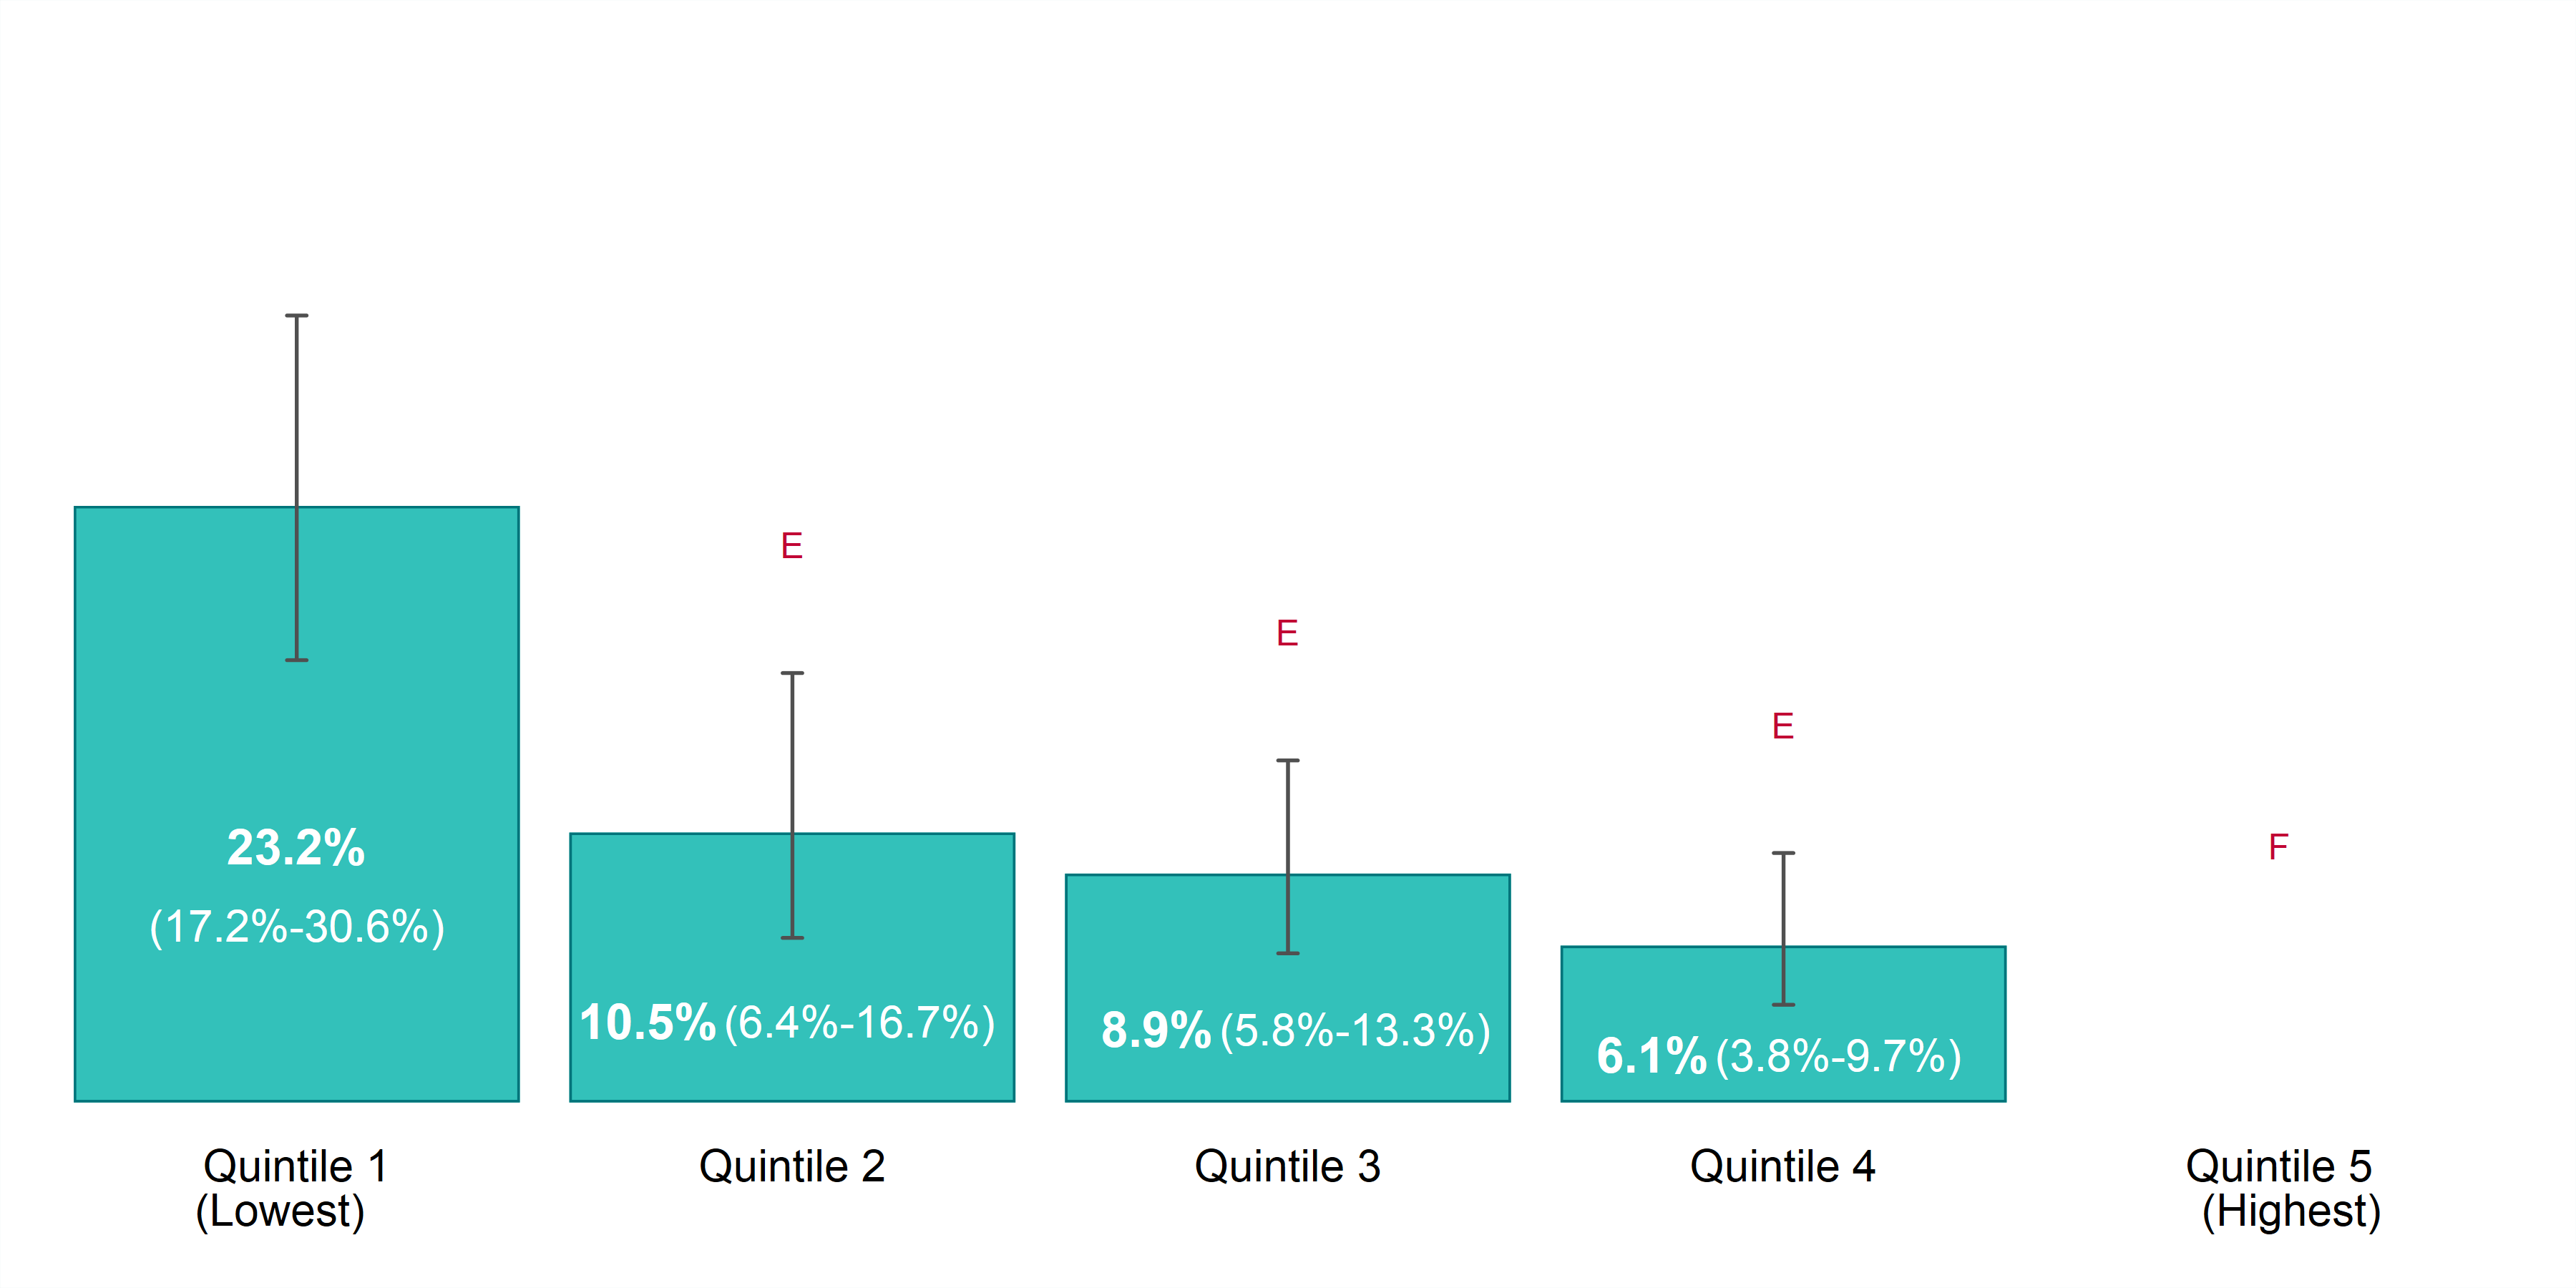
The results are similar when we narrow the focus to mental illness. In Ontario, the poorest people have higher rates of mental illness than the richest people.11 The same is true in Sudbury and districts; mood disorders, such as depression, bipolar disorder, mania, and dysthymia, are highest among our community members living with the lowest levels of income.
Figure 4. Prevalence rate, mood disorders, by year and household income, ages 12+, Sudbury and districts, 2011 to 2014
Household Income Distribution Prevalence Rate, 2011 to 2014 CV - 2011 to 2014
Quintile 1 (Lowest) 23.2% (CI: 17.2% to 30.6%) 15
Quintile 2 10.5% E (CI: 6.4% to 16.7%) 25
Quintile 3 8.9% E (CI: 5.8% to 13.3%) 21
Quintile 4 6.1% E (CI: 3.8% to 9.7%) 24
Quintile 5 (Highest) F 42
*E: Estimates marked with E should be interpreted with caution due to high margin of error.
*F: Estimates for categories marked with F cannot be released due to an unacceptable margin of error.
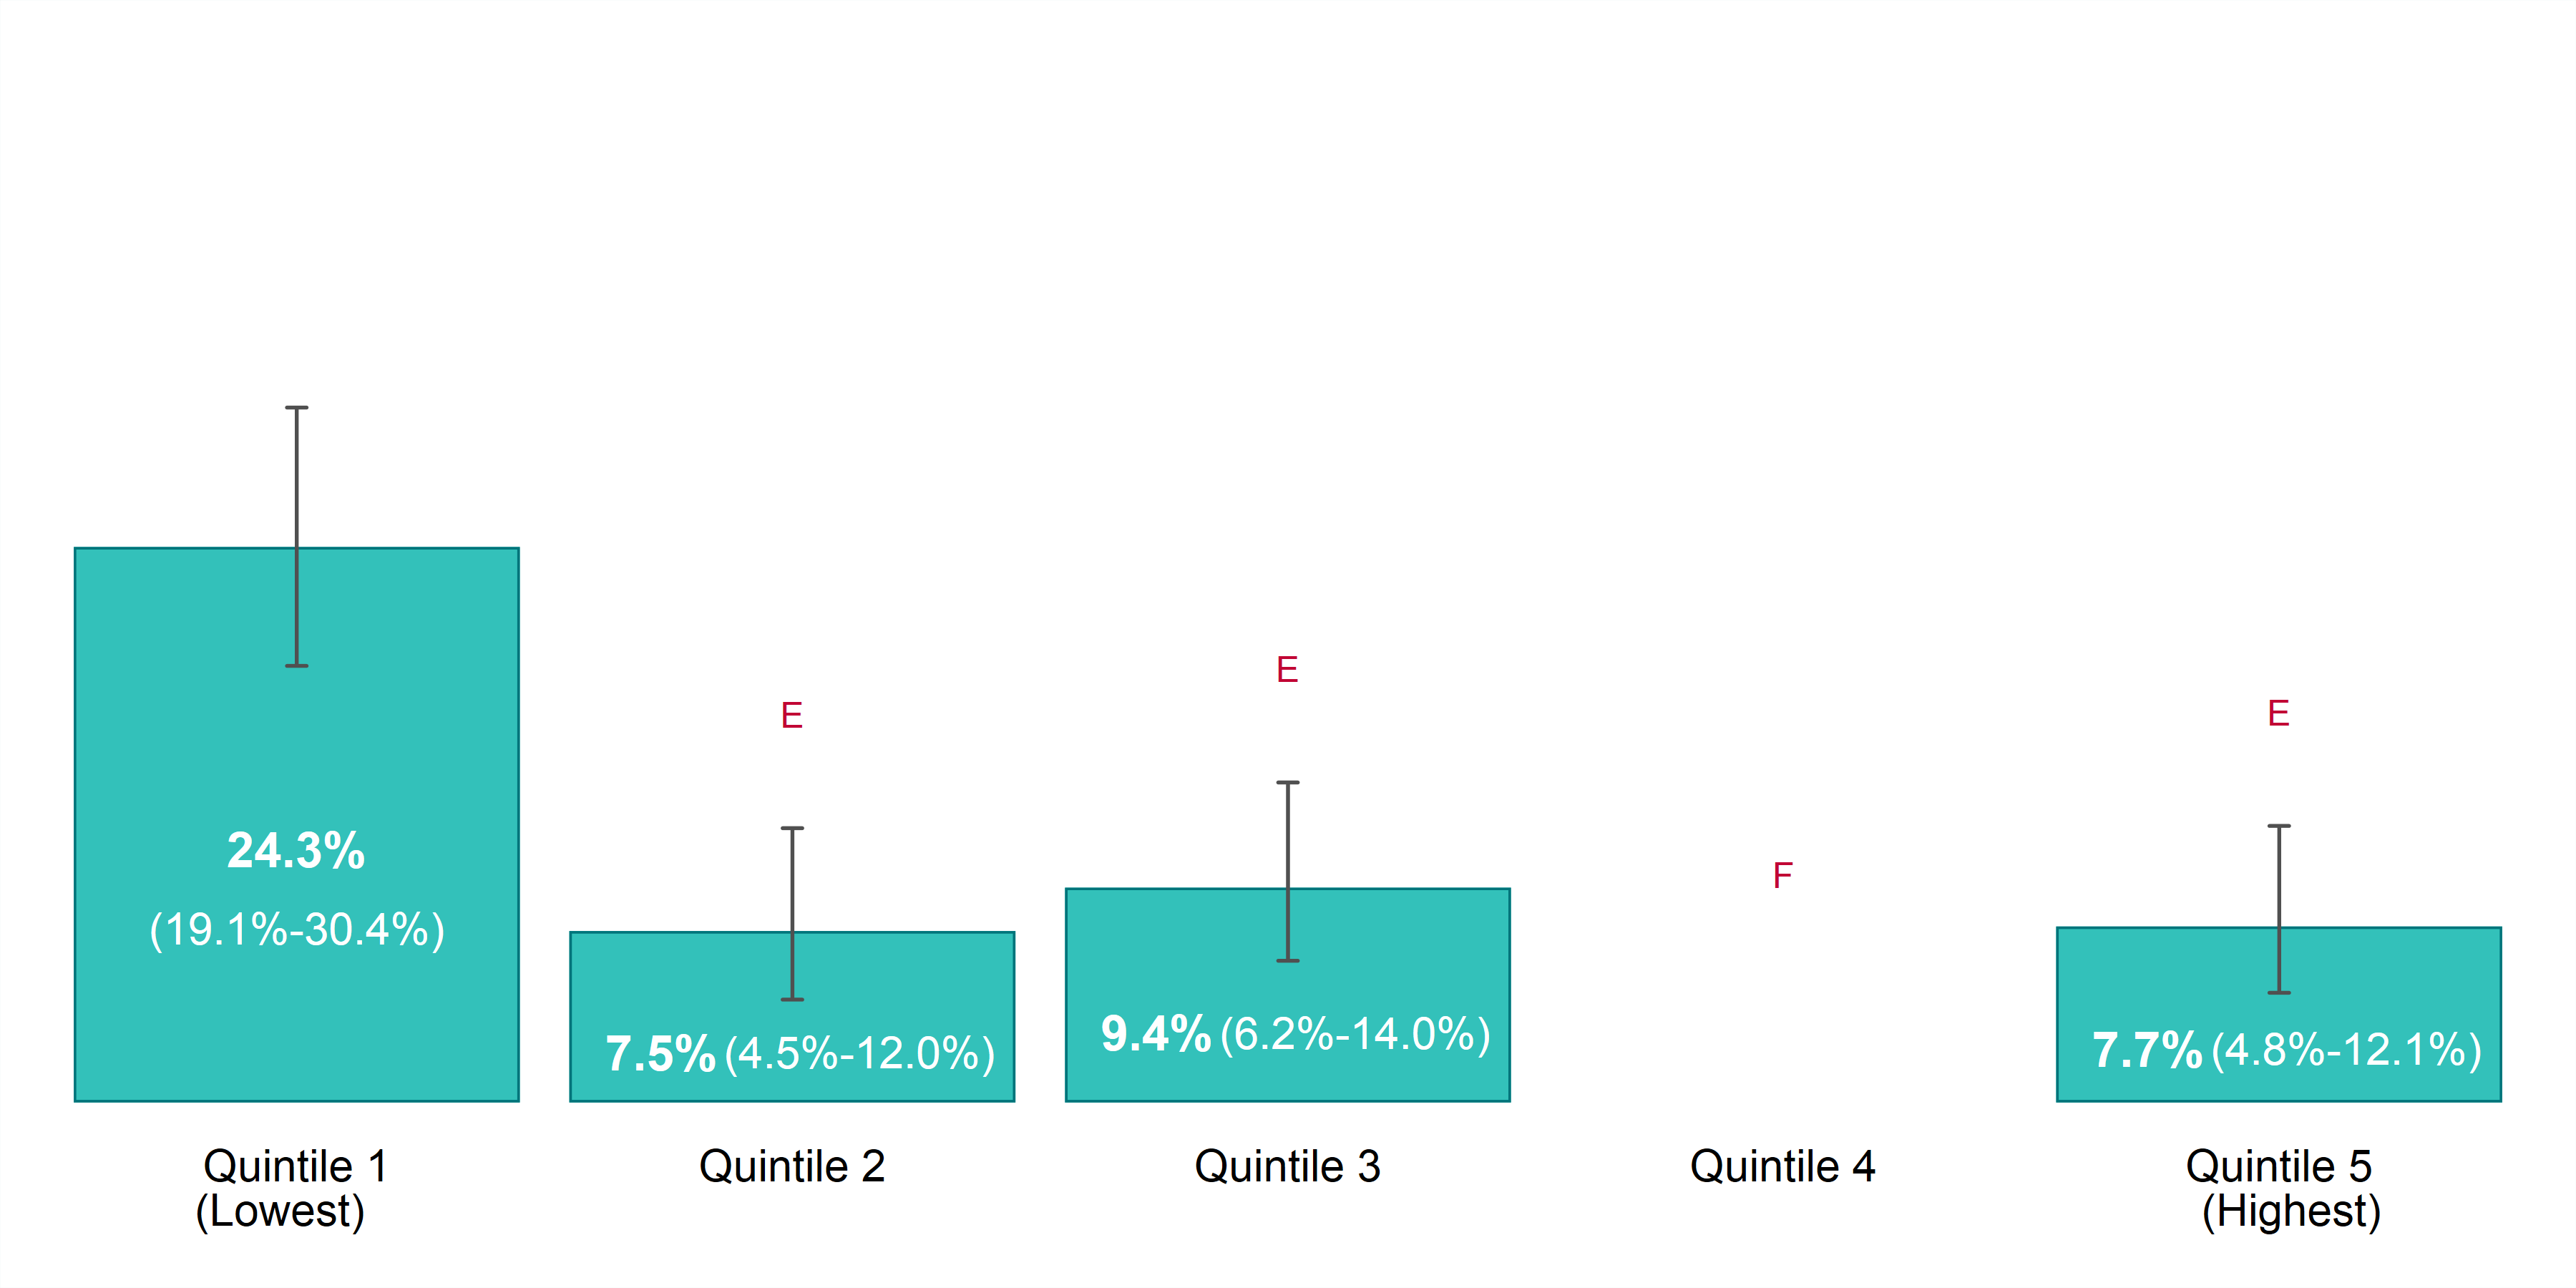
The results for anxiety disorders are no different. Anxiety disorders, such as phobia, obsessive-compulsive disorder, and panic disorder, are also highest among our community members living with the lowest levels of income in Sudbury and districts.
Figure 5. Prevalence rate, anxiety disorders, by year and household income, ages 12+, Sudbury and districts, 2011 to 2014
| Household Income Distribution | Prevalence Rate, 2011 to 2014 | CV - 2011 to 2014 |
|---|---|---|
| Quintile 1 (Lowest) | 24.3% (CI: 19.1% to 30.4%) | 12 |
| Quintile 2 | 7.5% E (CI: 4.5% to 12.0%) | 25 |
| Quintile 3 | 9.4% E (CI: 6.2% to 14.0%) | 21 |
| Quintile 4 | F | 39 |
| Quintile 5 (Highest) | 7.7% E (CI: 4.8% to 12.1%) | 24 |
*E: Estimates marked with E should be interpreted with caution due to high margin of error.
*F: Estimates for categories marked with F cannot be released due to an unacceptable margin of error.
Income Impacts Physical Health
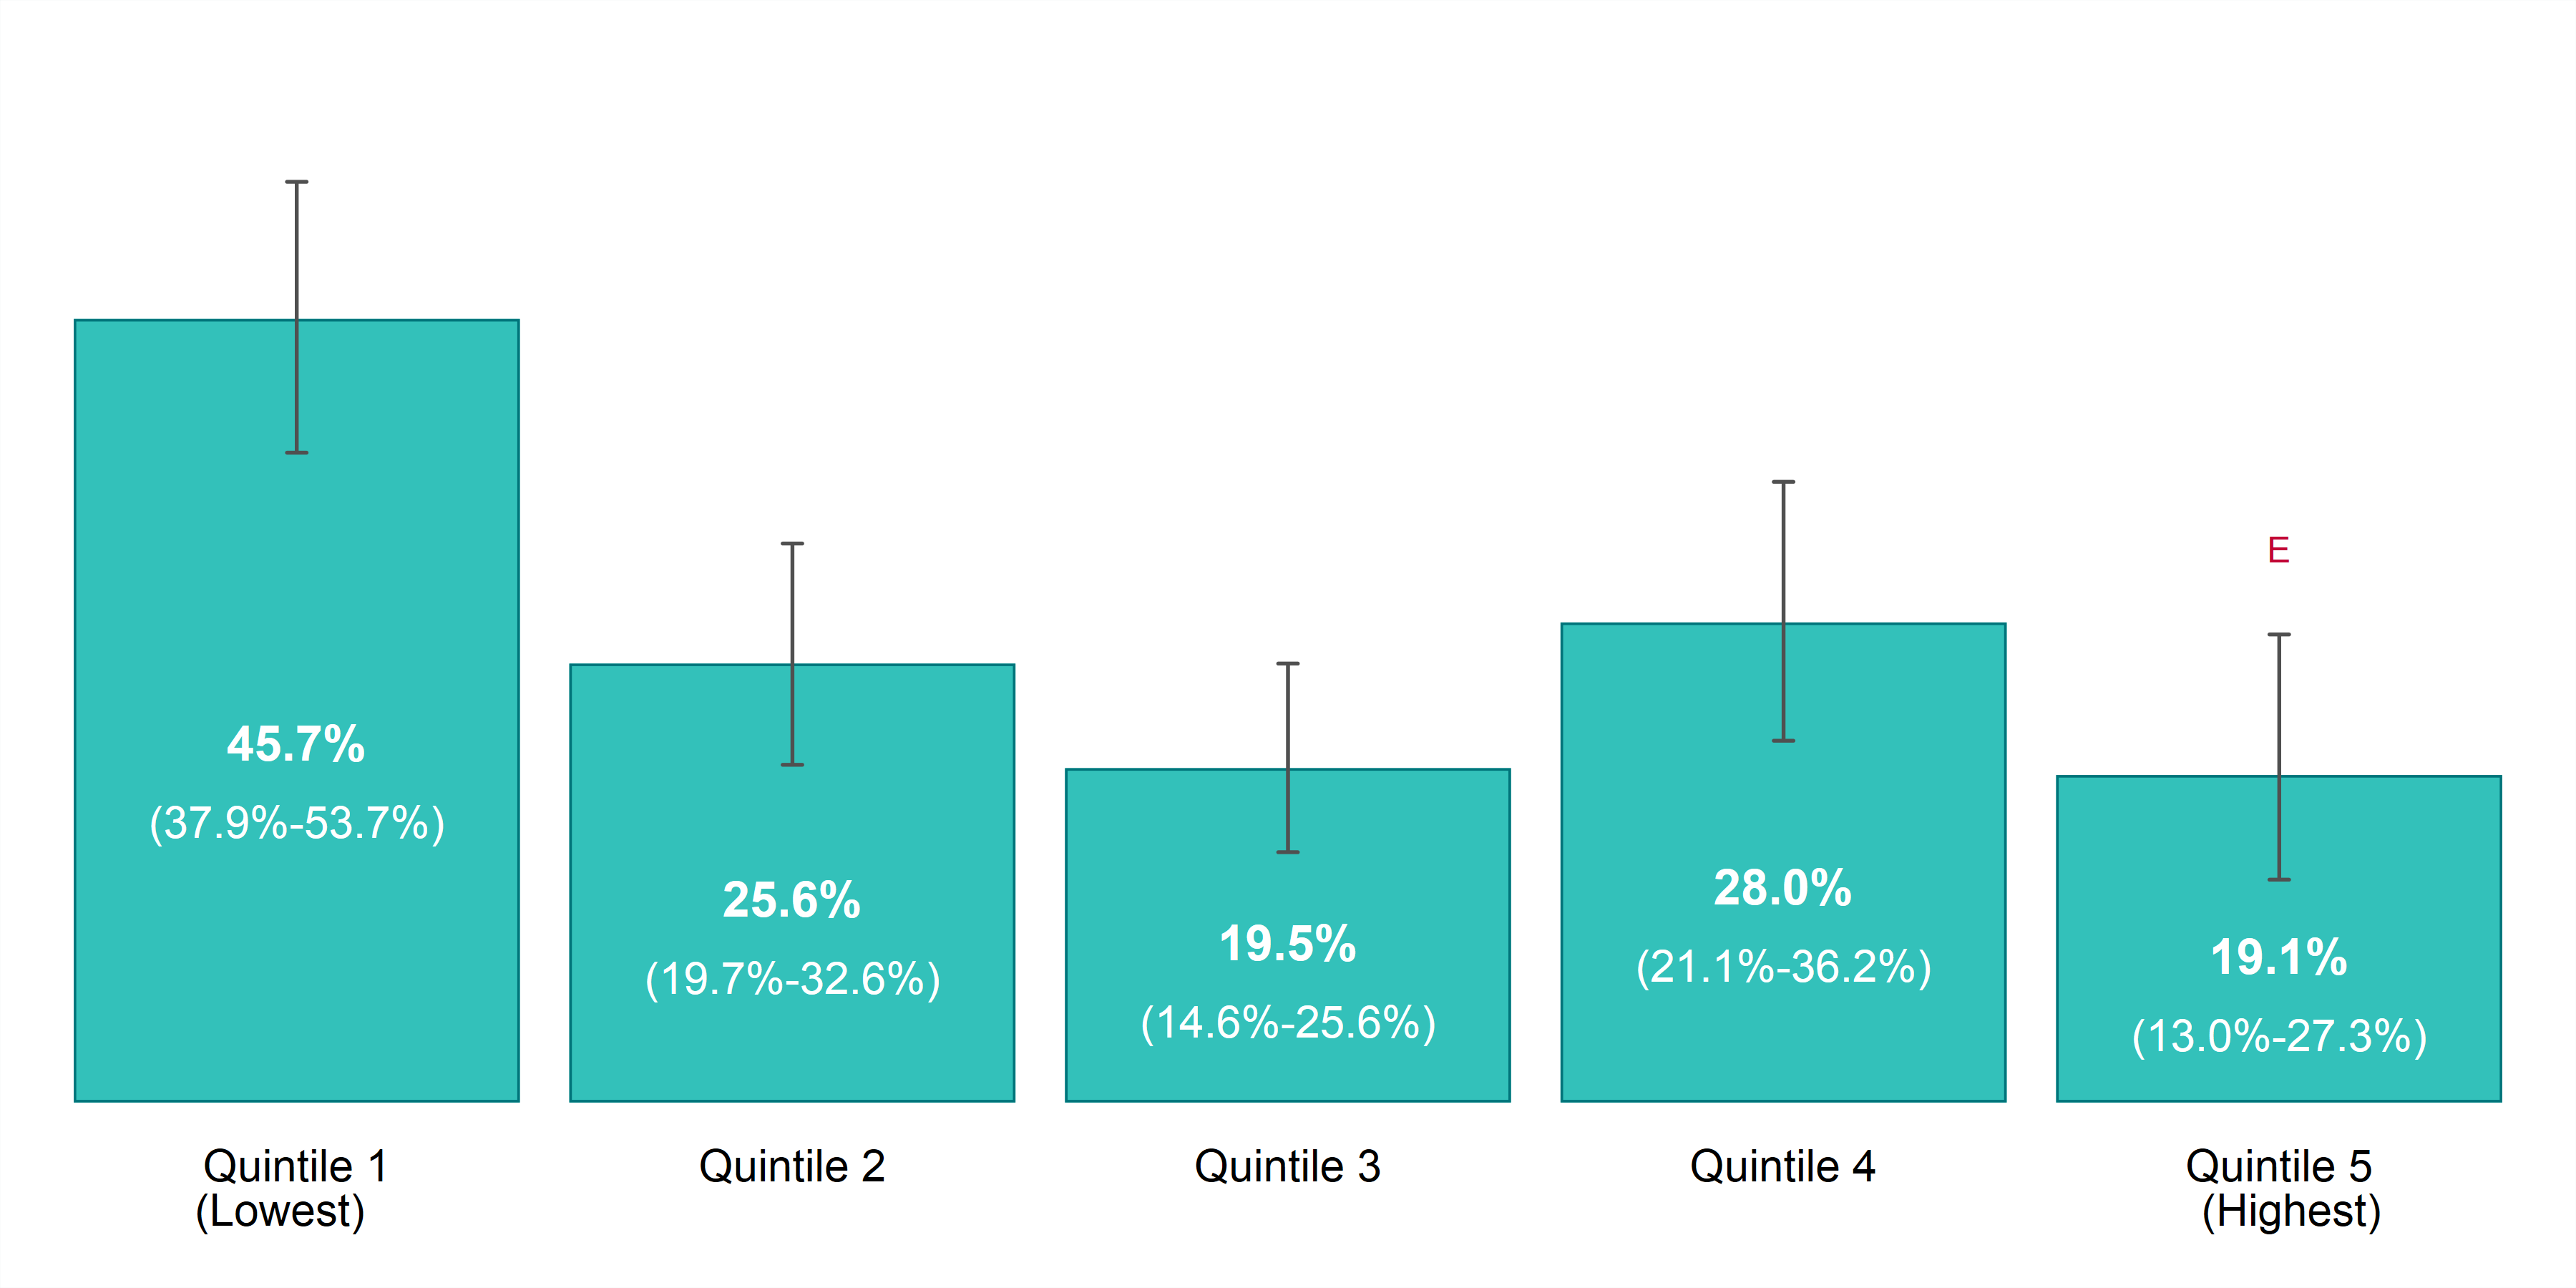
We know that in Sudbury and districts, the two leading causes of death are ischemic heart disease (heart attack) and lung cancer.12 The percentage of deaths from both diseases is higher in our communities than in Ontario.13 Lung cancer and heart attacks both contribute to the largest number of early deaths or potential years of life lost in Sudbury and districts.14 The most common cause of lung cancer is smoking,15 and we also know that physical activity helps prevent chronic diseases, like heart attacks.16
In Ontario, smoking is more common among the poorest people (22.1%) than the richest people (14.4%).17 Like results of previous factors thus far, these results are not unique. In Sudbury and districts, 25% of adults currently smoke, with the poorest people accounting for the highest rates and the richest people accounting for the lowest.
Figure 6. Prevalence rate, current smokers, by year and household income, ages 20+, Sudbury and districts, 2011 to 2014
| Household Income Distribution | Prevalence Rate, 2011 to 2014 | CV - 2011 to 2014 |
|---|---|---|
| Quintile 1 (Lowest) | 45.7% (CI: 37.9% to 53.7%) | 9 |
| Quintile 2 | 25.6% (CI: 19.7% to 32.6%) | 13 |
| Quintile 3 | 19.5% (CI: 14.6% to 25.6%) | 14 |
| Quintile 4 | 28.0% (CI: 21.1% to 36.2%) | 14 |
| Quintile 5 (Highest) | 19.1% E (CI: 13.0% to 27.3%) | 19 |
*E: Estimates marked with E should be interpreted with caution due to high margin of error.
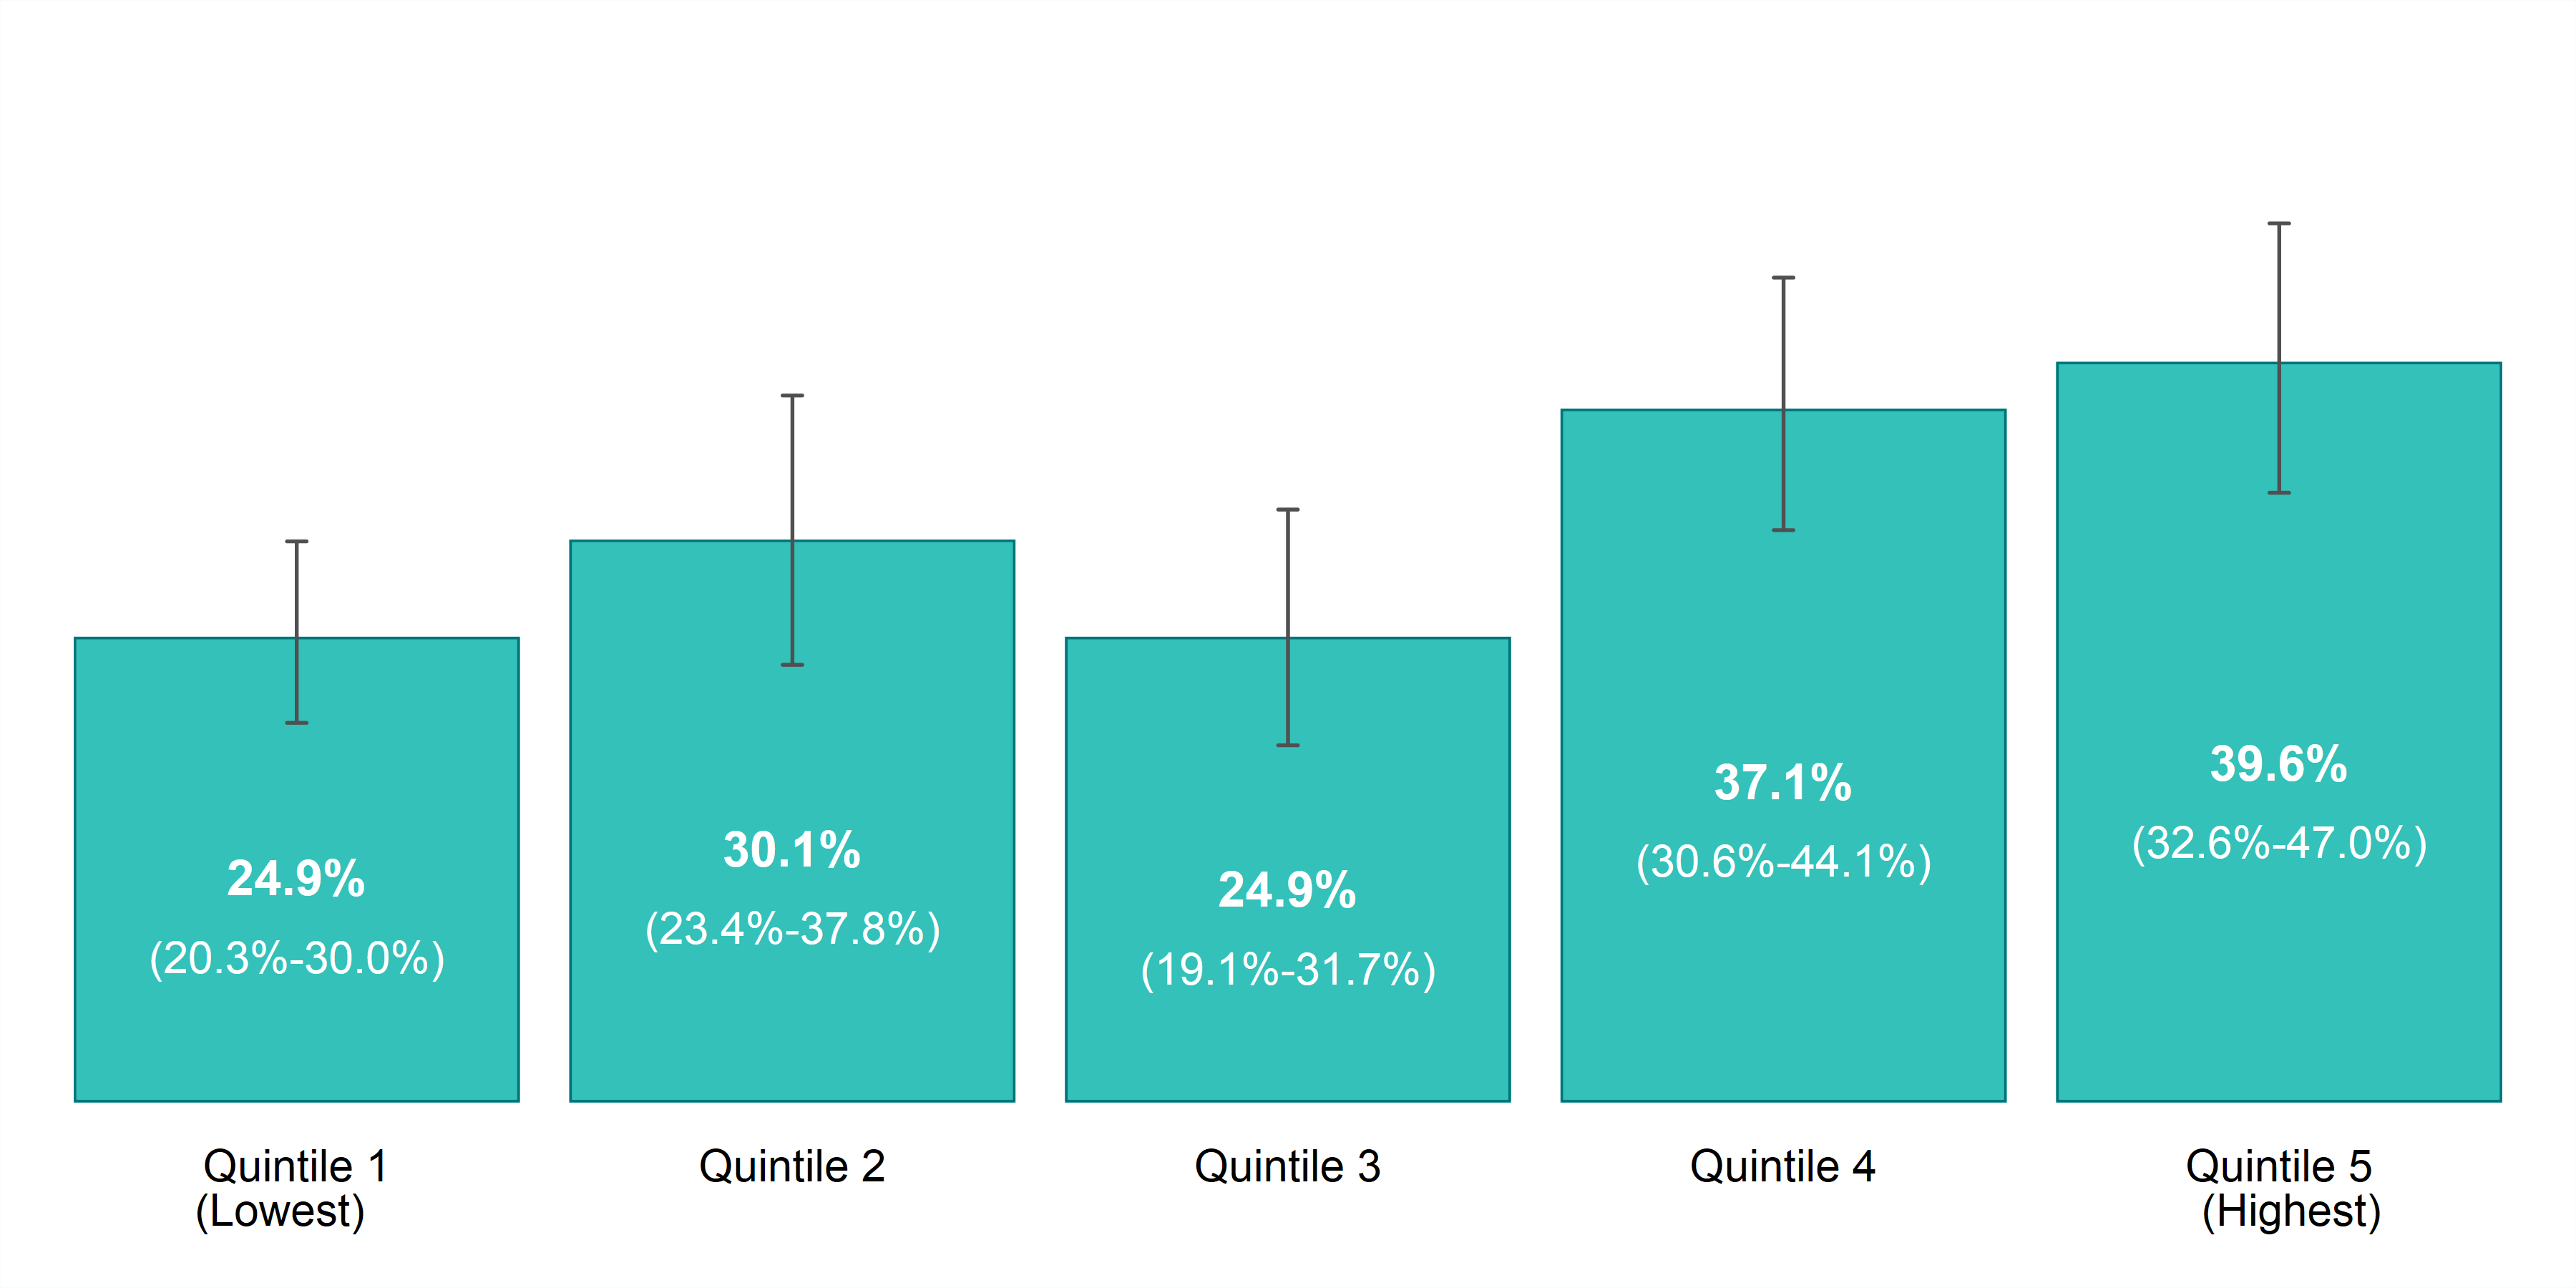
Several major chronic diseases, like heart attacks, are associated with physical inactivity, yet over half (54.7%) of the province’s poorest people remain more physically inactive than the richest people (32.1%).18 In Sudbury and districts, 43% of the population is inactive.19 The poorest households remain less physically active than the highest income households.
Figure 7. Prevalence rate, physically active individuals, by year and household income, ages 12+, Sudbury and districts, 2011 to 2014
| Household Income Distribution | Prevalence Rate, 2011 to 2014 | CV - 2011 to 2014 |
|---|---|---|
| Quintile 1 (Lowest) | 24.9% (CI: 20.3% to 30.0%) | 10 |
| Quintile 2 | 30.1% (CI: 23.4% to 37.8%) | 12 |
| Quintile 3 | 24.9% (CI: 19.1% to 31.7%) | 13 |
| Quintile 4 | 37.1% (CI: 30.6% to 44.1%) | 9 |
| Quintile 5 (Highest) | 39.6% (CI: 32.6% to 47.0%) | 9 |
It is well established that smoke-free living and regular physical activity are good for your health. The data show again the deep interconnectedness of income and physical health. Lack of income reduces our ability to cope. Taking part in regular physical activity and living smoke-free can be insurmountable when faced with the day-to-day challenges of living in poverty.
Regular physical activity can be very difficult to prioritize based on life circumstances and pressures. Also, most forms of physical activity necessitate the economic costs of time and money, which are often unaffordable for people living in poverty. Prioritizing health when living moment-by-moment in extreme material deprivation is often simply impossible. Social and economic resources make it easier to make the “healthy choice the easy choice”.
Higher rates of smoking
“I quit for over a month and then I got really stressed out and it was something I really could not handle, and I was like I don’t want to do drugs and I don’t want to drink, but I’m going to start smoking again.”
Less physically active
“I didn’t have exercise equipment, I would just be in the house for months sometimes because of my depression and anxiety.”
Income impacts how we feel about our health
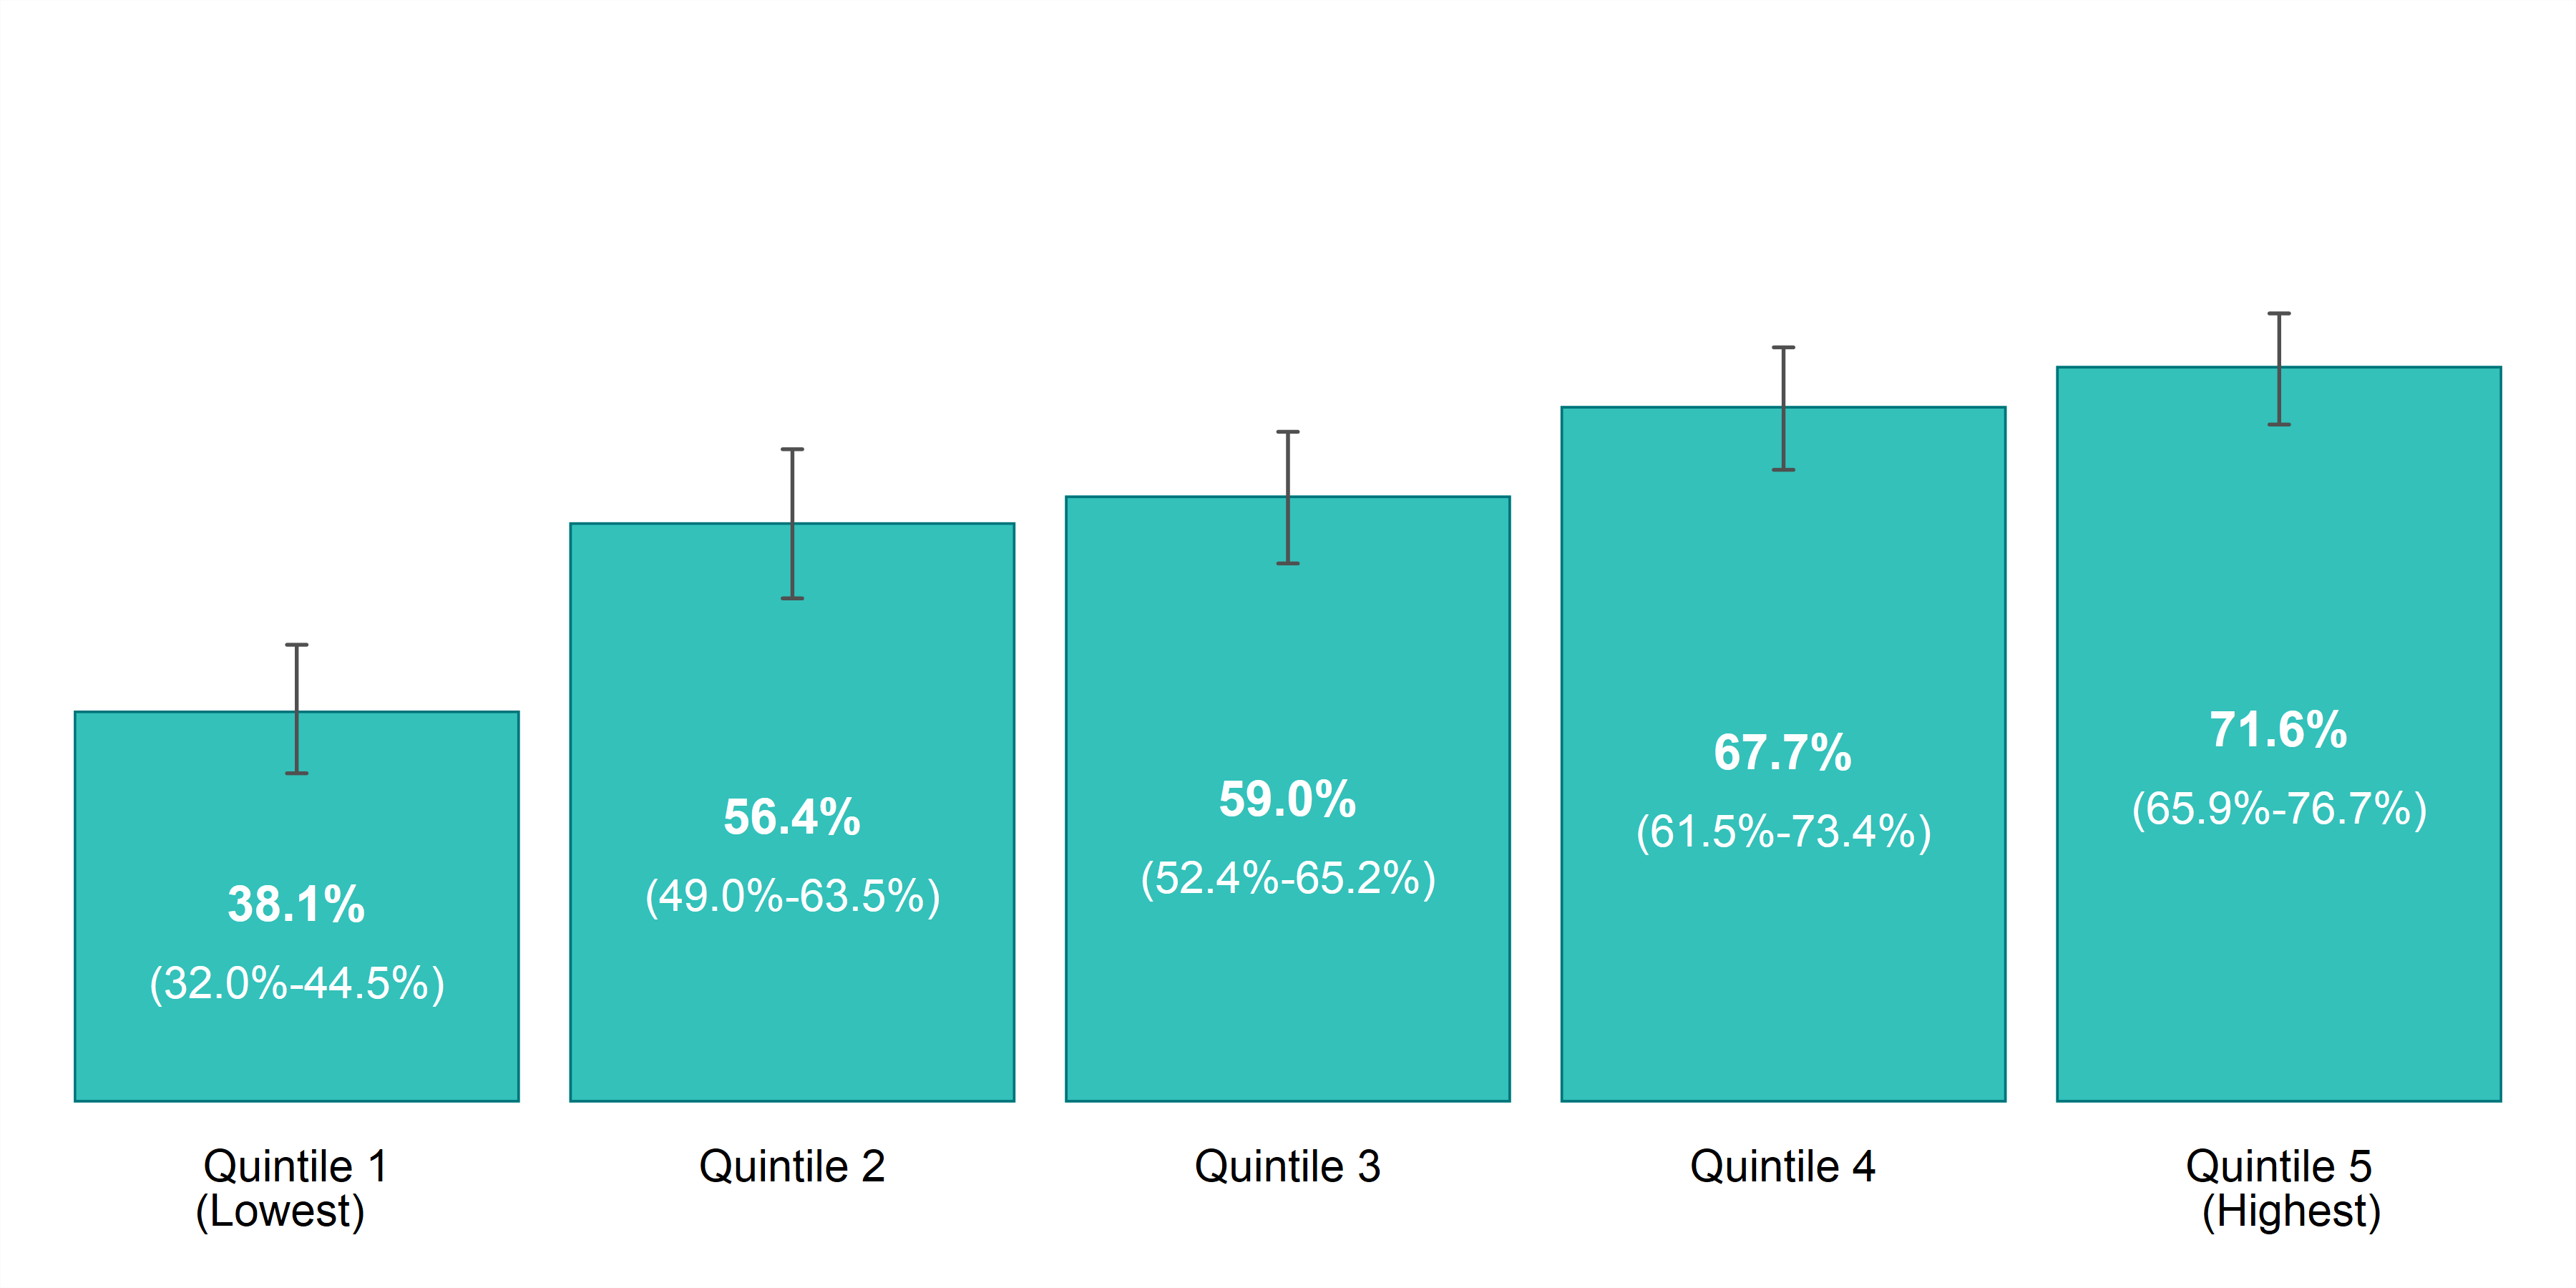
With everything considered thus far, it should not be surprising that only half (49.4%) of the poorest people in the province rate their health status as excellent or very good, compared to nearly three-quarters of the richest Ontarians (72.9%).20 The results in Sudbury and districts are similar, with fewer of the poorest households rating their health as excellent or very good, compared to the highest household income groups.
Poorer self-rated health
“My health has gone down so much that I’ve had to get dentures, from not eating properly, losing weight, all kinds of stuff.”
Lesser life satisfaction
“You feel stuck, you feel like there’s no hope, hope’s what keeps you going.”
~
“I have my babies and I have my health…but I’d be happier if I had more money for Christmas and food in my fridge.”
Figure 8. Prevalence rate, excellent or very good self-rated health, by year and household income, ages 12+, Sudbury and districts, 2011 to 2014
| Household Income Distribution | Prevalence Rate, 2011 to 2014 | CV - 2011 to 2014 |
|---|---|---|
| Quintile 1 (Lowest) | 38.1% (CI: 32.0% to 44.5%) | 8 |
| Quintile 2 | 56.4% (CI: 49.0% to 63.5%) | 7 |
| Quintile 3 | 59.0% (CI: 52.4% to 65.2%) | 6 |
| Quintile 4 | 67.7% (CI: 61.5% to 73.4%) | 5 |
| Quintile 5 (Highest) | 71.6% (CI: 65.9% to 76.7%) | 4 |
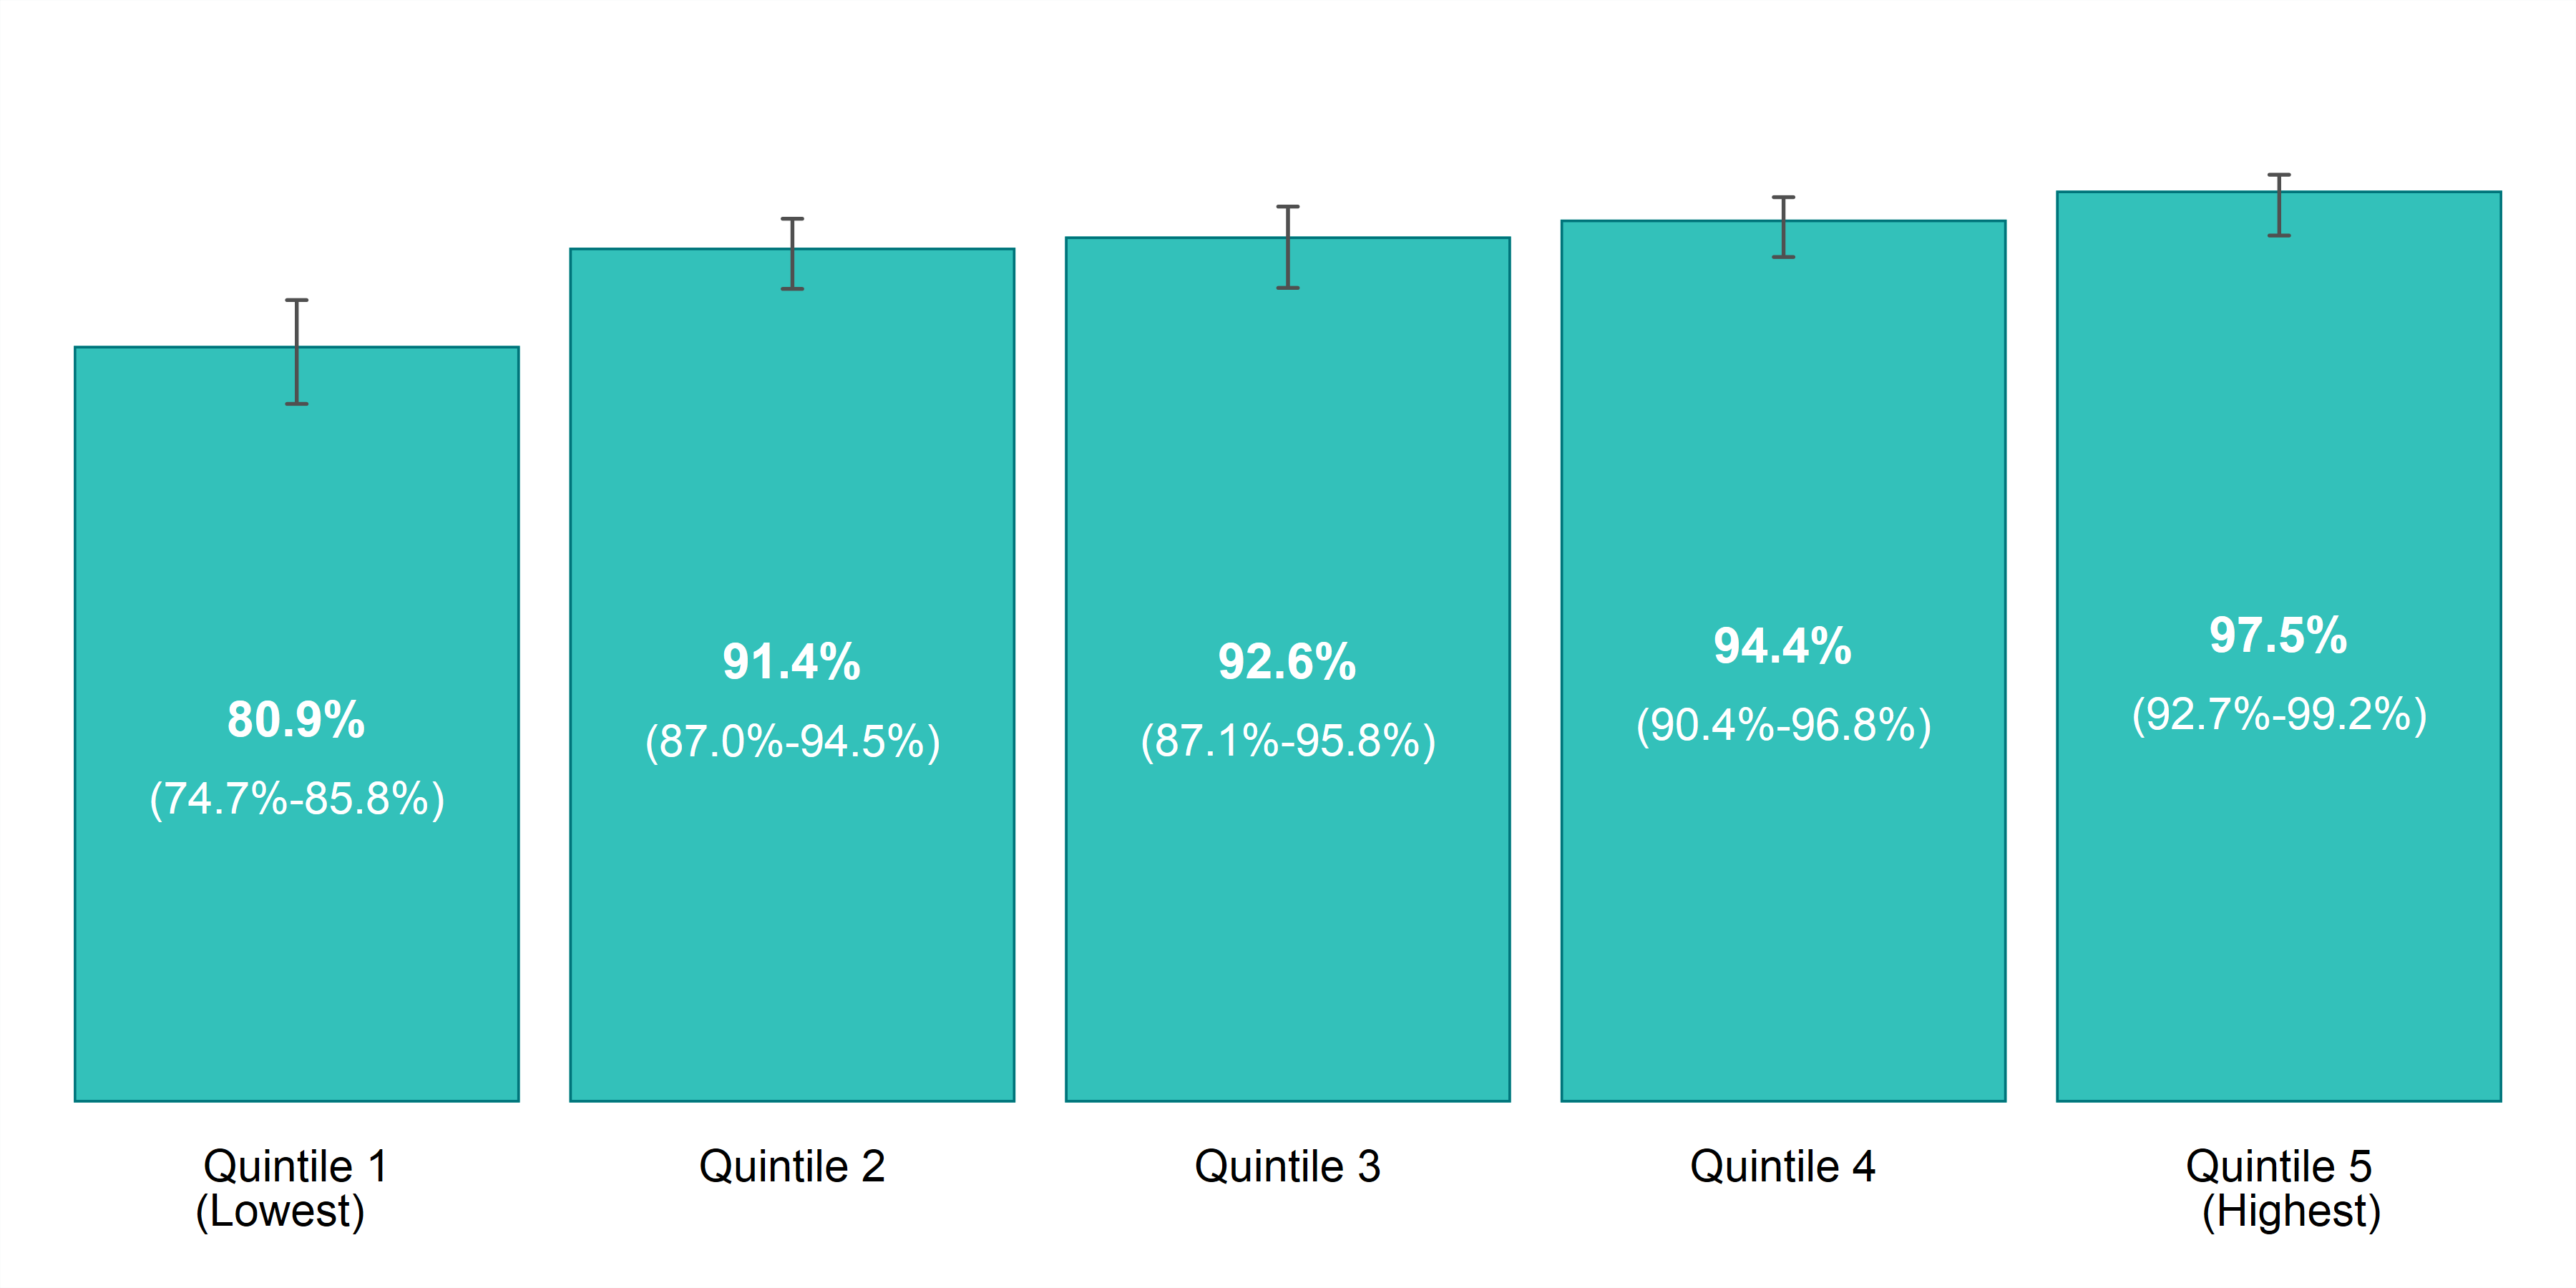
The lowest income households also rate their life satisfaction lower than in any of the highest income categories.
Figure 9. Prevalence rate, life satisfaction (very satisfied or satisfied), by year and household income, ages 12+, Sudbury and districts, 2011 to 2014
| Household Income Distribution | Prevalence Rate, 2011 to 2014 | CV - 2011 to 2014 |
|---|---|---|
| Quintile 1 (Lowest) | 80.9% (CI: 74.7% to 85.8%) | 3 |
| Quintile 2 | 91.4% (CI: 87.0% to 94.5%) | 2 |
| Quintile 3 | 92.6% (CI: 87.1% to 95.8%) | 2 |
| Quintile 4 | 94.4% (CI: 90.4% to 96.8%) | 2 |
| Quintile 5 (Highest) | 97.5% (CI: 92.7% to 99.2%) | 1 |
Income matters
Not everyone has equal opportunities for health. Income is a powerful determinant of health and one that is modifiable through the decisions we make as a society. Income solutions to health disparities offer the added benefit of incorporating the health enhancing influence of employment itself and the material means to support healthy decisions.
Local data reveal that poor mental and physical health disproportionately affect people who are living in poverty. In general, people living in low income die earlier,21 are sicker throughout their lives,22 and have poorer life satisfaction compared to the richest people. Working to address health through income solutions is critical. Poverty is simply too expensive to ignore. Poverty is not only killing us, but it is costing society billions, an estimated $27.1–$33 billion per year in Ontario.23 Reducing poverty and its harm to health is possible only through the concerted efforts of all of us.
Reducing poverty will allow everyone to live with dignity and meet their basic needs and prevent undue suffering of poor health throughout the lifecourse. Poverty reduction also offers a clear return on investment by reducing taxpayers’ dollars that go directly into resource-intensive emergency support services that treat the consequences of poverty, like emergency medical services, shelters, social supports, and the justice system. Addressing poverty and improving health also benefits employers in our communities through healthier employees, reduced absenteeism, increased productivity, and increased employee retention.
No single sector or agency can reduce poverty alone. Action across multiple sectors is required to collectively reduce poverty and minimize the impacts of low income on mental and physical health. Improvements in the health of individuals and the health of communities must include action on factors beyond biology and access to the health care system. Data helps us understand these factors and assess where we can take effective action. Healthy people contribute their skills and talents to advancing our society, they actively participate in our communities’ economies, and they use fewer health care resources. It is not only the poorest among us who are affected, but all of us.
This report is intended to help planners, leaders and everyday people use local data to inspire meaningful action. Strengthening knowledge and increasing awareness about what impacts our health builds capacity, fosters understanding, and reduces stigma about social and economic influences and promotes dialogue and action. Promoting and protecting health and preventing disease for all means creating better income-based health opportunities for everyone.
Methodological Notes
| Methodology Notes | Corresponding Indicators |
|---|---|
| Rates are age-standardized using the 2011 Canadian population. Data source: Canadian Community Health Survey (CCHS), 2007 to 2014, Statistics Canada, Share File, Ontario Ministry of Health and Long-Term Care. | Adult current smokers by household income; Physical activity by household income; Self-rated health by household income; Self-rated mental health (excellent or very good) by household income; Life satisfaction (very satisfied or satisfied) by household income; Mood disorders by household income; Anxiety disorders by household income |
| Rates are for the population aged 20 years and older. | Adult current smokers by household income |
| Rates are for the population aged 12 years and older. | Physical activity by household income; Self-rated health by household income; Self-rated mental health (excellent or very good) by household income; Life satisfaction (very satisfied or satisfied) by household income; Mood disorders by household income; Anxiety disorders by household income |
| In this analysis, individuals are divided into “income quintiles”, or five groups of roughly equal size based on their reported household income. The groups are ranked, so that Quintile 1 represents the 20% of the population with the lowest incomes, and Quintile 5 represents the 20% with the highest incomes. | Adult current smokers by household income; Physical activity by household income; Self-rated health by household income; Self-rated mental health (excellent or very good) by household income; Life satisfaction (very satisfied or satisfied) by household income; Mood disorders by household income; Anxiety disorders by household income |
Board of Health Motion: Opportunities for Health for all Poverty Reduction
Motion #53-19
Approved by Board of Health for Public Health Sudbury & Districts, November 21, 2019.
WHEREAS income is one of the strongest predictors of health and local data show that low income is associated with an increased risk of poor physical and mental health in Sudbury and districts; and
WHEREAS Public Health Sudbury & Districts annual Nutritious Food Basket reports demonstrate that individuals and families reliant on the current provincial social assistance rates or that earn a minimum wage will experience challenges in supporting their health including meeting their nutrition requirements; and
WHEREAS income solutions incorporate the health enhancing influence of work while addressing food security and the health damaging impacts of insufficient income; and
WHEREAS the Sudbury Workers Education and Advocacy Centre calculated a living wage for Sudbury of $16.98 (current provincial minimum is $14.00), and the City of Greater Sudbury proclaimed November 3 – 9, 2019 as Living Wage Week; and
THEREFORE BE IT RESOLVED that the Board of Health for Public Health Sudbury & Districts formally endorse the principle of living wage employment and direct the Medical Officer of Health to pursue certification; and
FURTHER that the Board encourage all employers across our service area to recognize the serious health and societal costs of inadequate income.
References
Braveman, P., & Gottlieb, L. (2014). The social determinants of health: it’s time to consider the causes of the causes. Public health reports (Washington, D.C.: 1974), 129 Suppl 2 (Suppl 2), 19–31. doi:10.1177/00333549141291S206
Canadian Mental Health Association, Ontario. (2007, November). Backgrounder: Poverty and mental illness. Retrieved from https://ontario.cmha.ca/documents/poverty-and-mental-illness/
Health Quality Ontario. (2016). Income and Health: Opportunities to achieve health equity in Ontario. Toronto: Queen’s Printer for Ontario. Retrieved from https://www.hqontario.ca/Portals/0/documents/system-performance/health-equity-report-en.pdf
Lee, C.R., & Briggs, A. (2019). The Cost of Poverty in Ontario: 10 Years Later. Feed Ontario: Toronto, Ontario. Retrieved from https://feedontario.ca/cost-of-poverty-2019/
Mikkonen, J., Raphael, D. (2010). Social determinants of health: The Canadian facts. Toronto.
York University School of Health Policy and Management. Retrieved from https://thecanadianfacts.org/The_Canadian_Facts.pdf
Ontario Ministry of Health and Long-Term Care (2018). Health equity guideline.
Retrieved from http://www.health.gov.on.ca/en/pro/programs/publichealth /oph_standards /docs/protocols_guidelines/Health_Equity_Guideline_2018_en.pdf
Public Health Sudbury & Districts. (2018, March 26). Leading causes of death. Retrieved from
https://www.phsd.ca/resources/research-statistics/health-statistics/public-health-sudbury-districts-population-health-profile/mortality/leading-causes-of-death
Public Health Sudbury & Districts. (2018, March 26). Lung cancer. Retrieved from
https://www.phsd.ca/resources/research-statistics/health-statistics/public-health-sudbury-districts-population-health-profile/cancer/lung-cancer
Public Health Sudbury & Districts. (2018, April 24). Physical activity counselling and exercise prescription for adults. Retrieved from https://www.phsd.ca/professionals/health-professionals/screening-tools/physical-activity-counselling-and-exercise-prescription-for-adults
Public Health Sudbury & Districts. (2018, August 22). Physical activity. Retrieved from
https://www.phsd.ca/resources/research-statistics/health-statistics/public-health-sudbury-districts-population-health-profile/health-behaviours/physical-activity
Public Health Sudbury & Districts. (2019, July 16). Health equity. Retrieved from
https://www.phsd.ca/health-topics-programs/health-equity
Public Health Sudbury & Districts. (2019). Public Mental Health Action Framework. Retrieved from https://www.phsd.ca/health-topics-programs/mental-health
Endnotes
- Public Health Sudbury & Districts. (2019, July 16). Health equity. Retrieved from https://www.phsd.ca/health-topics-programs/health-equity
- Braveman, P., & Gottlieb, L. (2014). The social determinants of health: it’s time to consider the causes of the causes. Public health reports (Washington, D.C.: 1974), 129 Suppl 2(Suppl 2), 19–31.doi:10.1177/00333549141291S206
- Public Health Sudbury & Districts. (2019). Public Mental Health Action Framework. Retrieved from https://www.phsd.ca/health-topics-programs/mental-health
- Ontario Ministry of Health and Long-Term Care (2018). Health equity guideline. Retrieved from http://www.health.gov.on.ca/en/pro/programs/publichealth /oph_standards /docs/protocols_guidelines/Health_Equity_Guideline_2018_en.pdf
- Public Health Sudbury & Districts. (2019, July 16). Health equity. Retrieved from https://www.phsd.ca/health-topics-programs/health-equity
- Public Health Sudbury & Districts. (2019, July 16). Health equity. Retrieved from https://www.phsd.ca/health-topics-programs/health-equity
- Mikkonen, J., Raphael, D. (2010). Social determinants of health: The Canadian facts. Toronto. York University School of Health Policy and Management. Retrieved from https://thecanadianfacts.org/The_Canadian_Facts.pdf
- Canadian Mental Health Association, Ontario. (2007, November). Backgrounder: Poverty and mental illness. Retrieved from https://ontario.cmha.ca/documents/poverty-and-mental-illness/
- Public Health Sudbury & Districts. (2019). Public Mental Health Action Framework. Retrieved from https://www.phsd.ca/health-topics-programs/mental-health
- Health Quality Ontario. (2016). Income and Health: Opportunities to achieve health equity in Ontario. Toronto: Queen’s Printer for Ontario. Retrieved from https://www.hqontario.ca/Portals/0/documents/system-performance/health-equity-report-en.pdf
- Health Quality Ontario. (2016). Income and Health: Opportunities to achieve health equity in Ontario. Toronto: Queen’s Printer for Ontario. Retrieved from https://www.hqontario.ca/Portals/0/documents/system-performance/health-equity-report-en.pdf
- Public Health Sudbury & Districts. (2018, March 26). Leading causes of death. Retrieved from https://www.phsd.ca/resources/research-statistics/health-statistics/public-health-sudbury-districts-population-health-profile/mortality/leading-causes-of-death
- Public Health Sudbury & Districts. (2018, March 26). Leading causes of death. Retrieved from https://www.phsd.ca/resources/research-statistics/health-statistics/public-health-sudbury-districts-population-health-profile/mortality/leading-causes-of-death
- Public Health Sudbury & Districts. (2018, March 26). Leading causes of death. Retrieved from https://www.phsd.ca/resources/research-statistics/health-statistics/public-health-sudbury-districts-population-health-profile/mortality/leading-causes-of-death
- Public Health Sudbury & Districts. (2018, March 26). Lung cancer. Retrieved from https://www.phsd.ca/resources/research-statistics/health-statistics/public-health-sudbury-districts-population-health-profile/cancer/lung-cancer
- Public Health Sudbury & Districts. (2018, April 24). Physical activity counselling and exercise prescription for adults. Retrieved from https://www.phsd.ca/professionals/health-professionals/screening-tools/physical-activity-counselling-and-exercise-prescription-for-adults
- Health Quality Ontario. (2016). Income and Health: Opportunities to achieve health equity in Ontario. Toronto: Queen’s Printer for Ontario. Retrieved from https://www.hqontario.ca/Portals/0/documents/system-performance/health-equity-report-en.pdf
- Health Quality Ontario. (2016). Income and Health: Opportunities to achieve health equity in Ontario. Toronto: Queen’s Printer for Ontario. Retrieved from https://www.hqontario.ca/Portals/0/documents/system-performance/health-equity-report-en.pdf
- Public Health Sudbury & Districts. (2018, August 22). Physical activity. Retrieved from https://www.phsd.ca/resources/research-statistics/health-statistics/public-health-sudbury-districts-population-health-profile/health-behaviours/physical-activity
- Health Quality Ontario. (2016). Income and Health: Opportunities to achieve health equity in Ontario. Toronto: Queen’s Printer for Ontario. Retrieved from https://www.hqontario.ca/Portals/0/documents/system-performance/health-equity-report-en.pdf
- Public Health Sudbury & Districts. (2017, June 15). We cannot afford not to act – minimum wage and basic income. Retrieved from https://www.phsd.ca/news/cannot-afford-not-act-minimum-wage-basic-income
- Public Health Sudbury & Districts. (2017, June 15). We cannot afford not to act – minimum wage and basic income. Retrieved from https://www.phsd.ca/news/cannot-afford-not-act-minimum-wage-basic-income
- Lee, C.R., & Briggs, A. (2019). The Cost of Poverty in Ontario: 10 Years Later. Feed Ontario: Toronto, Ontario. Retrieved from https://feedontario.ca/cost-of-poverty-2019/
The quotes appearing in this report were shared by Circles Sudbury participants.
Circles Sudbury is a program designed to provide individuals living in poverty with social support and practical tools to transition into economic self-sufficiency through education and employment pathways. Circles helps participants assess their current resources, learn how to build on their resources and create a personal action plan based on their hopes for a prosperous future to exit poverty. Circles supports participants with service navigation, added layers of social support, and community connections. Participants are matched with one or two community volunteers who serve as Allies. Volunteers provide support through coaching, friendship, and practical and emotional support. The goal for Circles participants is to achieve economic self-sufficiency within 18–48 months of joining the program. Participants and their children, volunteers, and staff attend Circles meetings three times per month for a shared meal and programming. Support between meetings is provided to Circles participants by staff and volunteers tailored to meet the needs of each participant.
Circles Sudbury is delivered by Public Health Sudbury & Districts with support from community partners from the Partners to End Poverty Steering Committee. The introduction of the Circles Sudbury initiative was made possible through financial support from Ontario’s Poverty Reduction Fund. For more information visit www.phsd.ca/change
This item was last modified on May 6, 2024