Chlamydia
Chlamydia is a sexually transmitted infection (STI) caused by bacteria. It is the most common and frequently reported STI. Transmission occurs primarily through sexual contact and infection often goes unnoticed as many people have no symptoms. When symptoms do occur, they include unusual bleeding or discharge, painful urination, and lower abdominal pain. If left untreated, the infection can cause serious complications.
As many people don’t know they are infected, they don’t get tested, so the infection is likely under-reported. Early detection and prompt treatment are key to preventing the spread of infection. Urine-based testing has increased the accessibility and ease of testing. Only laboratory confirmed cases are reported.
Testing is free of charge and can be accessed through a health care provider, sexual health clinic or community health centre.
Chlamydia cases by geographic area
Key findings:
- In the SDHU area, there were 662 confirmed cases of chlamydia in 2015.
- In 2015, the rate of chlamydia in the SDHU area was 347 per 100,000 population.
- The rate of chlamydia in the SDHU area has been lower than the rate in northeastern Ontario, while the rate in both the SDHU area and northeastern Ontario have consistently been higher than that of Ontario.
- Between 2006 and 2015, the rate of chlamydia in the SDHU area has increased.
Note:
- Rates are age standardized using 2011 Canadian population.
- Data Source: Infectious Diseases Query, Public Health Ontario, Extracted Feb. 2016, and Population Estimates and Projections, Ontario Ministry of Health and Long-Term Care: IntelliHEALTH ONTARIO, Extracted Sep. 2015.
Figure: Annual age standardized rate, chlamydia, by geographic area, 2006–2015
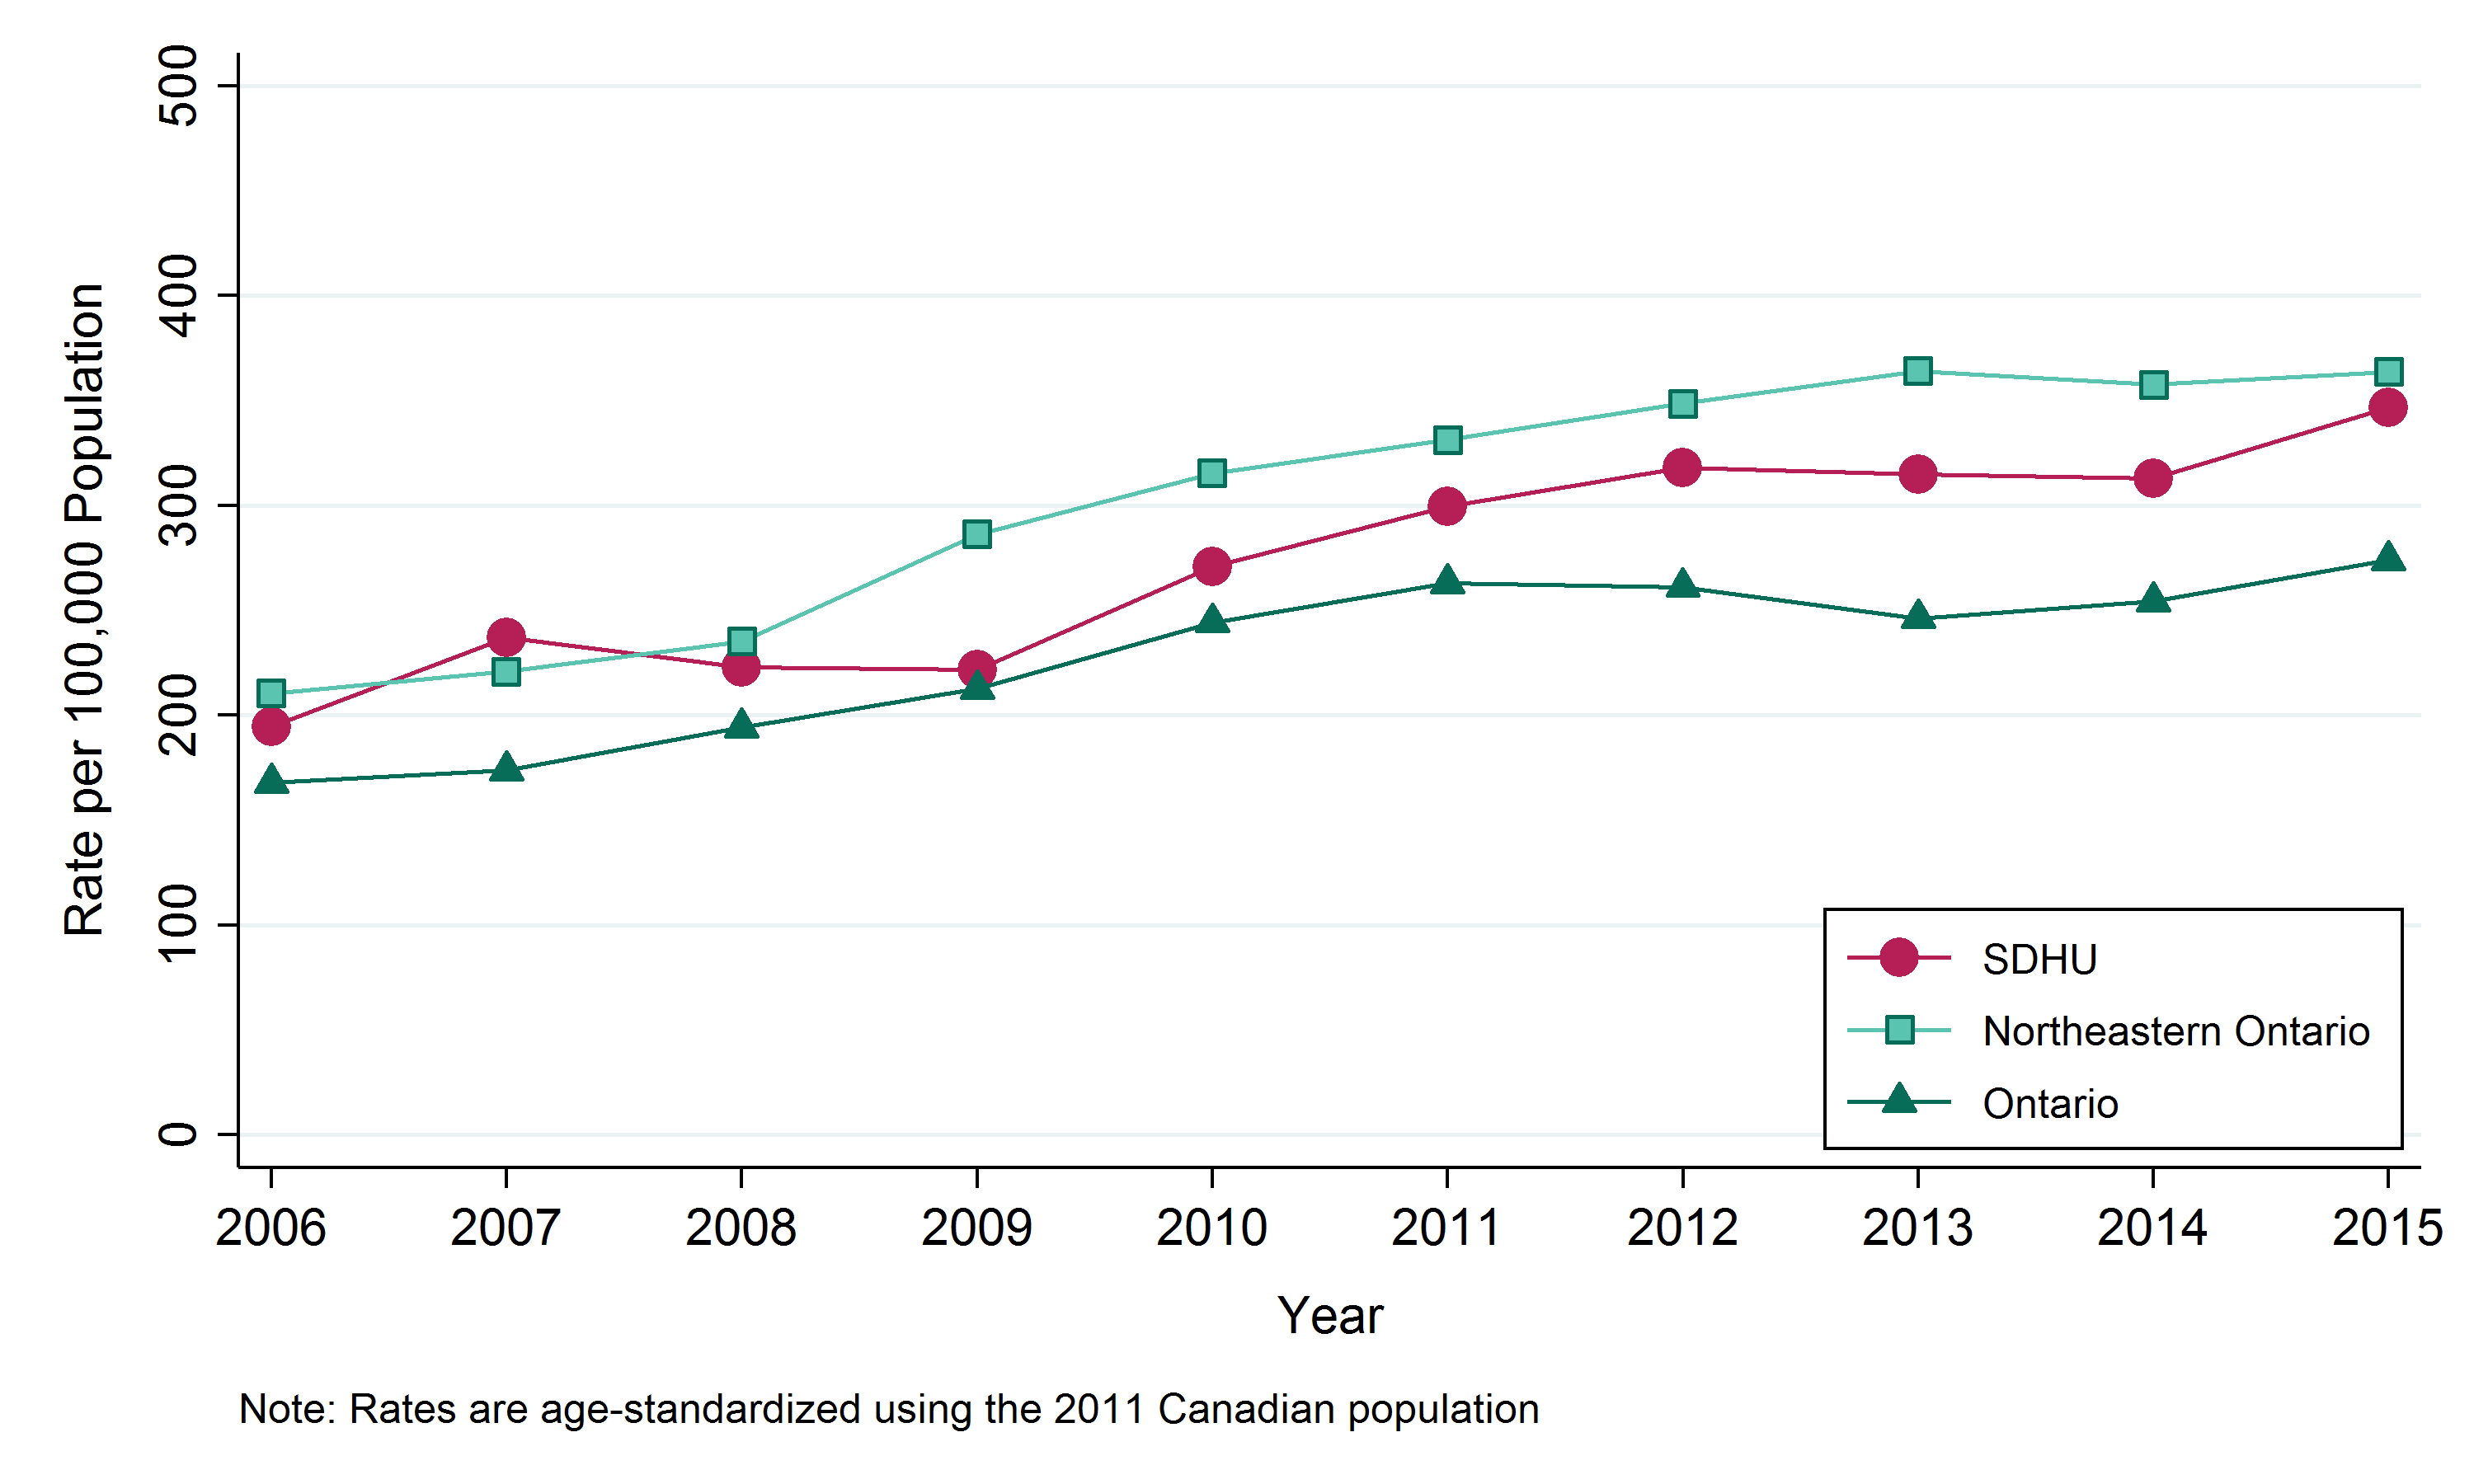
Table: Annual age standardized rate, chlamydia, by geographic area, 2006-2015
| Geographic Region | 2006 | 2007 | 2008 | 2009 | 2010 | 2011 | 2012 | 2013 | 2014 | 2015 |
|---|---|---|---|---|---|---|---|---|---|---|
| SDHU | 194.4 | 237.2 | 222.9 | 221.7 | 270.9 | 299.4 | 318.1 | 315.0 | 312.9 | 346.7 |
| Northeast | 210.4 | 220.8 | 235.2 | 286.2 | 315.4 | 331.3 | 348.6 | 364.1 | 357.4 | 363.6 |
| Ontario | 167.9 | 173.7 | 194.2 | 212.6 | 244.3 | 263.1 | 261.2 | 246.3 | 254.2 | 273.9 |
Table: Annual number of cases of chlamydia, by geographic area, 2006–2015
| Geographic Region | 2006 | 2007 | 2008 | 2009 | 2010 | 2011 | 2012 | 2013 | 2014 | 2015 |
|---|---|---|---|---|---|---|---|---|---|---|
| SDHU | 385 | 472 | 447 | 443 | 533 | 588 | 626 | 616 | 608 | 662 |
| Northeast | 1160 | 1219 | 1298 | 1568 | 1711 | 1784 | 1867 | 1933 | 1880 | 1881 |
| Ontario | 22397 | 23283 | 26161 | 28794 | 33461 | 36377 | 36540 | 34647 | 35908 | 38814 |
Chlamydia cases by sex
Key findings:
- Between 2011 and 2015, there were a total of 1082 males and 2018 females diagnosed with chlamydia in the SDHU area, an average of 216 males and 404 females per year.
- In the SDHU area, the annual rate of chlamydia between 2011 and 2015 was 220 per 100 000 males and 442 per 100,000 females.
- The rate of chlamydia among females has consistently been higher than the rate among males.
- Between the time periods 2006–2010 and 2011–2015, the rates of chlamydia has increased in both males and females in the SDHU area.
Notes:
- Rates are are standardized using 2011 Canadian population.
- Data Source: Infectious Diseases Query, Public Health Ontario, Extracted Feb. 2016, and Population Estimates and Projections, Ontario Ministry of Health and Long-Term Care: IntelliHEALTH ONTARIO, Extracted Sep. 2015.
Figure: Age-standardized rate, chlamydia, by sex, Sudbury & District Health Unit (SDHU), 2006–2010 and 2011–2015
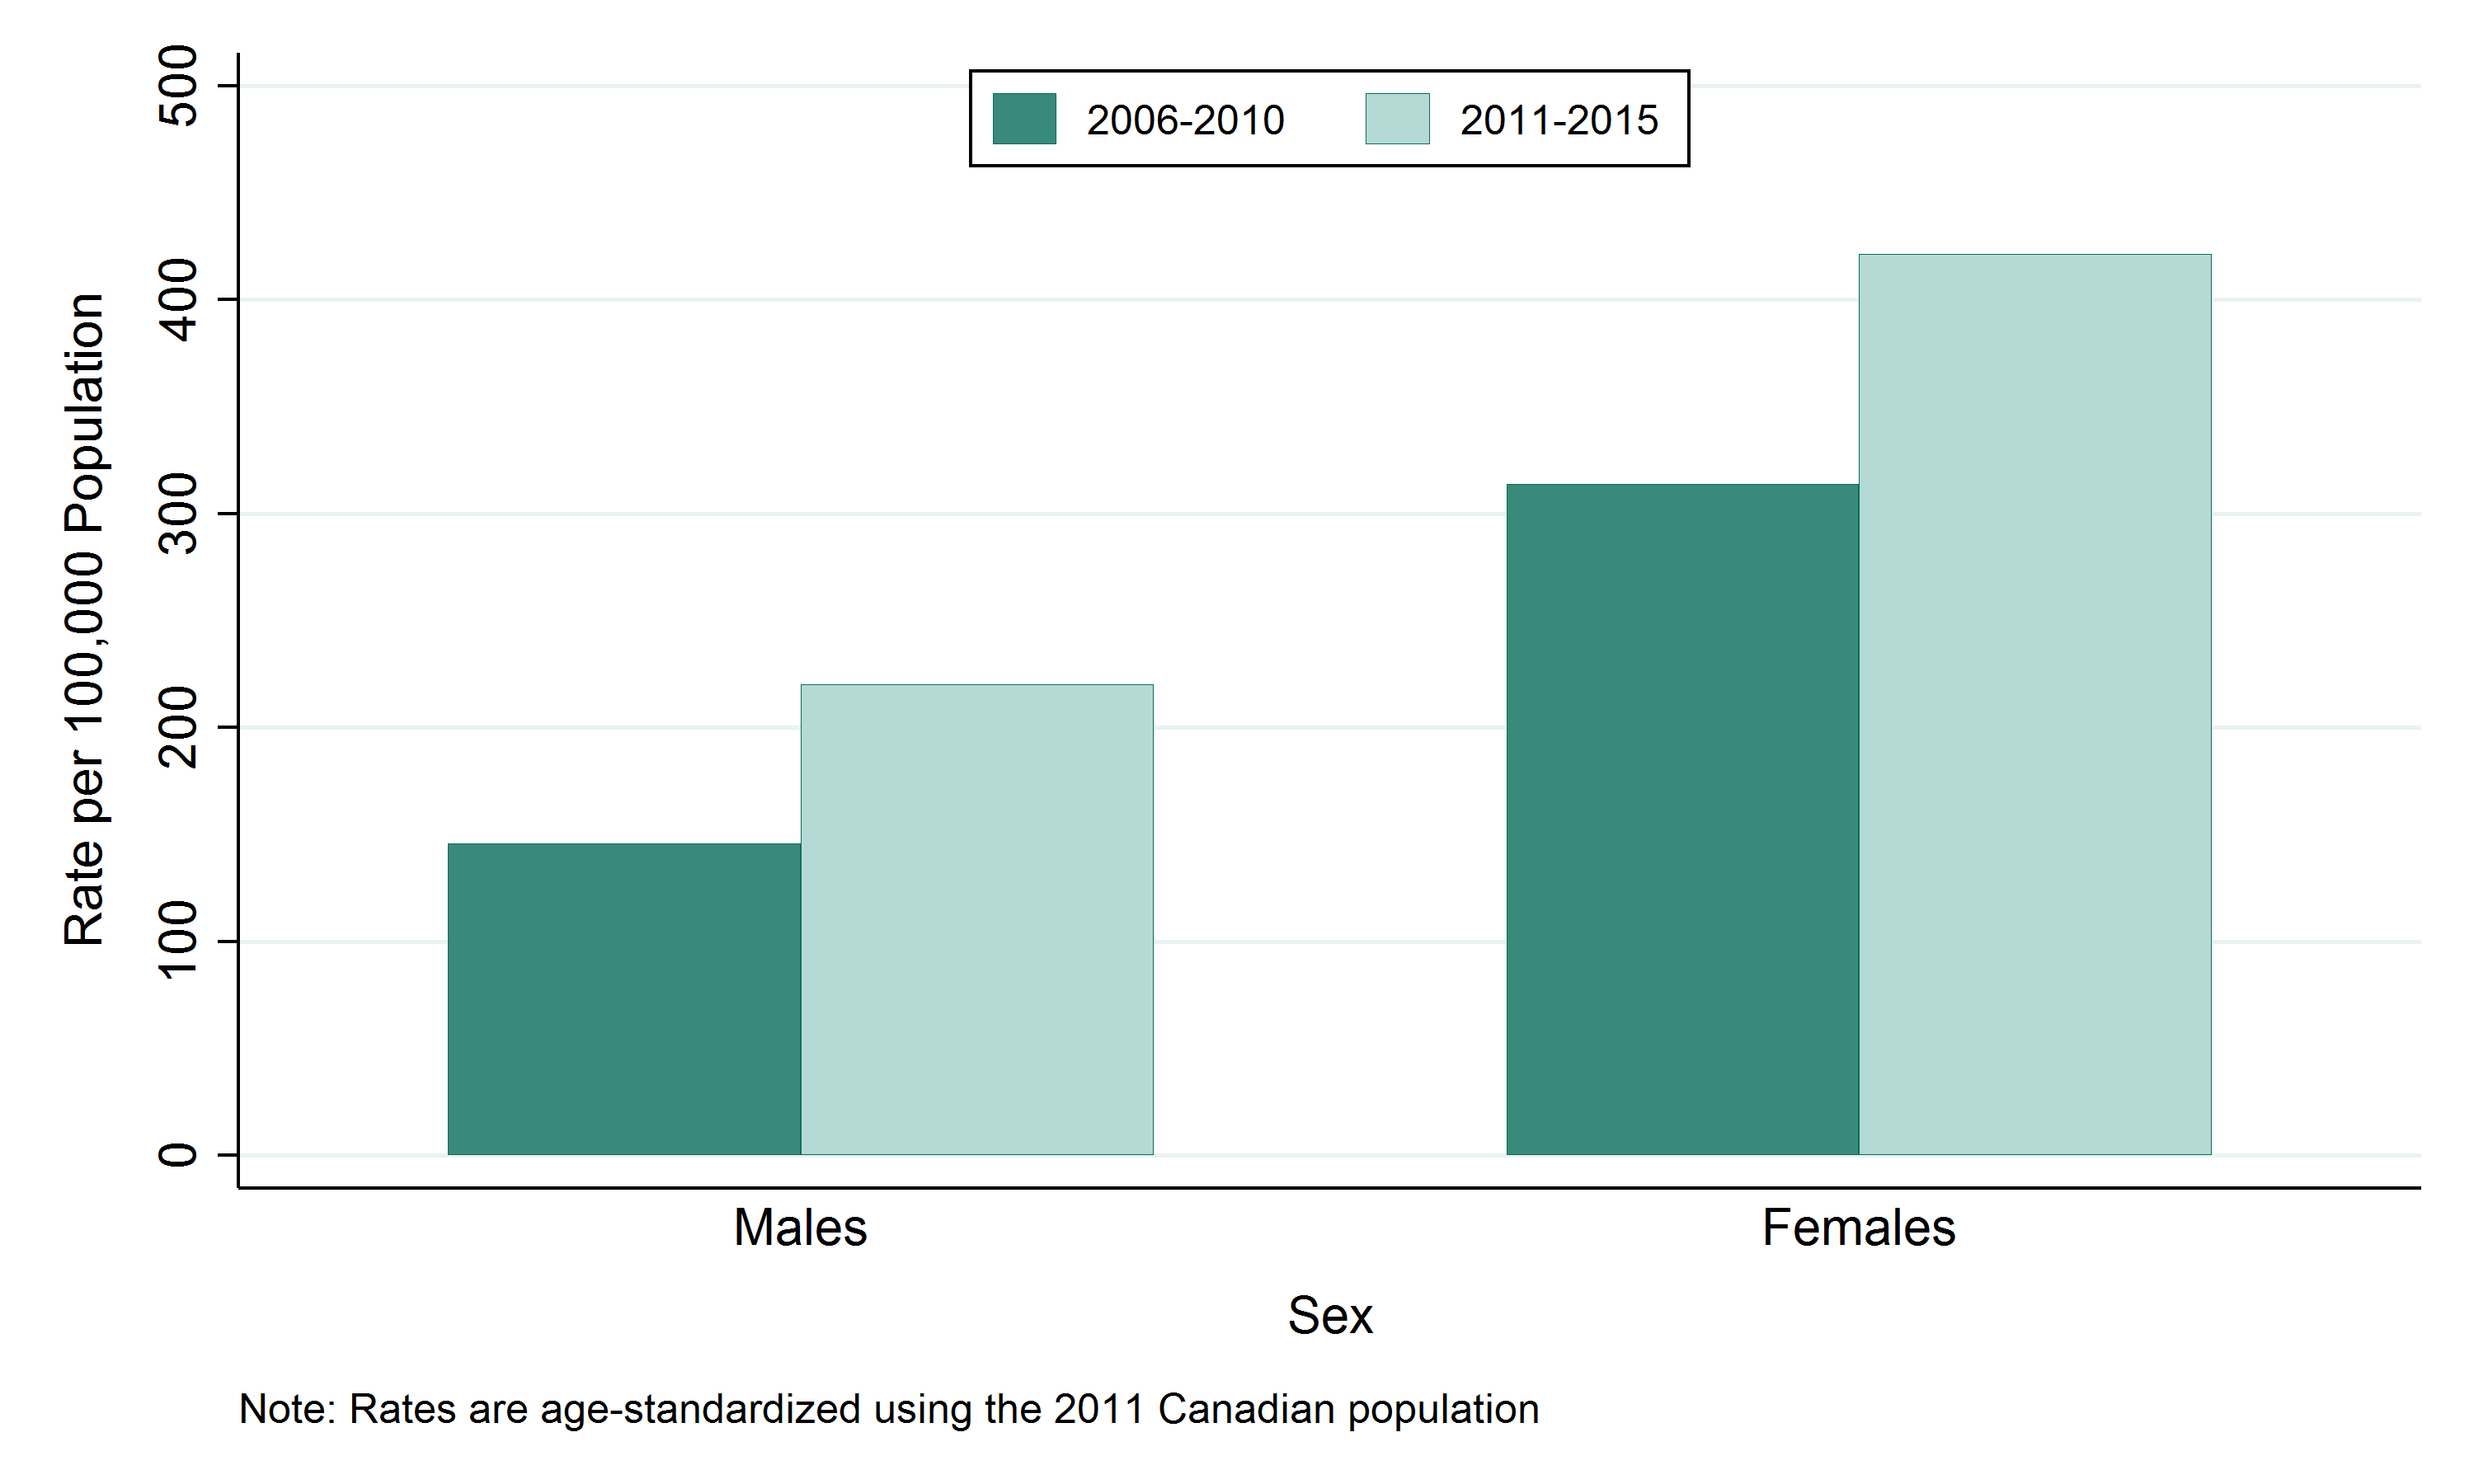
Table: Age-standardized rate, chlamydia, by sex, Sudbury & District Health Unit (SDHU), 2006–2010 and 2011–2015
| Sex | Rate per 100,000 2006-2010 | Rate per 100,000 2011-2015 |
|---|---|---|
| Males | 145.9 | 220 |
| Females | 313.9 | 421.1 |
Table: Annual number of cases of chlamydia, by sex, Sudbury & District Health Unit (SDHU), 2006–2010 and 2011–2015
| Sex | Total Counts 2006-2010 | Total Counts 2011-2015 | Average Annual Counts 2006-2010 | Average Annual Counts 2011-2015 |
|---|---|---|---|---|
| Males | 722 | 1082 | 144.4 | 216.4 |
| Females | 1558 | 2018 | 311.6 | 403.6 |
Chlamydia cases by age group
Key findings:
- Between 2011 and 2015, the highest number of chlamydia cases was in the 20 to 24 age group, with a total of 1,253 cases or an average of 251 per year in the SDHU area.
- In the SDHU area, the highest annual rate of chlamydia was in the 20 to 24 age group, with 1,882 cases per 100,000 population between 2011 and 2015.
- The rate of chlamydia was highest between the ages of 15 and 24 and decreased with age.
- Between the time periods 2006–2010 and 2011–2015, in the SDHU area the rate of chlamydia has increased in all age groups.
Notes:
- Data Source: Infectious Diseases Query, Public Health Ontario, Extracted Feb. 2016, and Population Estimates and Projections, Ontario Ministry of Health and Long-Term Care: IntelliHEALTH ONTARIO, Extracted Sep. 2015.
Figure: Chlamydia, by age group, Sudbury & District Health Unit (SDHU), 2006–2010 and 2011–2015
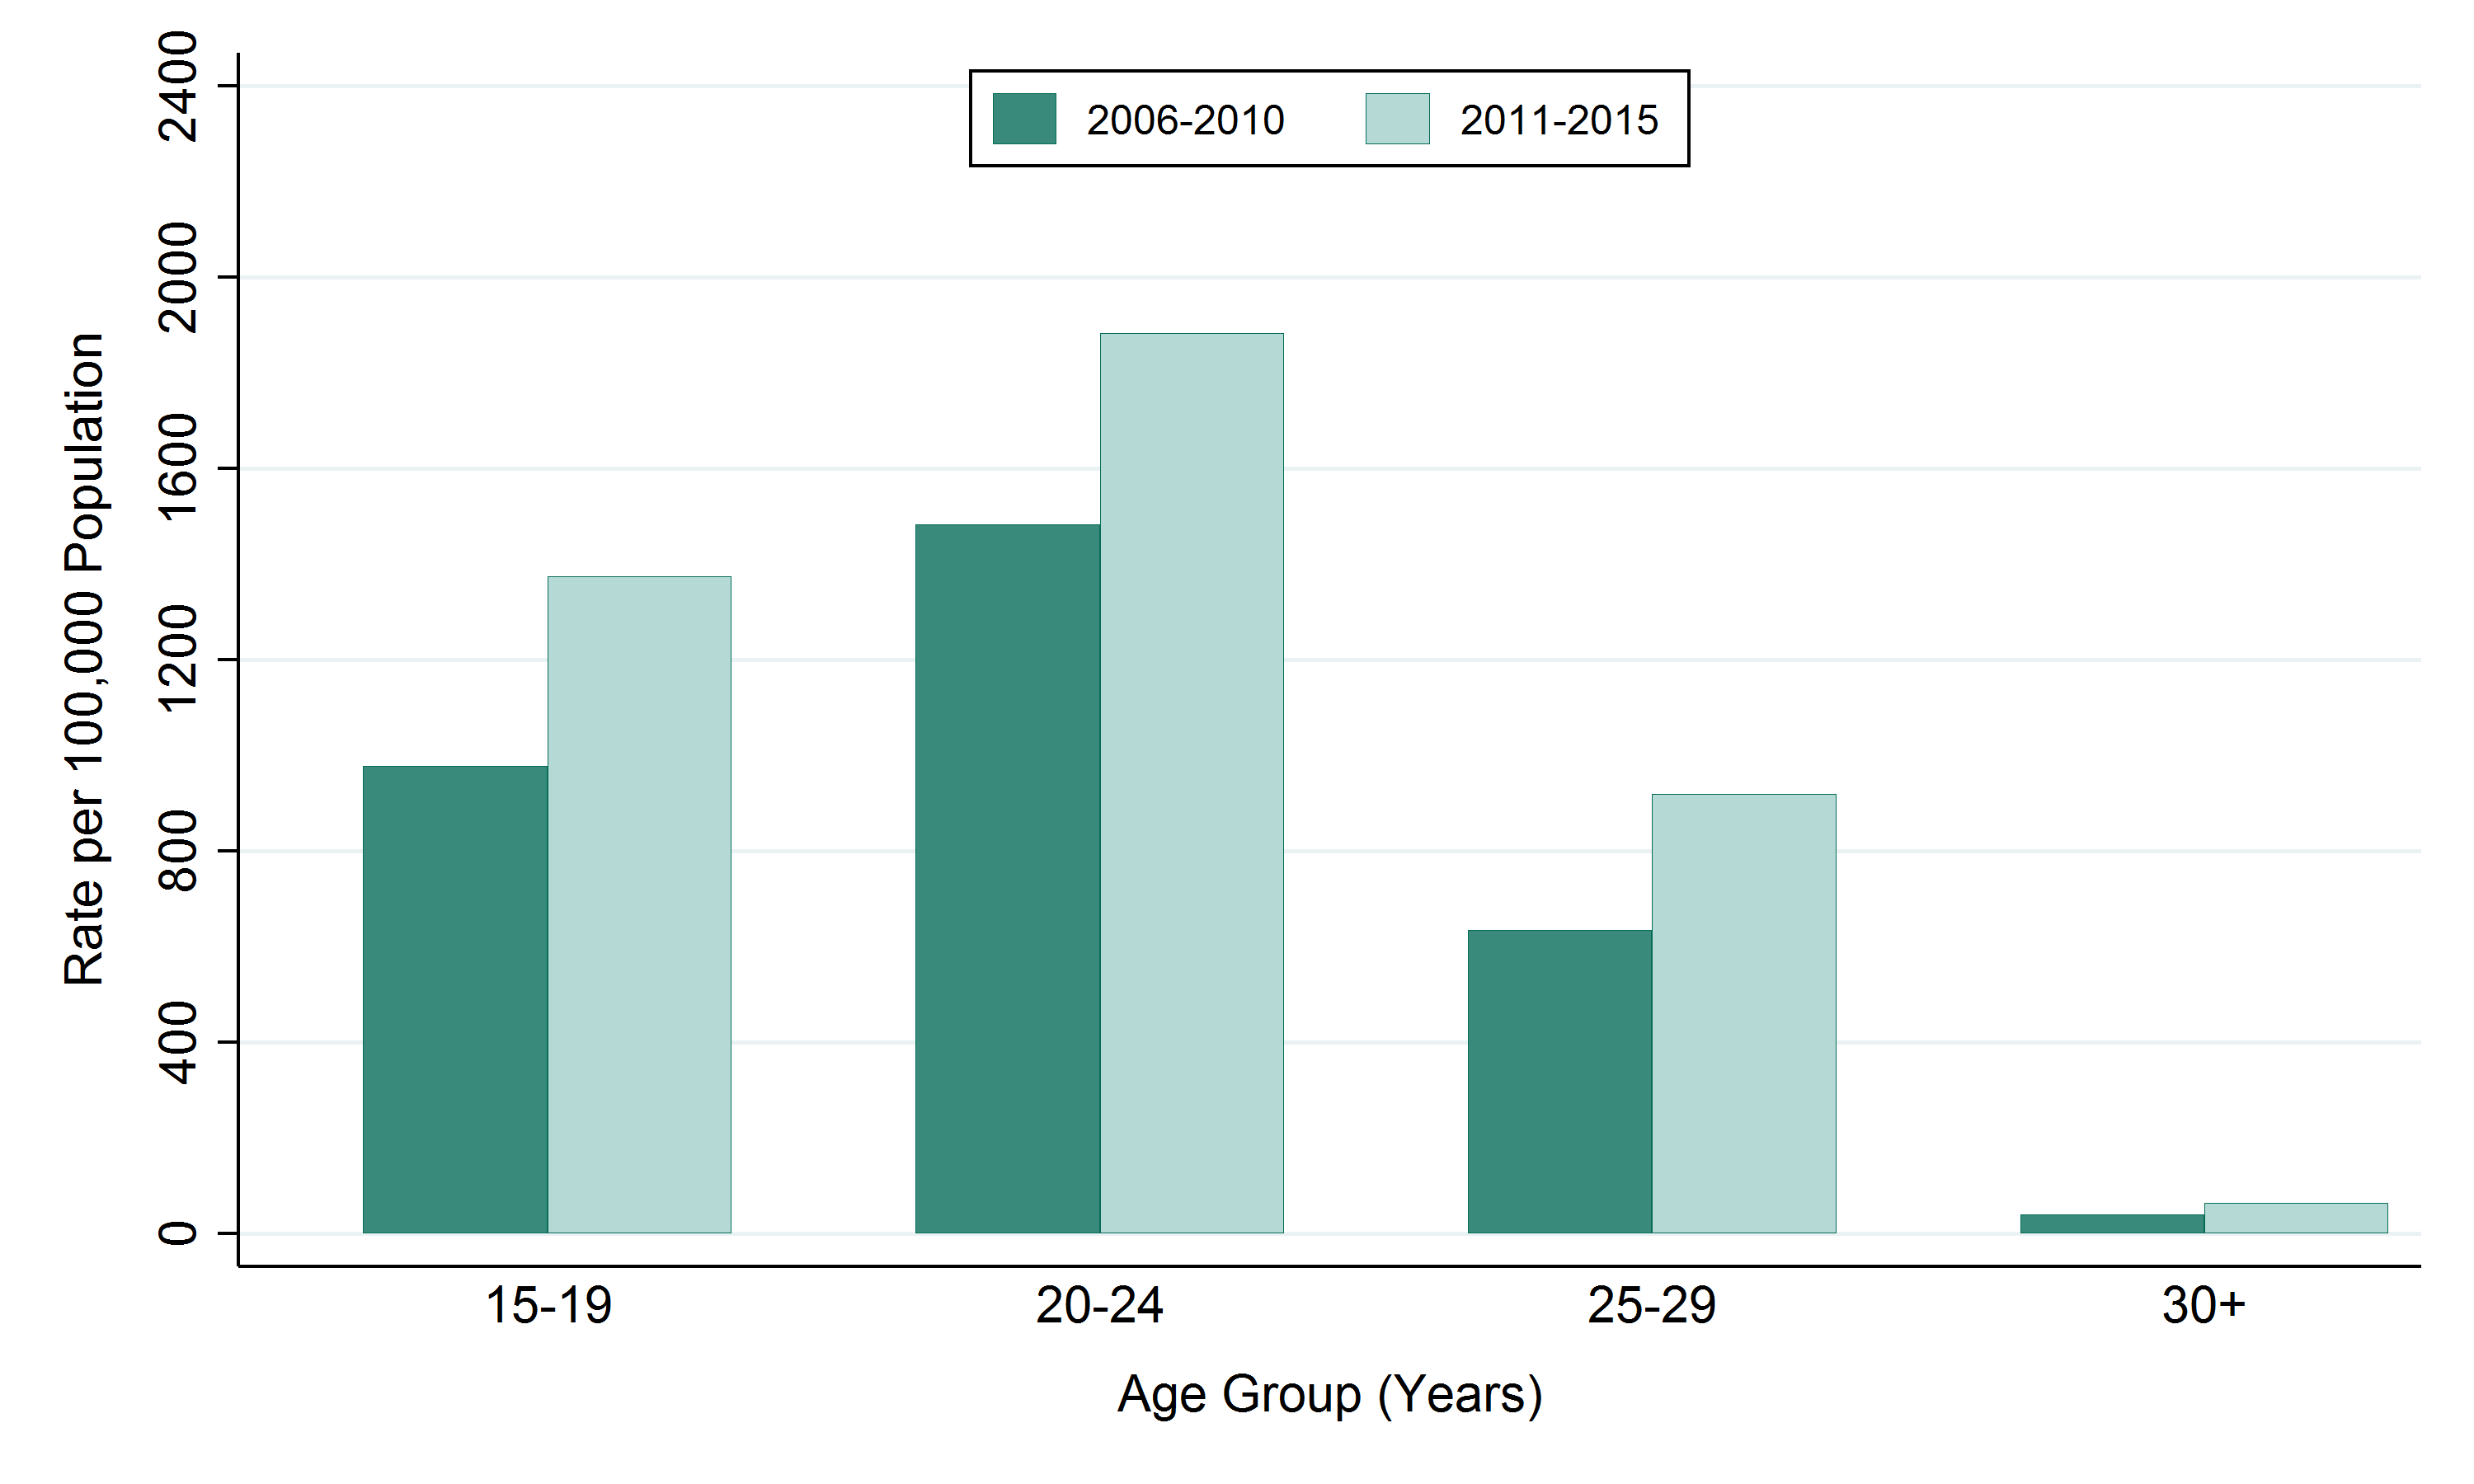
Table: Rate of chlamydia, by age group, Sudbury & District Health Unit (SDHU), 2006–2010 and 2011–2015
| Age Group | Rate per 100,000 2006-2010 | Rate per 100,000 2011-2015 |
|---|---|---|
| 15-19 | 977.7 | 1373.5 |
| 20-24 | 1481.9 | 1881.7 |
| 25-29 | 634.2 | 919.8 |
| 30+ | 39.5 | 64.8 |
Table: Annual number of cases of chlamydia, by age group, Sudbury & District Health Unit (SDHU), 2006–2010 and 2011–2015
| Age Group | Total Counts 2006-2010 | Total Counts 2011-2015 | Average Annual Counts 2006-2010 | Average Annual Counts 2011-2015 |
|---|---|---|---|---|
| 15-19 | 663 | 851 | 132.6 | 170.2 |
| 20-24 | 966 | 1253 | 193.2 | 250.6 |
| 25-29 | 382 | 563 | 76.4 | 112.6 |
| 30+ | 256 | 428 | 51.2 | 85.6 |
This item was last modified on April 30, 2018