Influenza
Influenza is a respiratory infection caused by a virus. The infection is spread from person-to-person through droplets that are sprayed into the environment through activities like coughing or sneezing, or are inhaled by others nearby.
The circulating influenza virus strains change each year so people can be susceptible to influenza infection every year, even if they have been sick with influenza before or have received flu shots in previous years. Everyone is susceptible to influenza, but young children, older adults, and people with weakened immune systems or those with chronic health conditions are at highest risk of serious complications from infection.
Influenza infection is confirmed by taking a swab of the area at the back of the nose and throat. Only confirmed cases are reported. Swabs are generally taken at the beginning of influenza season and are used to confirm that influenza virus is circulating in the community. Therefore, the number of cases presented in this report are less than what is occurring in the community. After the start of flu season, swabs are generally only taken when they are medically necessary.
In the northern hemisphere, influenza season varies but occurs seasonally usually from around November to April. This means that an influenza season consists of cases that occur in the later part of one year and the early part of the next year. For reporting purposes, and in the case of this report, data are provided annually. This means that the number of annual cases reported in a given year are a mix of cases of flu from different influenza seasons; January to April reports are influenza strains that circulated the previous flu season; data from November to December would reflect the cases of the current year flu strain.
Note:
In 2009 and 2010, the pandemic strain of influenza circulated. Due to changes in reporting mechanisms during this time, information related to cases was not entered into provincial databases and thus is not included in this report.
Influenza cases by geographic area
Key findings:
- In the SDHU area, there were 148 confirmed cases of influenza in 2015.
- In 2015, the rate of influenza in the SDHU area was 70 per 100,000 population.
- The rate of influenza in the SDHU area has been similar to the rate in Ontario, while the rate in both the SDHU area and Ontario have been lower than that of northeastern Ontario for most years with some fluctuations.
- Between 2006 and 2015, the rate of influenza in the SDHU area has increased with some fluctuations.
Notes:
- Rates are age-standardized using 2011 Canadian population.
- Data Source: Infectious Diseases Query, Public Health Ontario, Extracted Feb. 2016, and Population Estimates and Projections, Ontario Ministry of Health and Long-Term Care: IntelliHEALTH ONTARIO, Extracted Sep. 2015.
Figure: Annual age-standardized rate, influenza, by geographic area, 2006–2015
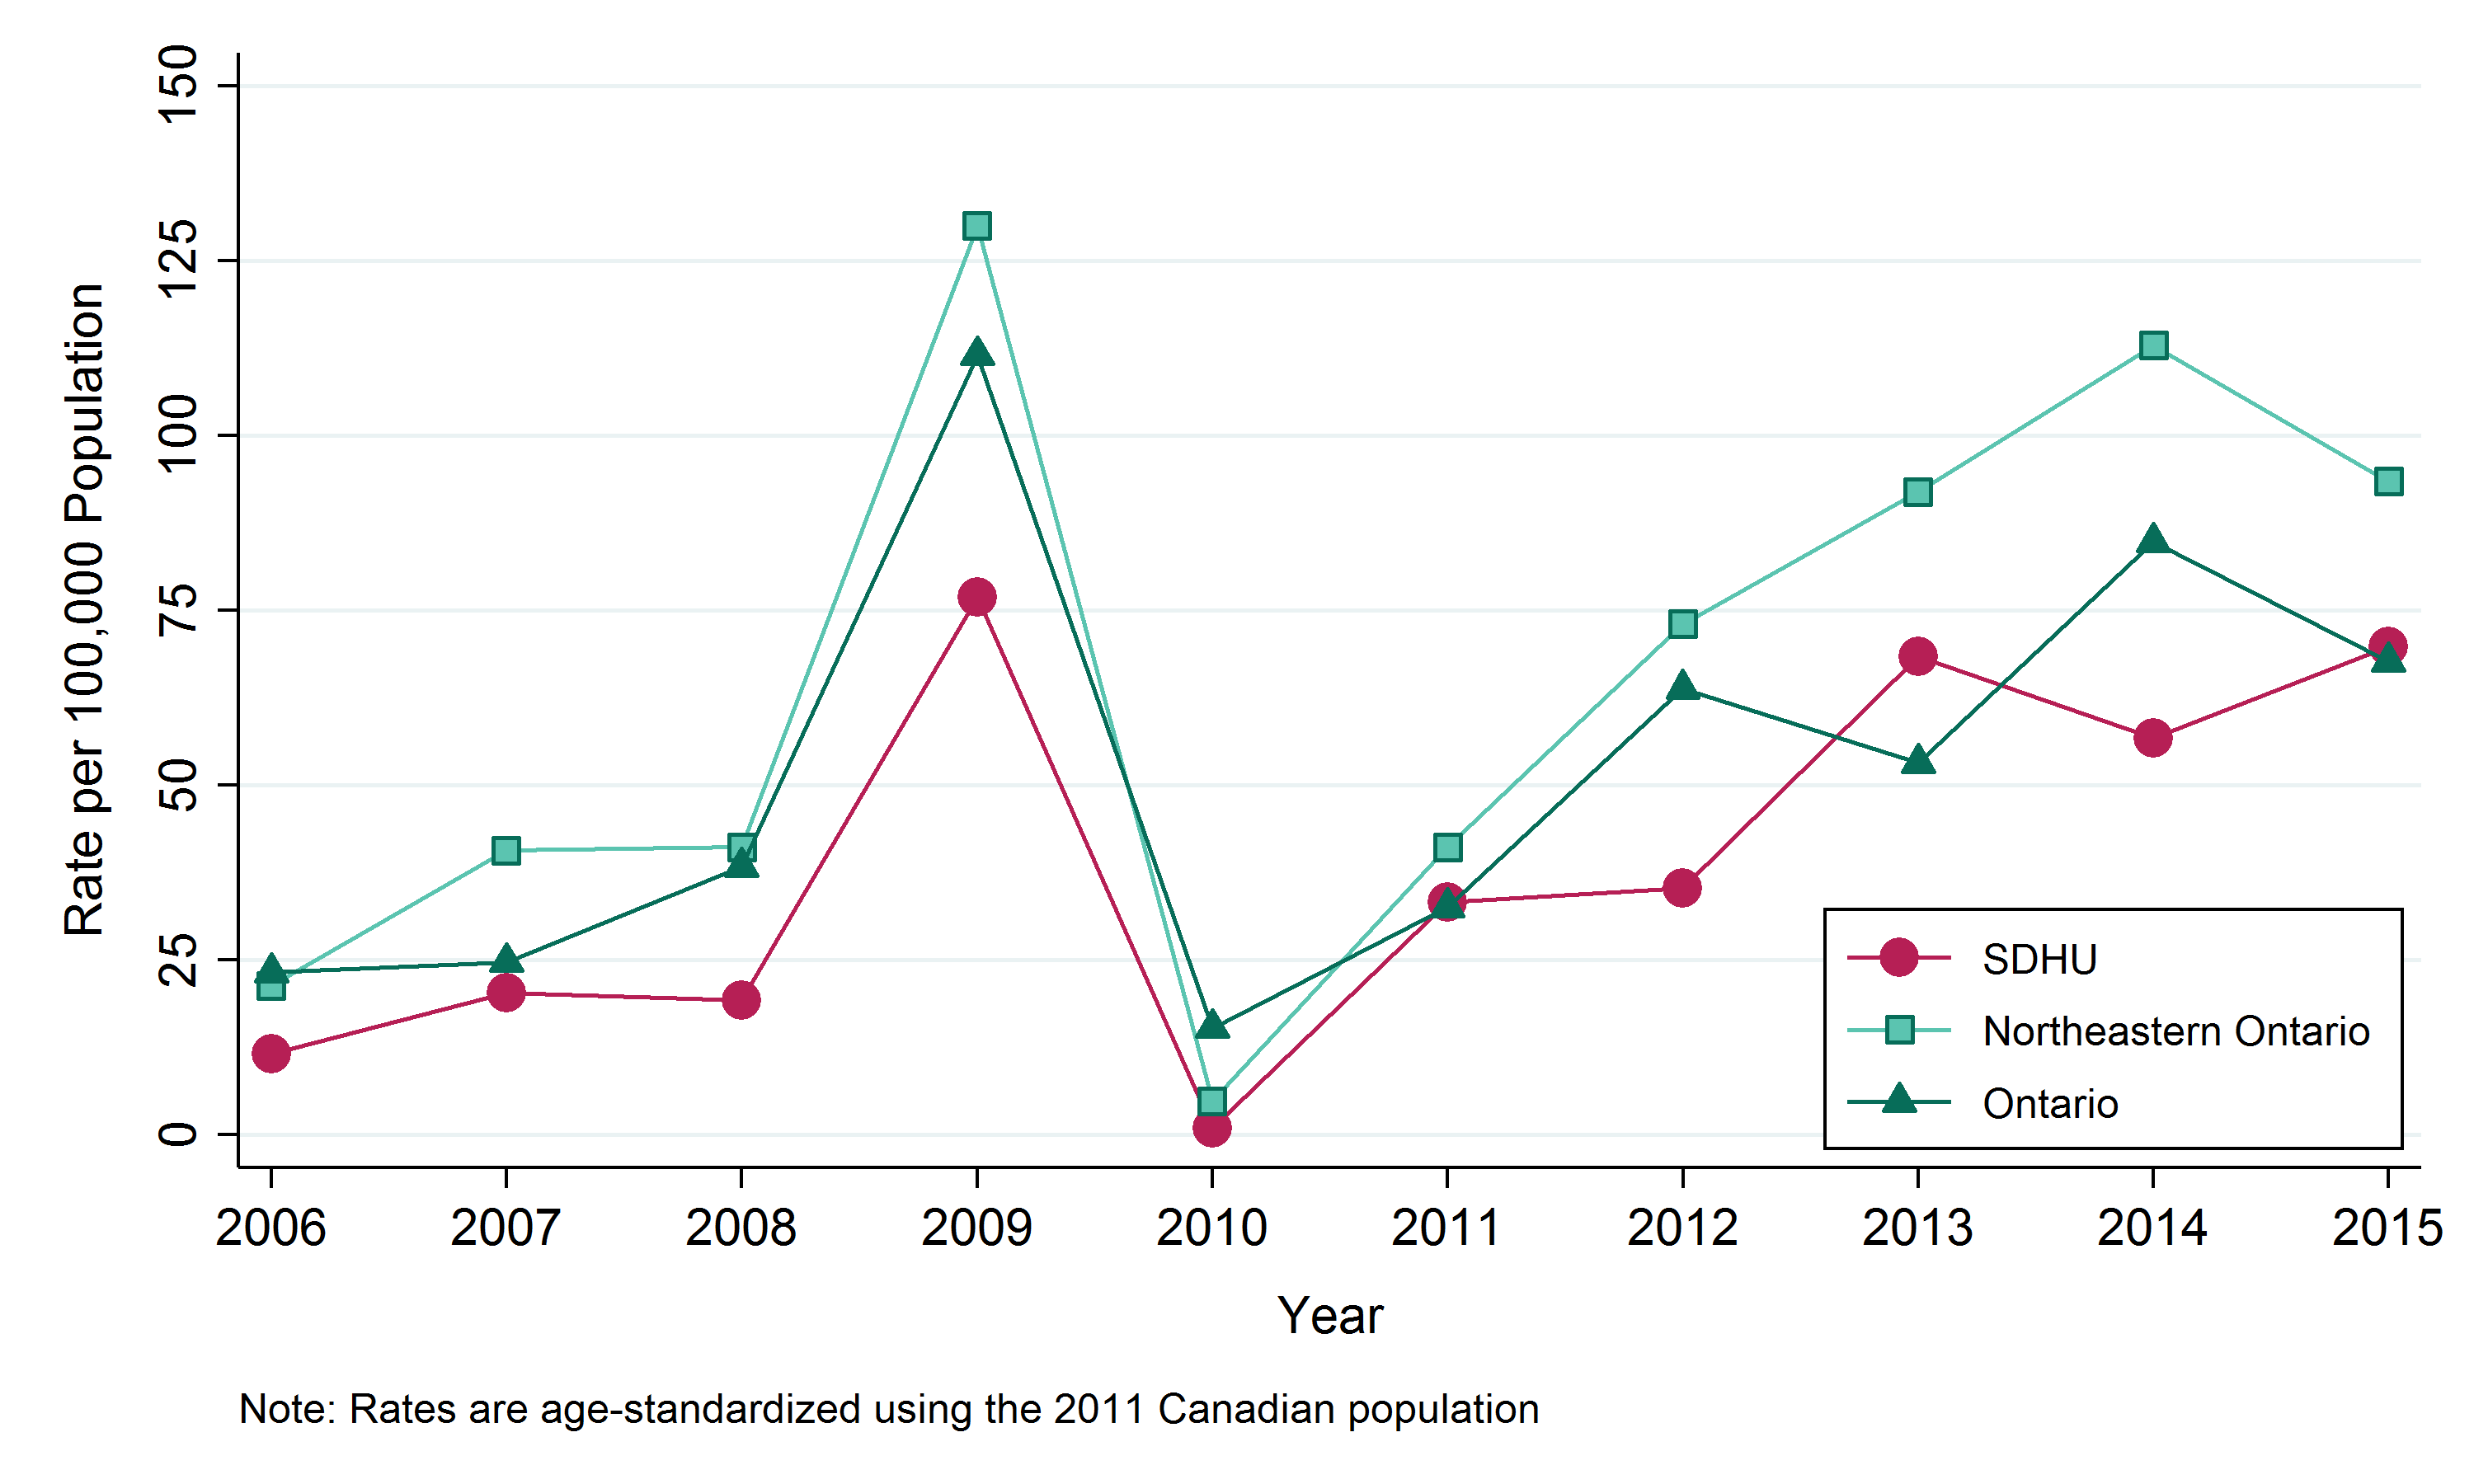
Table: Annual age-standardized rate, influenza, by geographic area, 2006–2015
| Geographic Region | 2006 | 2007 | 2008 | 2009 | 2010 | 2011 | 2012 | 2013 | 2014 | 2015 |
|---|---|---|---|---|---|---|---|---|---|---|
| SDHU | 11.6 | 20.3 | 19.3 | 76.9 | 1.0 | 33.3 | 35.3 | 68.4 | 56.7 | 69.9 |
| Northeast | 21.4 | 40.7 | 41.2 | 129.9 | 4.8 | 41.1 | 73.0 | 91.9 | 112.9 | 93.4 |
| Ontario | 23.3 | 24.7 | 38.4 | 111.5 | 15.3 | 32.6 | 63.8 | 53.2 | 84.8 | 67.7 |
Table: Number of cases of influenza, by geographic area, 2006–2015
| Geographic Region | 2006 | 2007 | 2008 | 2009 | 2010 | 2011 | 2012 | 2013 | 2014 | 2015 |
|---|---|---|---|---|---|---|---|---|---|---|
| SDHU | 22 | 39 | 37 | 150 | 2 | 64 | 69 | 137 | 114 | 148 |
| Northeast | 117 | 223 | 226 | 709 | 28 | 235 | 420 | 531 | 664 | 581 |
| Ontario | 2884 | 3067 | 4767 | 14670 | 1947 | 4232 | 8464 | 7180 | 11733 | 9738 |
Influenza cases by sex
Key findings:
- Between 2011 and 2015, there were a total of 251 males and 281 females diagnosed with influenza in the SDHU area, an average of 50 males and 56 females per year.
- In the SDHU area, the annual rate of influenza between 2011 and 2015 was 53 per 100,000 males and 53 per 100,000 females.
- The rate of influenza among males has been similar to the rate among females.
- Between the time periods 2006–2010 and 2011–2015, the rates of influenza has increased for both males and females in the SDHU area.
Notes:
- Rates are age-standardized using 2011 Canadian population.
- Data Source: Infectious Diseases Query, Public Health Ontario, Extracted Feb. 2016, and Population Estimates and Projections, Ontario Ministry of Health and Long-Term Care: IntelliHEALTH ONTARIO, Extracted Sep. 2015.
Figure: Age-standardized rate, influenza, by sex, Sudbury & District Health Unit (SDHU), 2006–2010 and 2011–2015
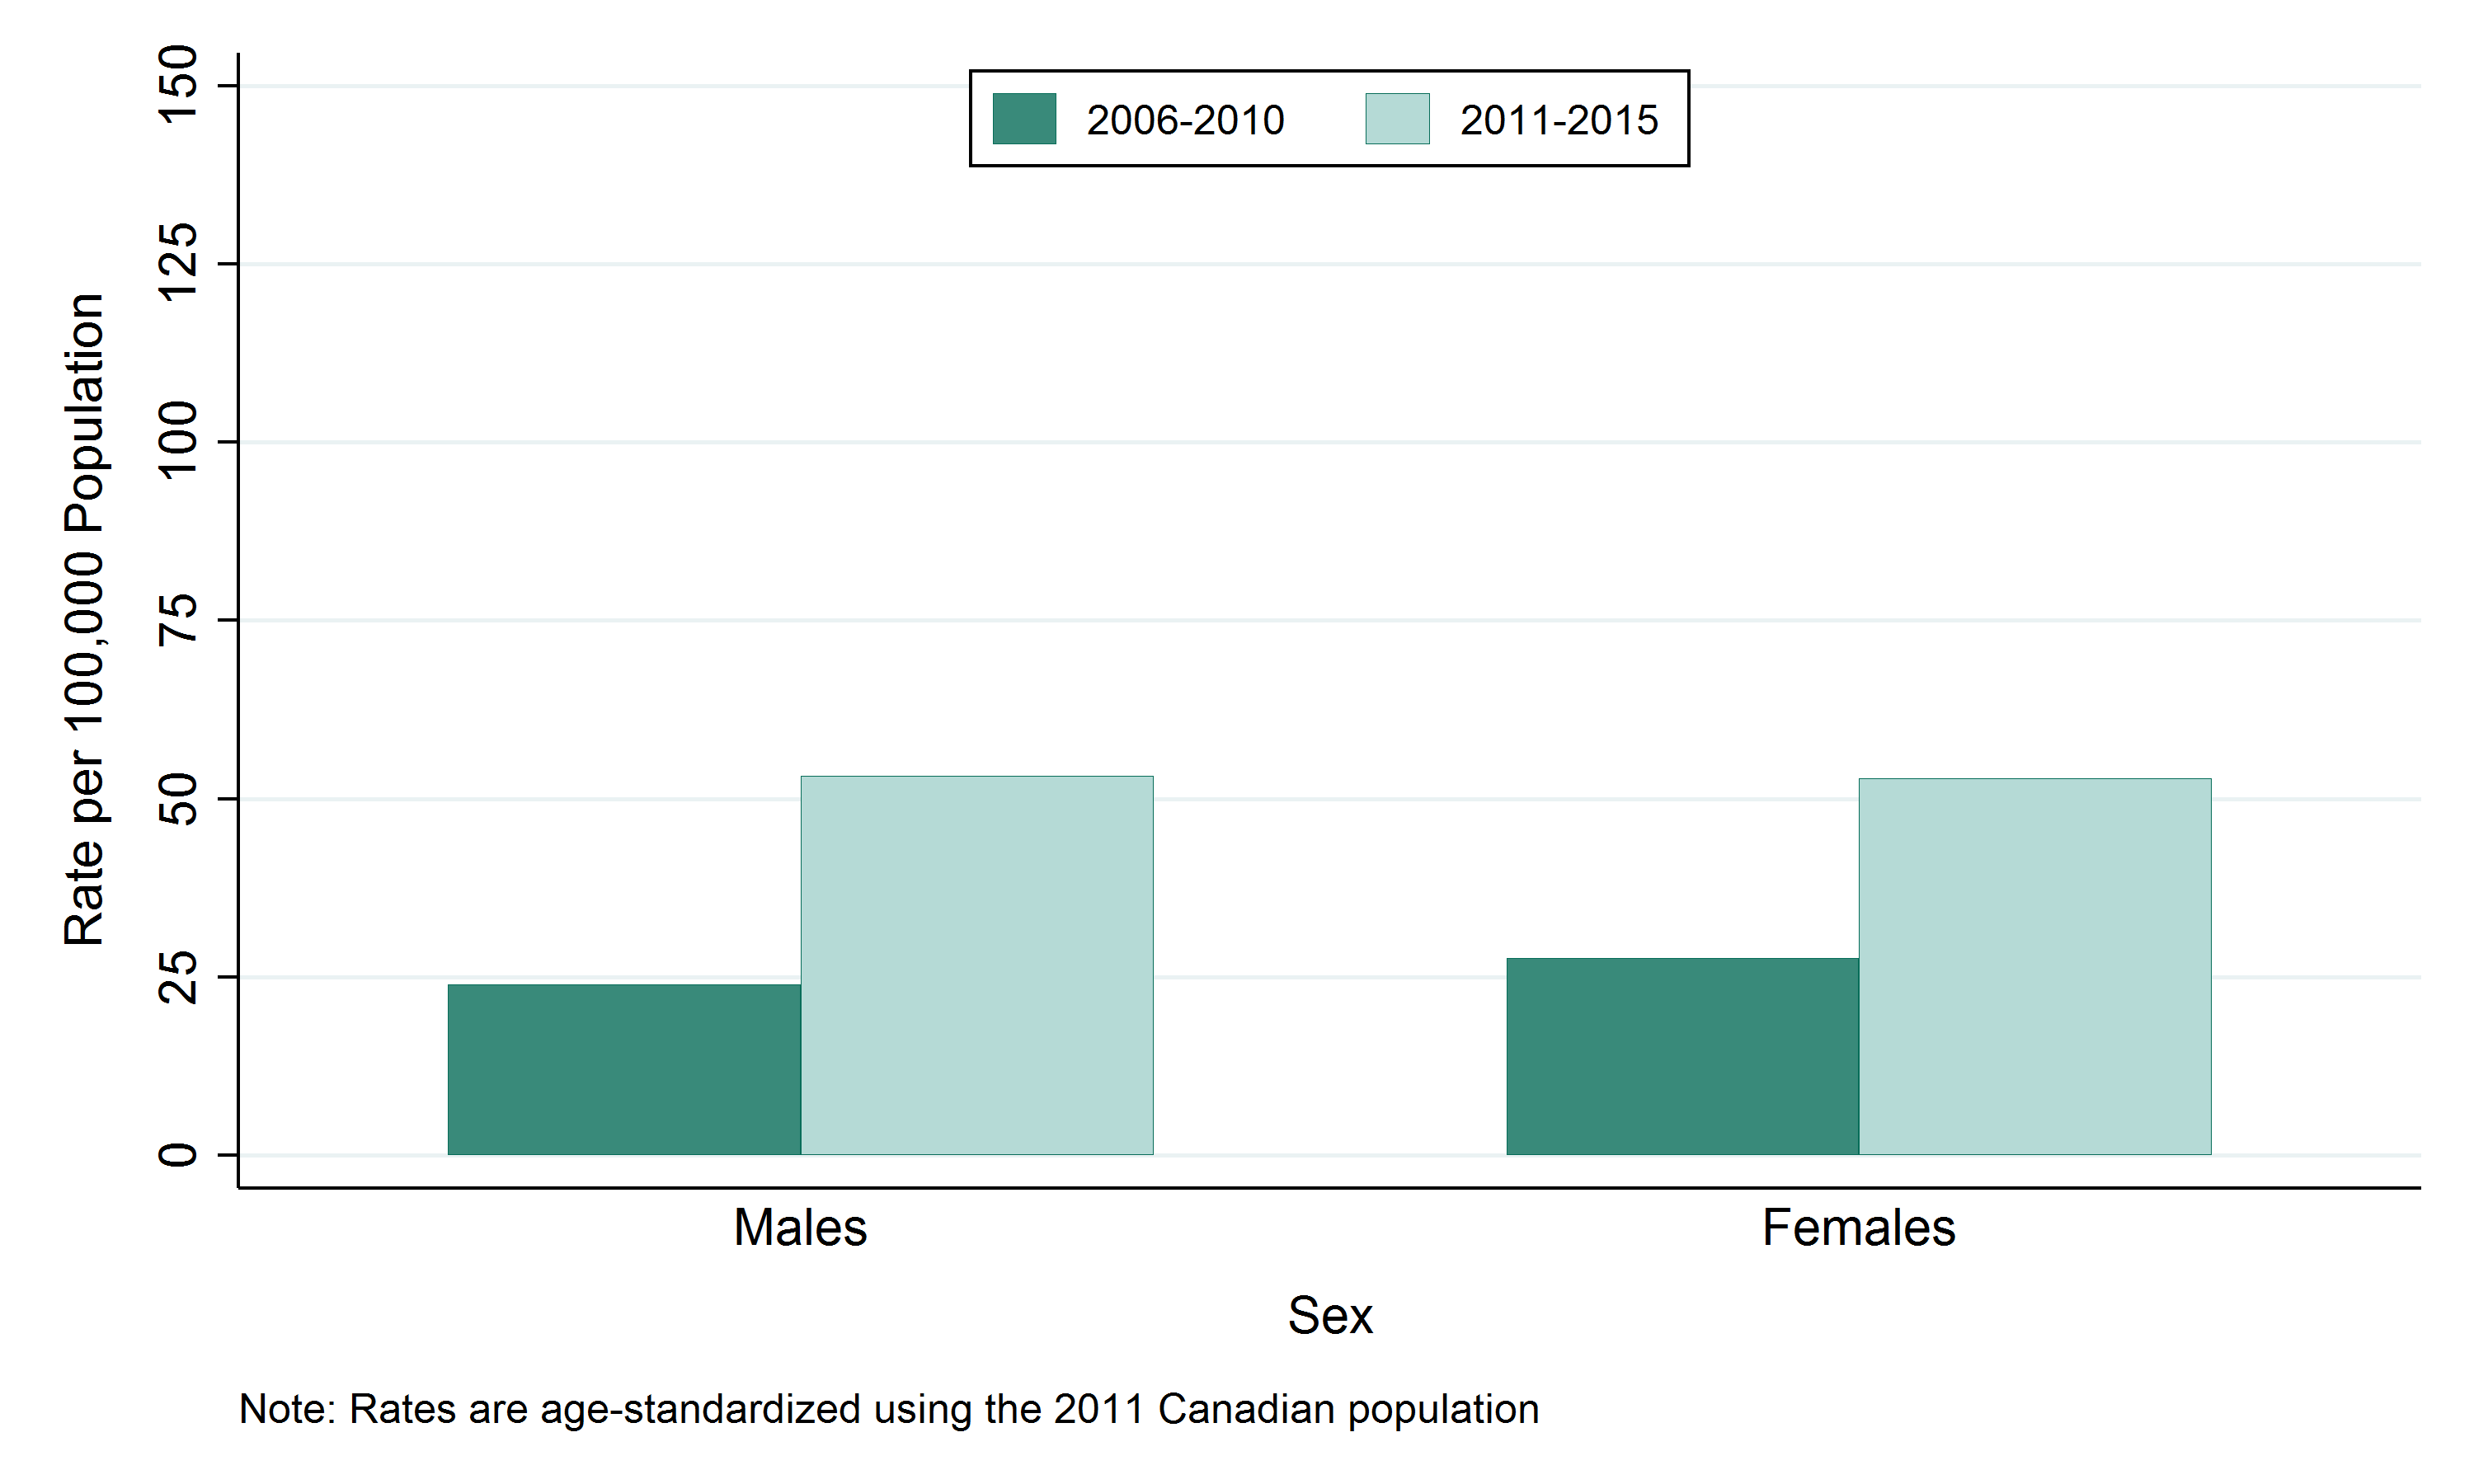
Table: Age-standardized rate, influenza, by sex, Sudbury & District Health Unit (SDHU), 2006–2010 and 2011–2015
| Sex | Rate per 100,000 2006-2010 | Rate per 100,000 2011-2015 |
|---|---|---|
| Males | 24 | 53.2 |
| Females | 27.6 | 52.9 |
Table: Annual number of cases of influenza, by sex, Sudbury & District Health Unit (SDHU), 2006–2010 and 2011–2015
| Sex | Total Counts 2006-2010 | Total Counts 2011-2015 | Average Annual Counts 2006-2010 | Average Annual Counts 2011-2015 |
|---|---|---|---|---|
| Males | 112 | 251 | 22.4 | 50.2 |
| Females | 138 | 281 | 27.6 | 56.2 |
Influenza cases by age group
Key findings:
- Between 2011 and 2015, the highest number of influenza cases was in the 65-and-over age group, with a total of 211 cases or an average of 42 per year in the SDHU area.
- In the SDHU area, the highest annual rate of influenza was in the 65-and-over age group, with 122 cases per 100,000 population between 2011 and 2015.
- The rate of influenza was highest in the 65-and-over and 0 to 19 age groups.
- Between the time periods 2006–2010 and 2011–2015, the rate of influenza has increased for all age groups.
Figure: Influenza, by age group, Sudbury & District Health Unit (SDHU), 2006–2010 and 2011–2015
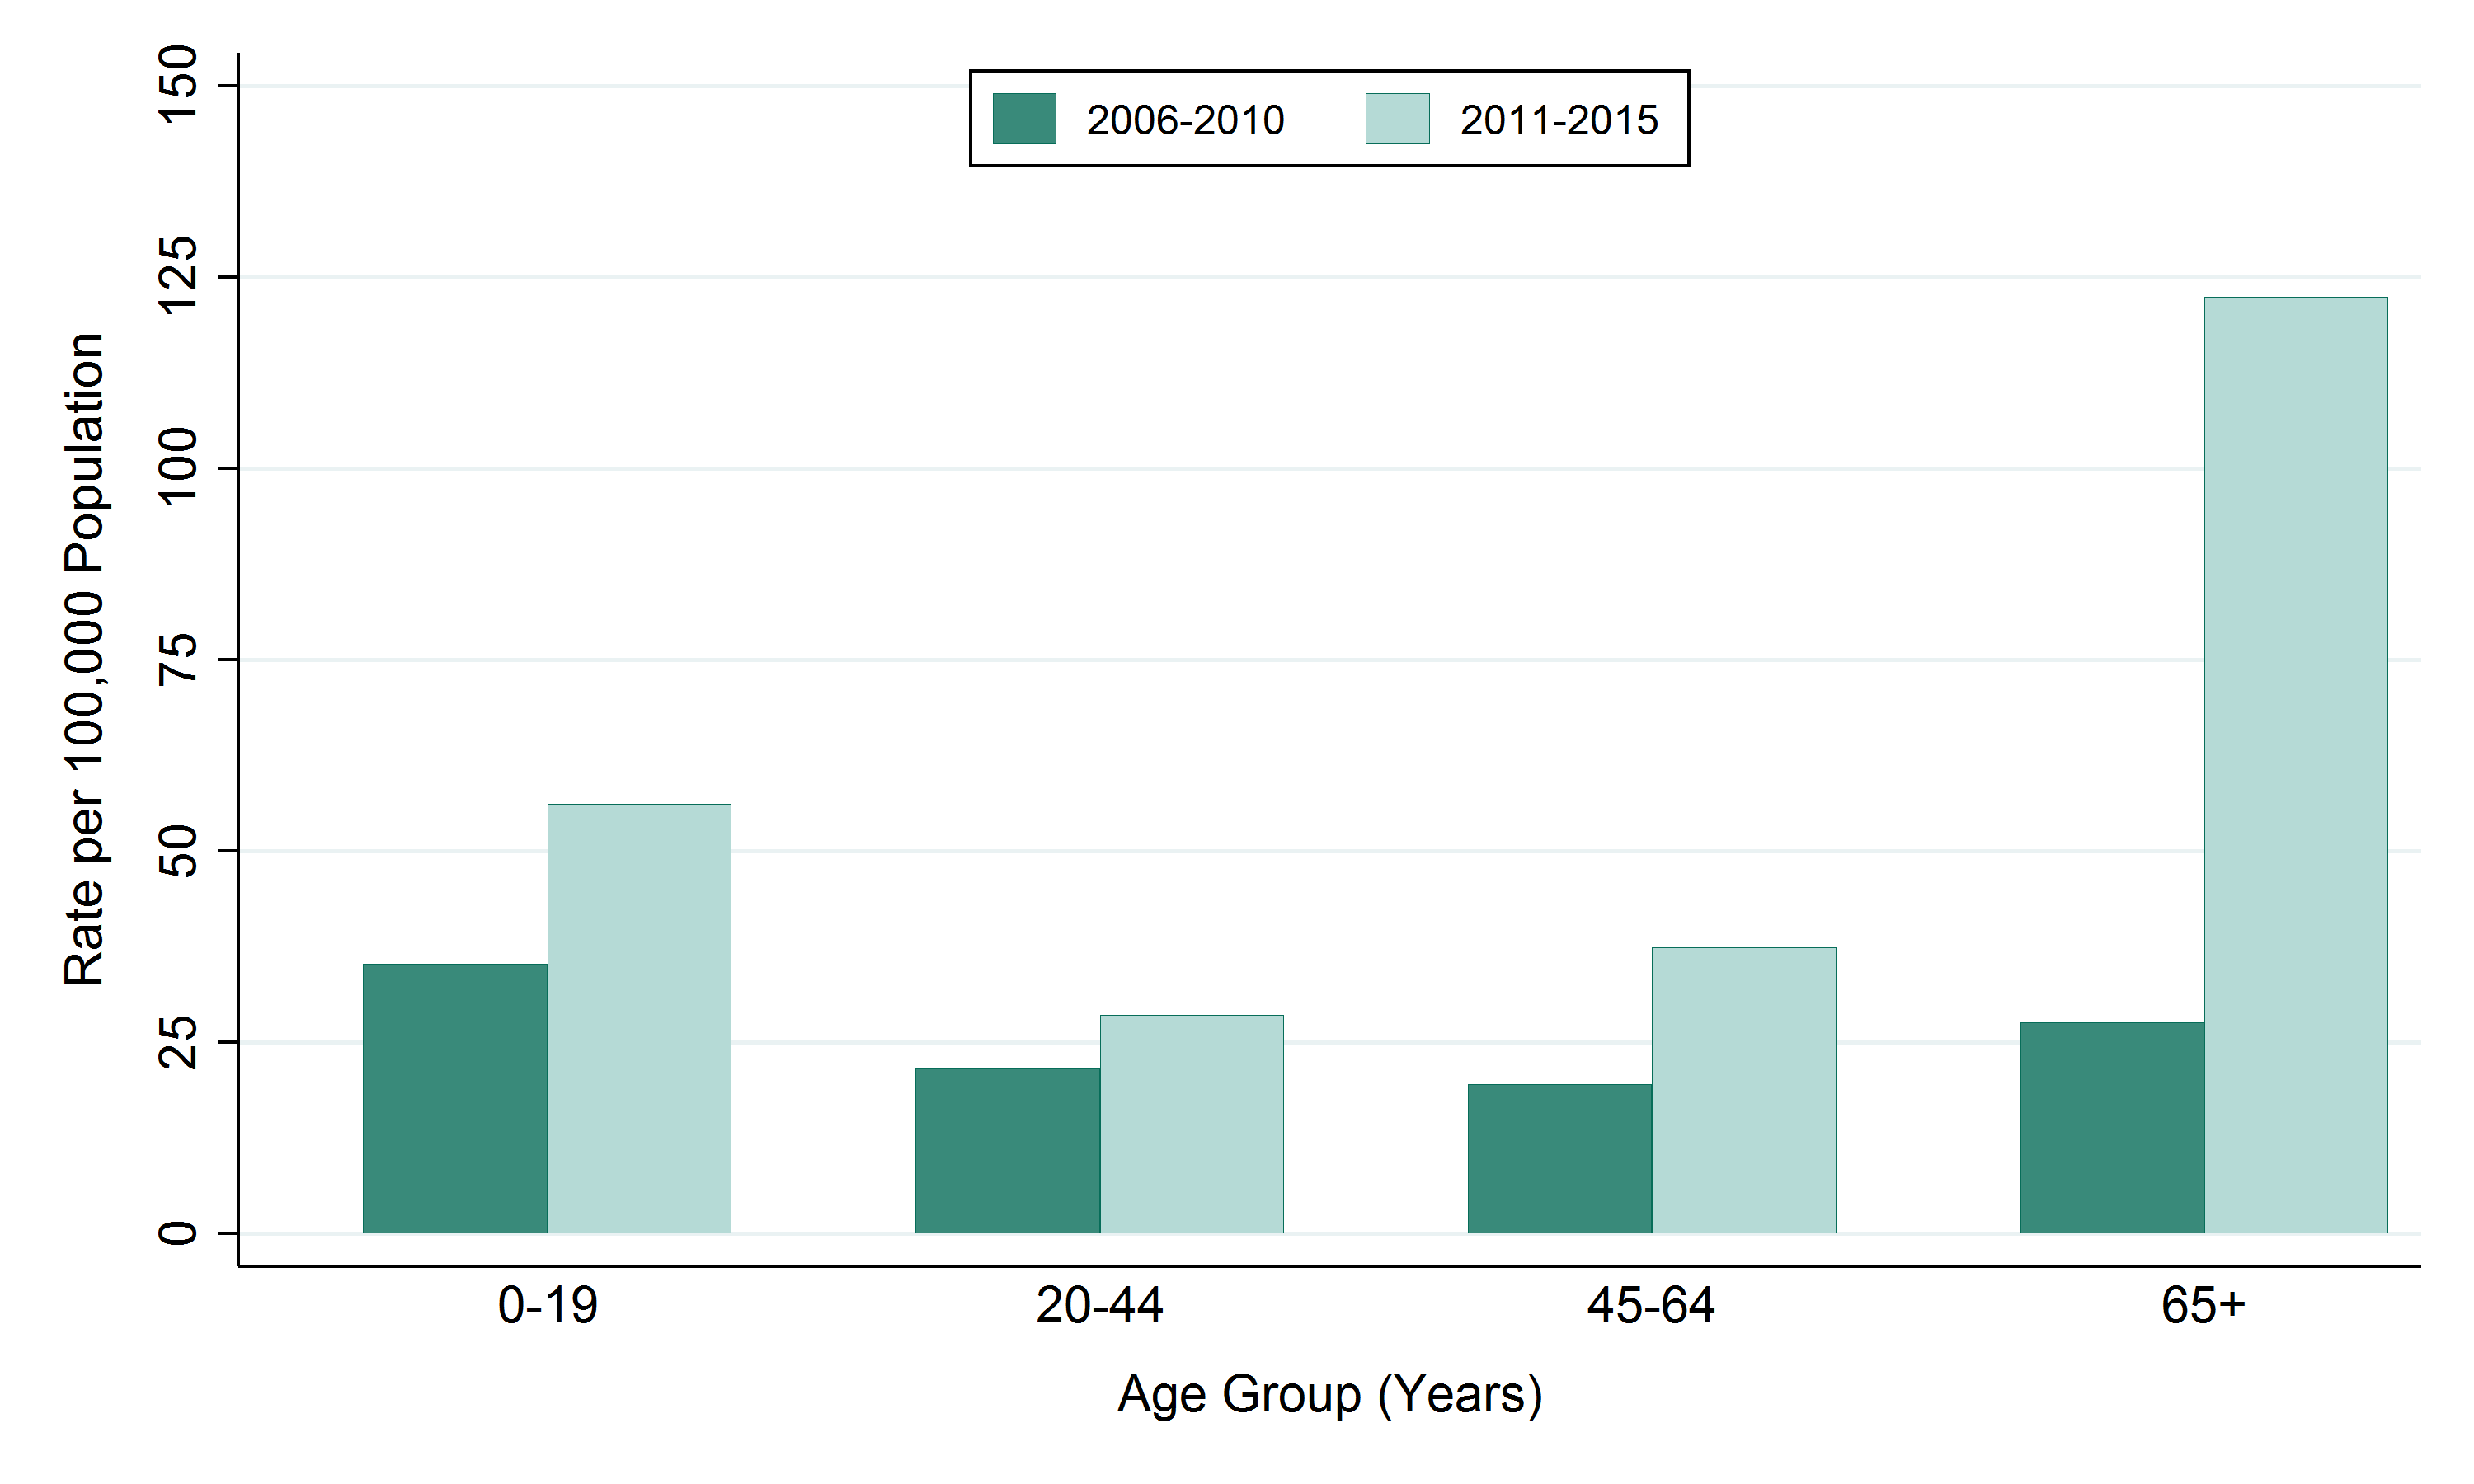
Table: Rate of Influenza, by age group, Sudbury & District Health Unit (SDHU), 2006–2010 and 2011–2015
| Age Group | Rate per 100,000 2006-2010 | Rate per 100,000 2011-2015 |
|---|---|---|
| 0-19 | 35.3 | 56.2 |
| 20-44 | 21.6 | 28.6 |
| 45-64 | 19.5 | 37.4 |
| 65+ | 27.6 | 122.4 |
Table: Annual number of cases of Influenza, by age group, Sudbury & District Health Unit (SDHU), 2006–2010 and 2011–2015
| Age Group | Total Counts 2006-2010 | Total Counts 2011-2015 | Average Annual Counts 2006-2010 | Average Annual Counts 2011-2015 |
|---|---|---|---|---|
| 0-19 | 80 | 118 | 16.0 | 23.6 |
| 20-44 | 70 | 89 | 14.0 | 17.8 |
| 45-64 | 58 | 114 | 11.6 | 22.8 |
| 65+ | 42 | 211 | 8.4 | 42.2 |
This item was last modified on October 22, 2021