Hepatitis C
Hepatitis C is an infection of the liver caused by the hepatitis C virus. It is spread primarily through contact with an infected person’s blood. Many people who develop hepatitis C infection become chronically infected, meaning they carry the infection in their body for life, can spread the infection to others, and are at higher risk of liver diseases including cancer and cirrhosis. New advances in treatment are leading to improved rates of cure (meaning undetectable virus in blood).
Many individuals who are infected with hepatitis C have no symptoms. For those who do have symptoms, they may experience loss of appetite, abdominal discomfort, fatigue, and nausea. Risk factors for infection include, sharing of needles and other equipment to inject illicit drugs, exposure to sharp instruments that have contact with blood, such as needles used in tattooing and piercing, and personal care items such as razors and nail clippers. The risk of getting hepatitis C through sexual contact is very small.
Hepatitis C cases by geographic area
Key findings:
- In the SDHU area, there were 119 confirmed cases of hepatitis C in 2015.
- In 2015, the rate of hepatitis C in the SDHU area was 62 per 100,000 population.
- The rate of hepatitis C in the SDHU area has been similar to the rate in northeastern Ontario, while the rate in both the SDHU area and northeastern Ontario have been higher than that of Ontario for most years with some fluctuations.
- Between 2006 and 2015, the rate of hepatitis C in the SDHU area and northeastern Ontario has increased.
Notes:
- Rates are age-standardized using 2011 Canadian population.
- Data Source: Infectious Diseases Query, Public Health Ontario, Extracted Feb. 2016, and Population Estimates and Projections, Ontario Ministry of Health and Long-Term Care: IntelliHEALTH ONTARIO, Extracted Sep. 2015.
Figure: Annual age-standardized rate, hepatitis C, by geographic area, 2006–2015
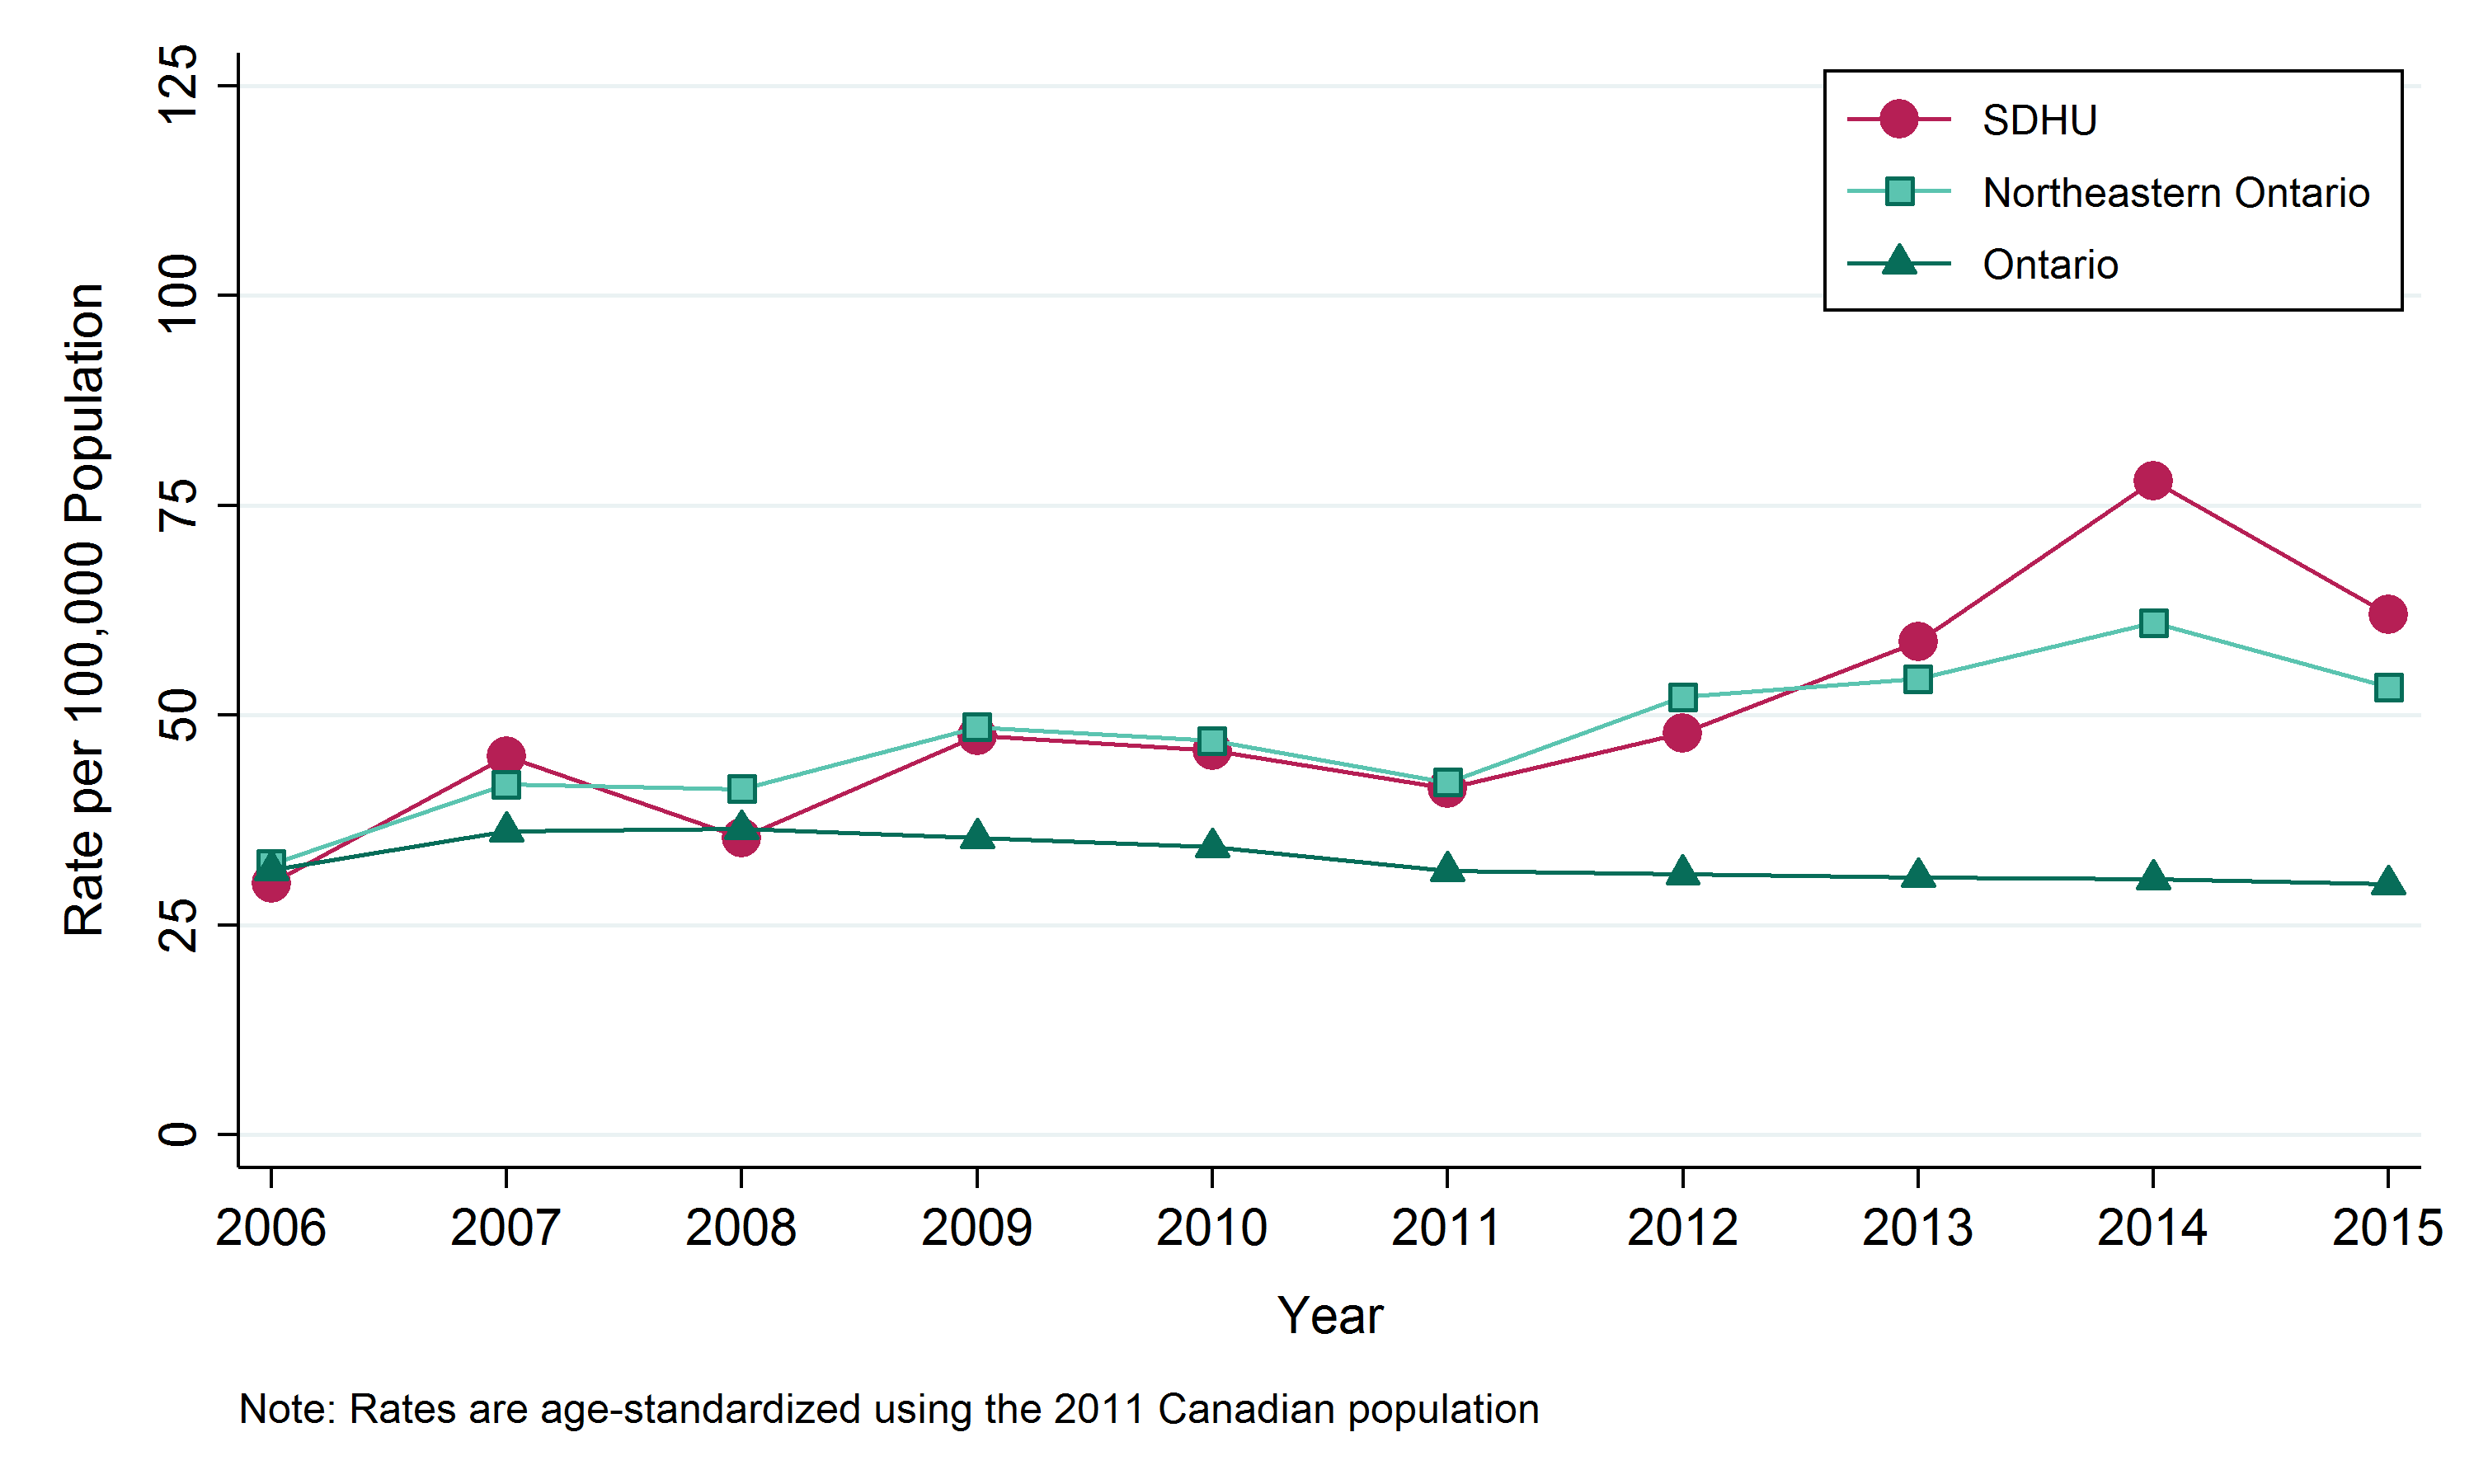
Table: Annual age-standardized rate, hepatitis C, by geographic area, 2006-2015
| Geographic Region | 2006 | 2007 | 2008 | 2009 | 2010 | 2011 | 2012 | 2013 | 2014 | 2015 |
|---|---|---|---|---|---|---|---|---|---|---|
| SDHU | 29.9 | 45.1 | 35.4 | 47.6 | 45.8 | 41.3 | 47.9 | 58.8 | 77.9 | 62.0 |
| Northeast | 32.3 | 41.8 | 41.2 | 48.6 | 47.0 | 42.0 | 52.2 | 54.3 | 61.0 | 53.4 |
| Ontario | 31.6 | 36.2 | 36.4 | 35.4 | 34.3 | 31.5 | 31.1 | 30.7 | 30.5 | 29.9 |
Table: Annual number of cases of hepatitis C, by geographic area, 2006–2015
| Geographic Region | 2006 | 2007 | 2008 | 2009 | 2010 | 2011 | 2012 | 2013 | 2014 | 2015 |
|---|---|---|---|---|---|---|---|---|---|---|
| SDHU | 61 | 90 | 71 | 96 | 91 | 82 | 94 | 116 | 151 | 119 |
| Northeast | 184 | 233 | 229 | 269 | 260 | 232 | 282 | 292 | 323 | 278 |
| Ontario | 4021 | 4619 | 4704 | 4610 | 4503 | 4172 | 4181 | 4180 | 4204 | 4164 |
Hepatitis C cases by sex
Key findings:
- Between 2011 and 2015, there were a total of 335 males and 227 females diagnosed with hepatitis C in the SDHU area, an average of 67 males and 45 females per year.
- In the SDHU area, the annual rate of hepatitis C between 2011 and 2015 was 68 per 100,000 males and 47 per 100,000 females.
- The rate of hepatitis C among males has been higher than the rate among females.
- Between the time periods 2006–2010 and 2011–2015, the rates of hepatitis C has increased for both males and females in the SDHU area.
Notes:
- Rates are age-standardized using 2011 Canadian population.
- Data Source: Infectious Diseases Query, Public Health Ontario, Extracted Feb. 2016, and Population Estimates and Projections, Ontario Ministry of Health and Long-Term Care: IntelliHEALTH ONTARIO, Extracted Sep. 2015.
Figure: Age-standardized rate, hepatitis C, by sex, Sudbury & District Health Unit (SDHU), 2006–2010 and 2011–2015
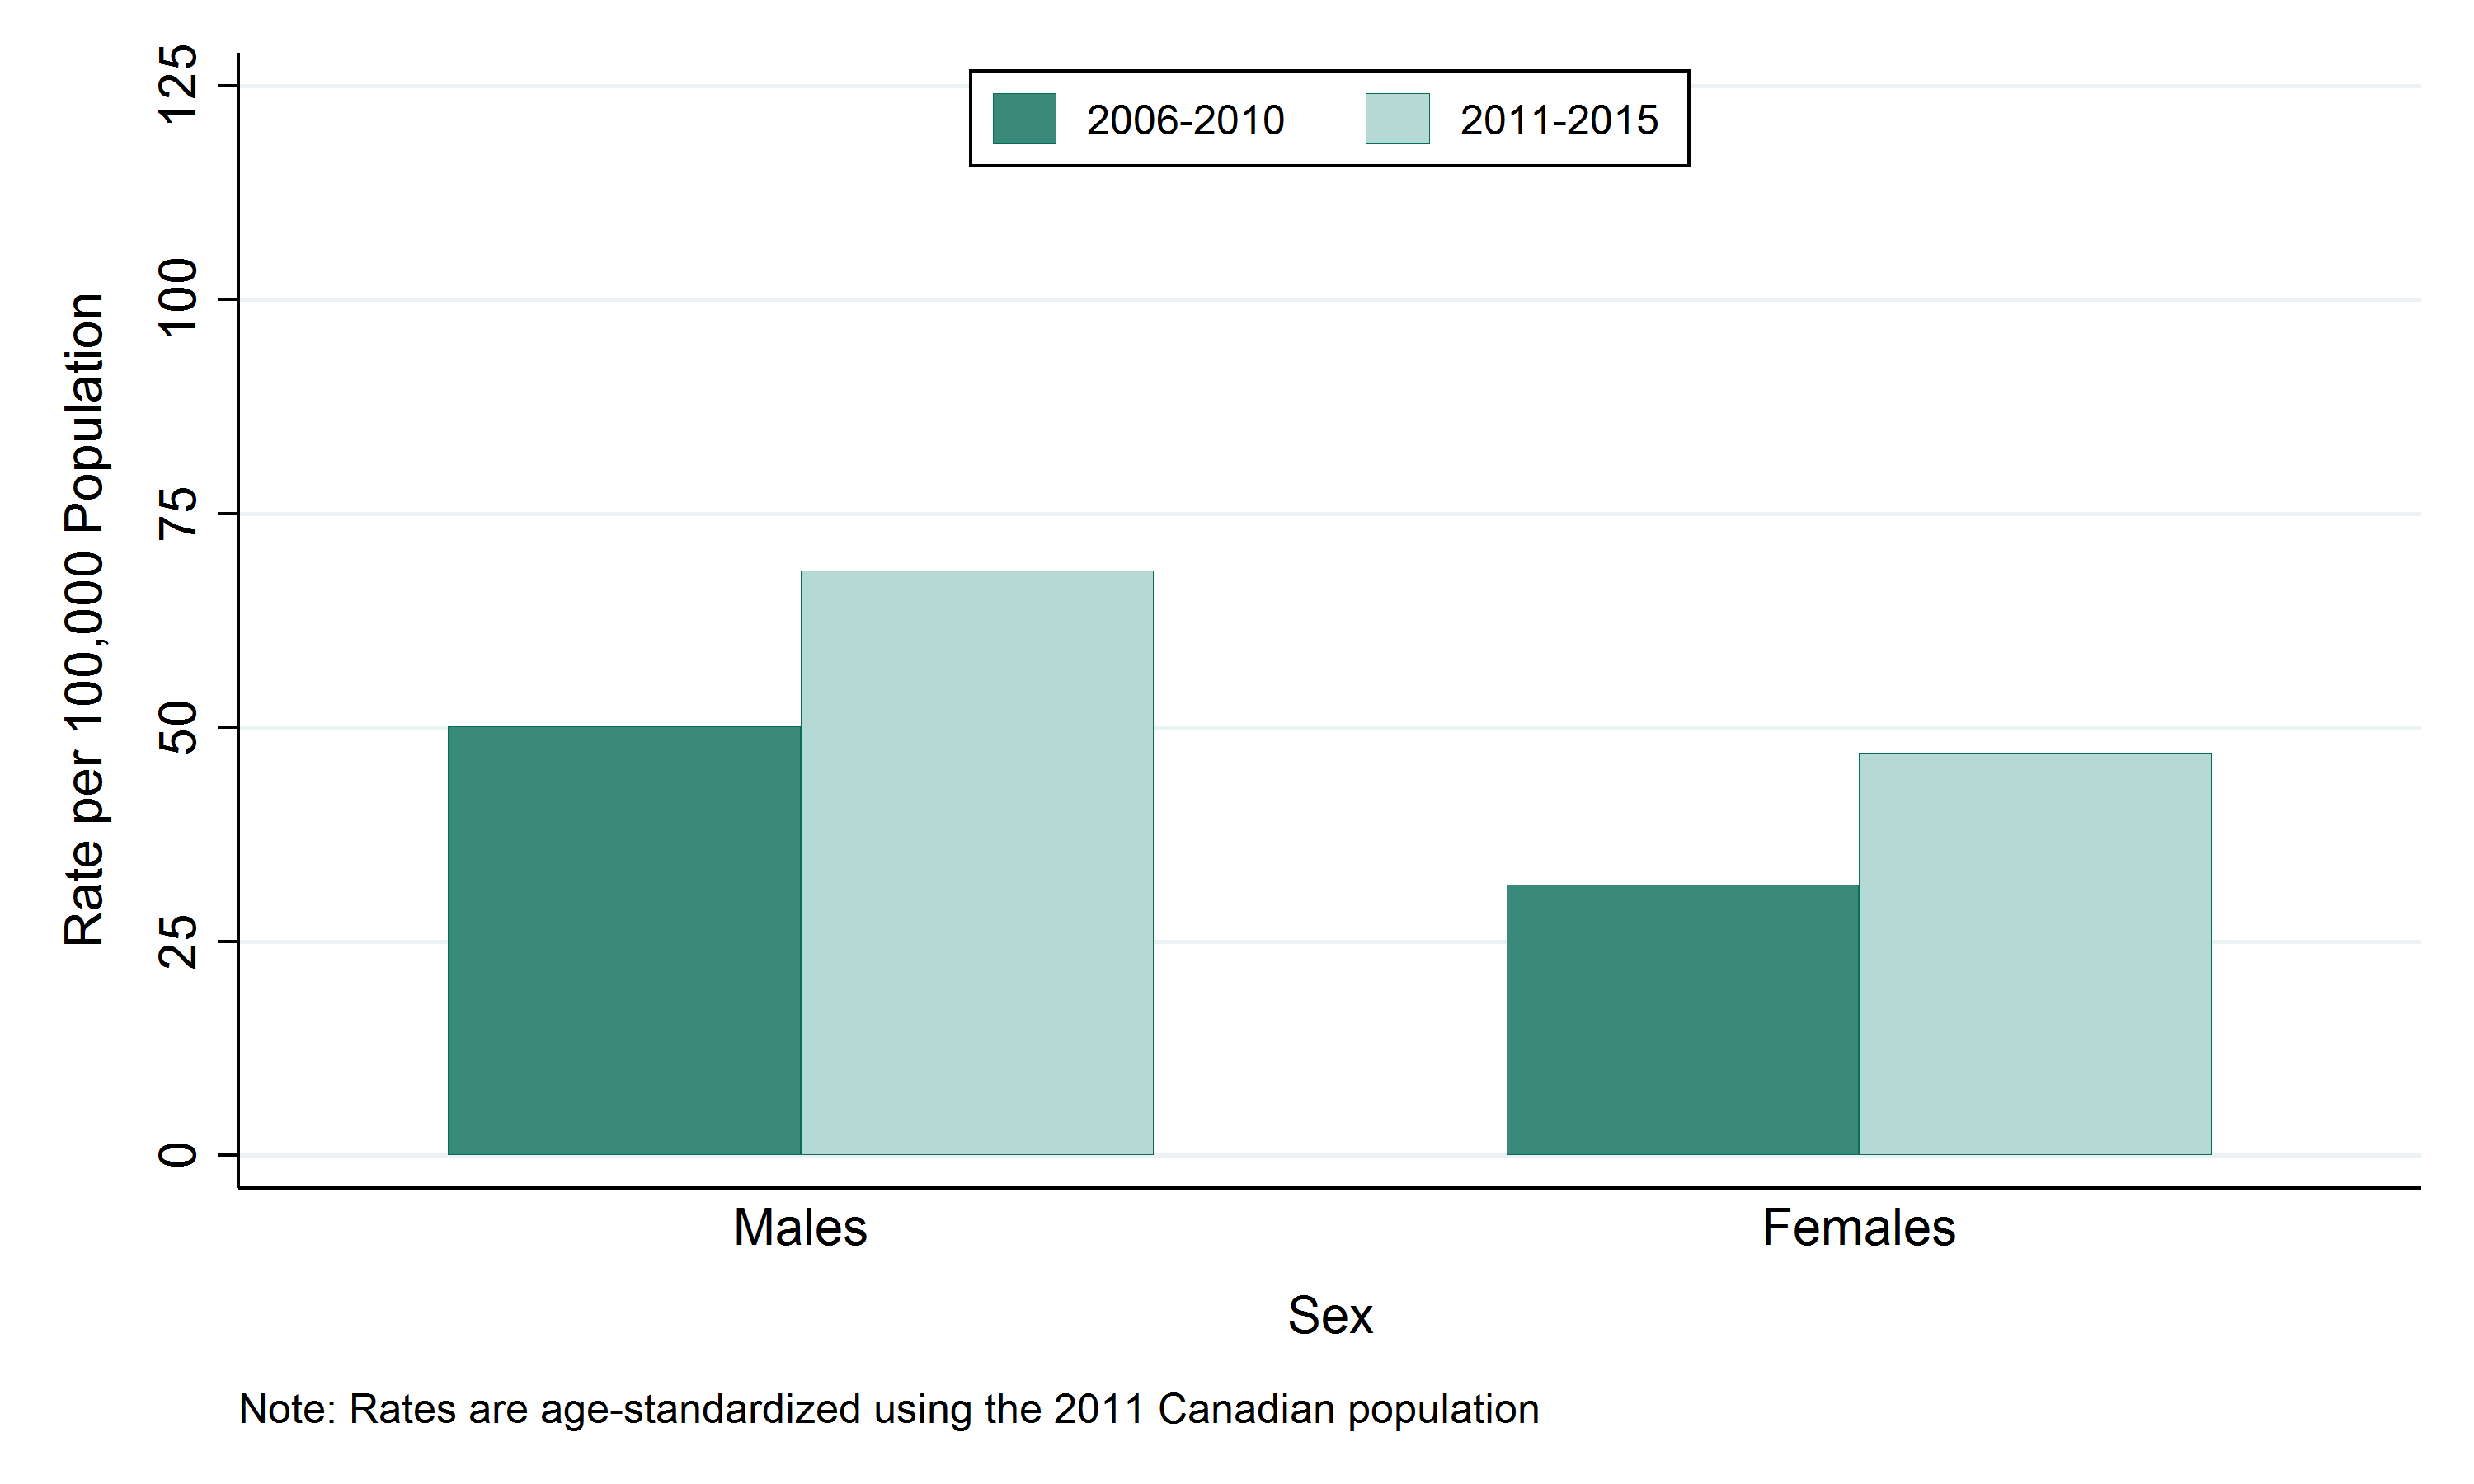
Table: Age-standardized rate, hepatitis C, by sex, Sudbury & District Health Unit (SDHU), 2006–2010 and 2011–2015
| Sex | Rate per 100,000 2006-2010 | Rate per 100,000 2011-2015 |
|---|---|---|
| Males | 50.1 | 68.3 |
| Females | 31.6 | 47 |
Table: Annual number of cases of hepatitis C, by sex, Sudbury & District Health Unit (SDHU), 2006–2010 and 2011–2015
| Sex | Total Counts 2006-2010 | Total Counts 2011-2015 | Average Annual Counts 2006-2010 | Average Annual Counts 2011-2015 |
|---|---|---|---|---|
| Males | 252 | 335 | 50.4 | 67.0 |
| Females | 157 | 227 | 31.4 | 45.4 |
Hepatitis C cases by age group
Key findings:
- Between 2011 and 2015, the highest number of hepatitis C cases was in the 20 to 44 age group, with a total of 371 cases or an average of 74 per year in the SDHU area.
- In the SDHU area, the highest annual rate of hepatitis C was in the 20 to 44 age group, with 119 cases per 100,000 population between 2011 and 2015.
- The rate of hepatitis C is highest in the 20 to 44 age group and lowest in the 0 to 19, and 65-and-over age groups.
- Between the time periods 2006–2010 and 2011–2015, the rate of hepatitis C has remained stable in all age groups except ages 20 to 44 where there was an increase.
Notes:
- Data Source: Infectious Diseases Query, Public Health Ontario, Extracted Feb. 2016, and Population Estimates and Projections, Ontario Ministry of Health and Long-Term Care: IntelliHEALTH ONTARIO, Extracted Sep. 2015.
Figure: Hepatitis C, by age group, Sudbury & District Health Unit (SDHU), 2006–2010 and 2011–2015
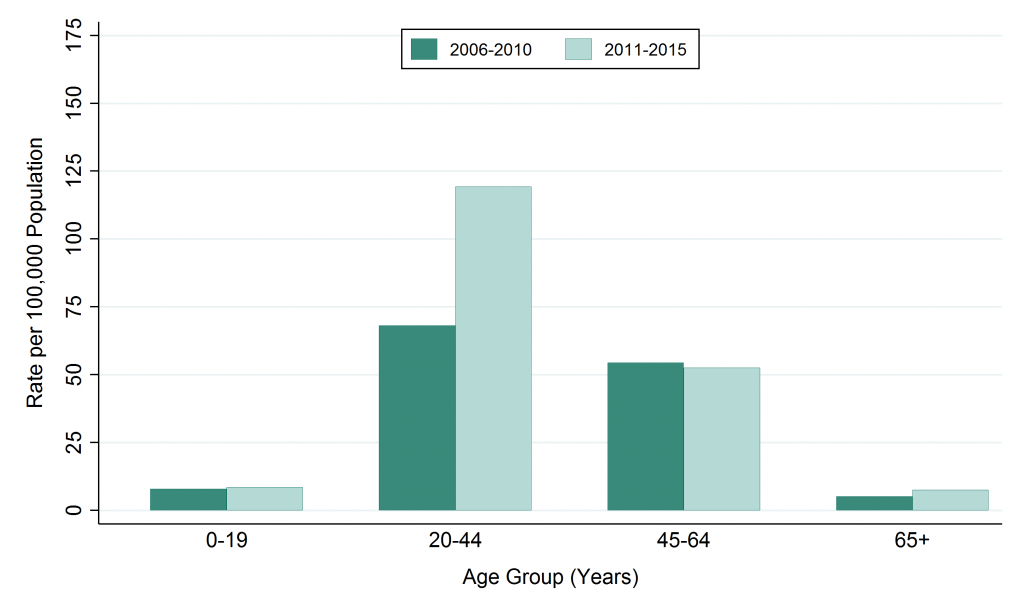
Table: Rate of Hepatitis C, by age group, Sudbury & District Health Unit (SDHU), 2006–2010 and 2011–2015

| Age Group | Rate per 100,000 2006-2010 | Rate per 100,000 2011-2015 |
|---|---|---|
| 0-19 | 7.9 | 8.6 |
| 20-44 | 68.1 | 119.3 |
| 45-64 | 54.5 | 52.5 |
| 65+ | 5.3 | 7.5 |
Table: Annual number of cases of Hepatitis C, by age group, Sudbury & District Health Unit (SDHU), 2006–2010 and 2011–2015
| Age Group | Total Counts 2006-2010 | Total Counts 2011-2015 | Average Annual Counts 2006-2010 | Average Annual Counts 2011-2015 |
|---|---|---|---|---|
| 0-19 | 18 | 18 | 3.6 | 3.6 |
| 20-44 | 221 | 371 | 44.2 | 74.2 |
| 45-64 | 162 | 160 | 32.4 | 32.0 |
| 65+ | 8 | 13 | 1.6 | 2.6 |
This item was last modified on March 26, 2018