HIV
Human immunodeficiency virus (HIV) is caused by a virus that attacks the immune system. The virus is found in blood and other body fluids, and is spread to others through sexual activities or through exposure to blood and body fluids of an infected person.
HIV is lifelong and there is no cure, but there are treatments which can reduce the amount of virus in the body and keep the immune system healthy and reduce the risk of passing their infection to others. People who are severely weakened by HIV are at risk of opportunistic infections and certain types of cancers, and are said to have acquired immunodeficiency syndrome (AIDS).
Many people who have HIV have no symptoms and do not know they are infected. They can still pass their infection to others. Symptoms may develop shortly after being infected with the virus and can include: loss of appetite, fatigue, sore throat, and night sweats.
HIV cases by geographic area
Key findings:
- In the SDHU area, there were 11 confirmed cases of HIV in 2015.
- In 2015, the rate of HIV in the SDHU area was 6 per 100,000 population.
- The rate of HIV in the SDHU area has been higher the rate in northeastern Ontario, while the rate in SDHU area has been similar to that of Ontario for most years with some fluctuations.
- Between 2006 and 2015, there was no clear trend in the rate of HIV in the SDHU area over time.
Notes:
- Rates are age-standardized using 2011 Canadian population.
- Data Source: Infectious Diseases Query, Public Health Ontario, Extracted Feb. 2016, and Population Estimates and Projections, Ontario Ministry of Health and Long-Term Care: IntelliHEALTH ONTARIO, Extracted Sep. 2015.
Figure: Annual age-standardized rate, HIV, by geographic area, 2006–2015
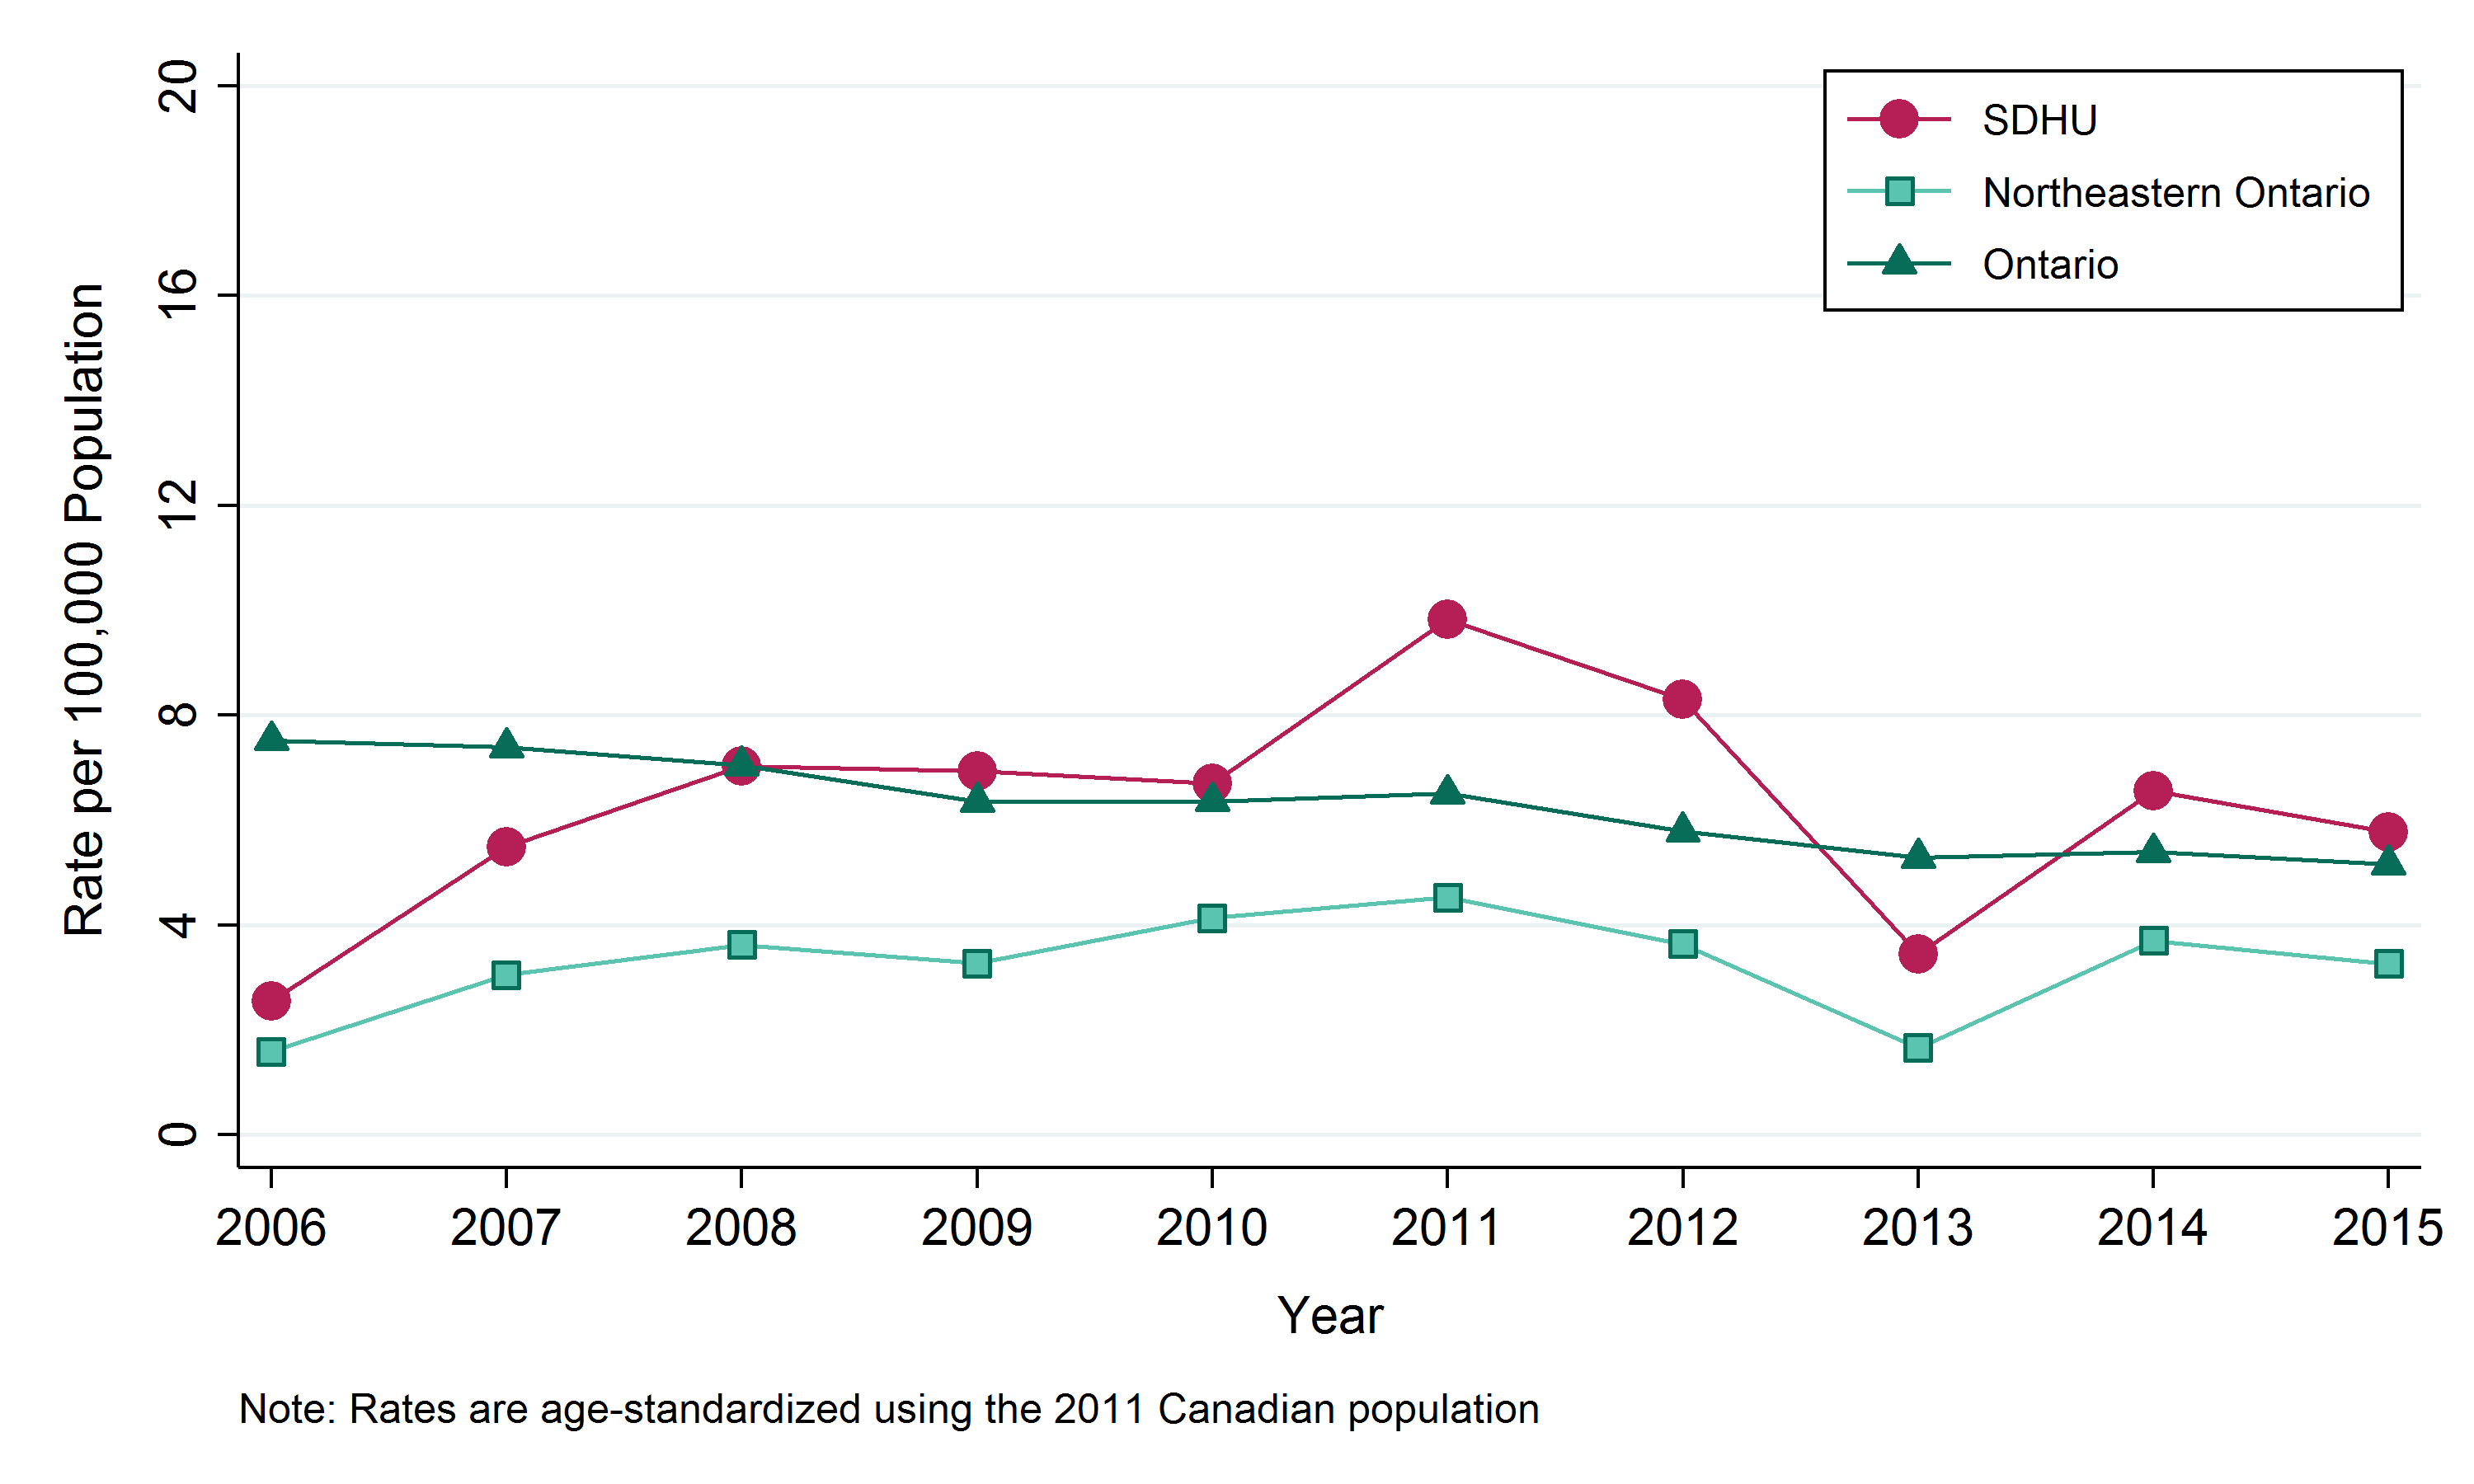
Table: Annual age-standardized rate, HIV, by geographic area, 2006–2015
| Geographic Region | 2006 | 2007 | 2008 | 2009 | 2010 | 2011 | 2012 | 2013 | 2014 | 2015 |
|---|---|---|---|---|---|---|---|---|---|---|
| SDHU | 2.5 | 5.5 | 7.0 | 6.9 | 6.7 | 9.8 | 8.3 | 3.5 | 6.6 | 5.8 |
| Northeast | 1.6 | 3.1 | 3.6 | 3.3 | 4.1 | 4.5 | 3.6 | 1.7 | 3.7 | 3.3 |
| Ontario | 7.5 | 7.4 | 7.0 | 6.4 | 6.4 | 6.5 | 5.8 | 5.3 | 5.4 | 5.2 |
Table: Annual number of cases of HIV, by geographic area, 2006–2015
| Geographic Region | 2006 | 2007 | 2008 | 2009 | 2010 | 2011 | 2012 | 2013 | 2014 | 2015 |
|---|---|---|---|---|---|---|---|---|---|---|
| SDHU | 5 | 11 | 14 | 14 | 13 | 19 | 16 | 7 | 12 | 11 |
| Northeast | 9 | 17 | 20 | 18 | 22 | 24 | 19 | 9 | 19 | 17 |
| Ontario | 1012 | 995 | 945 | 855 | 853 | 879 | 788 | 723 | 742 | 715 |
HIV cases by sex
Key findings:
- Between 2011 and 2015, there were a total of 42 males and 23 females diagnosed with HIV in the SDHU area, an average of 8 males and 5 females per year.
- In the SDHU area, the annual rate of HIV between 2011 and 2015 was 9 per 100,000 males and 5 per 100,000 females.
- The rate of HIV among males has been higher than the rate among females.
- Between the time periods 2006–2010 and 2011–2015, the rates of HIV remained stable for both males and females in the SDHU area.
Notes:
- Rates are age-standardized using 2011 Canadian population.
- Data Source: Infectious Diseases Query, Public Health Ontario, Extracted Feb. 2016, and Population Estimates and Projections, Ontario Ministry of Health and Long-Term Care: IntelliHEALTH ONTARIO, Extracted Sep. 2015.
Figure: Age-standardized rate, HIV, by sex, Sudbury & District Health Unit (SDHU), 2006–2010 and 2011–2015
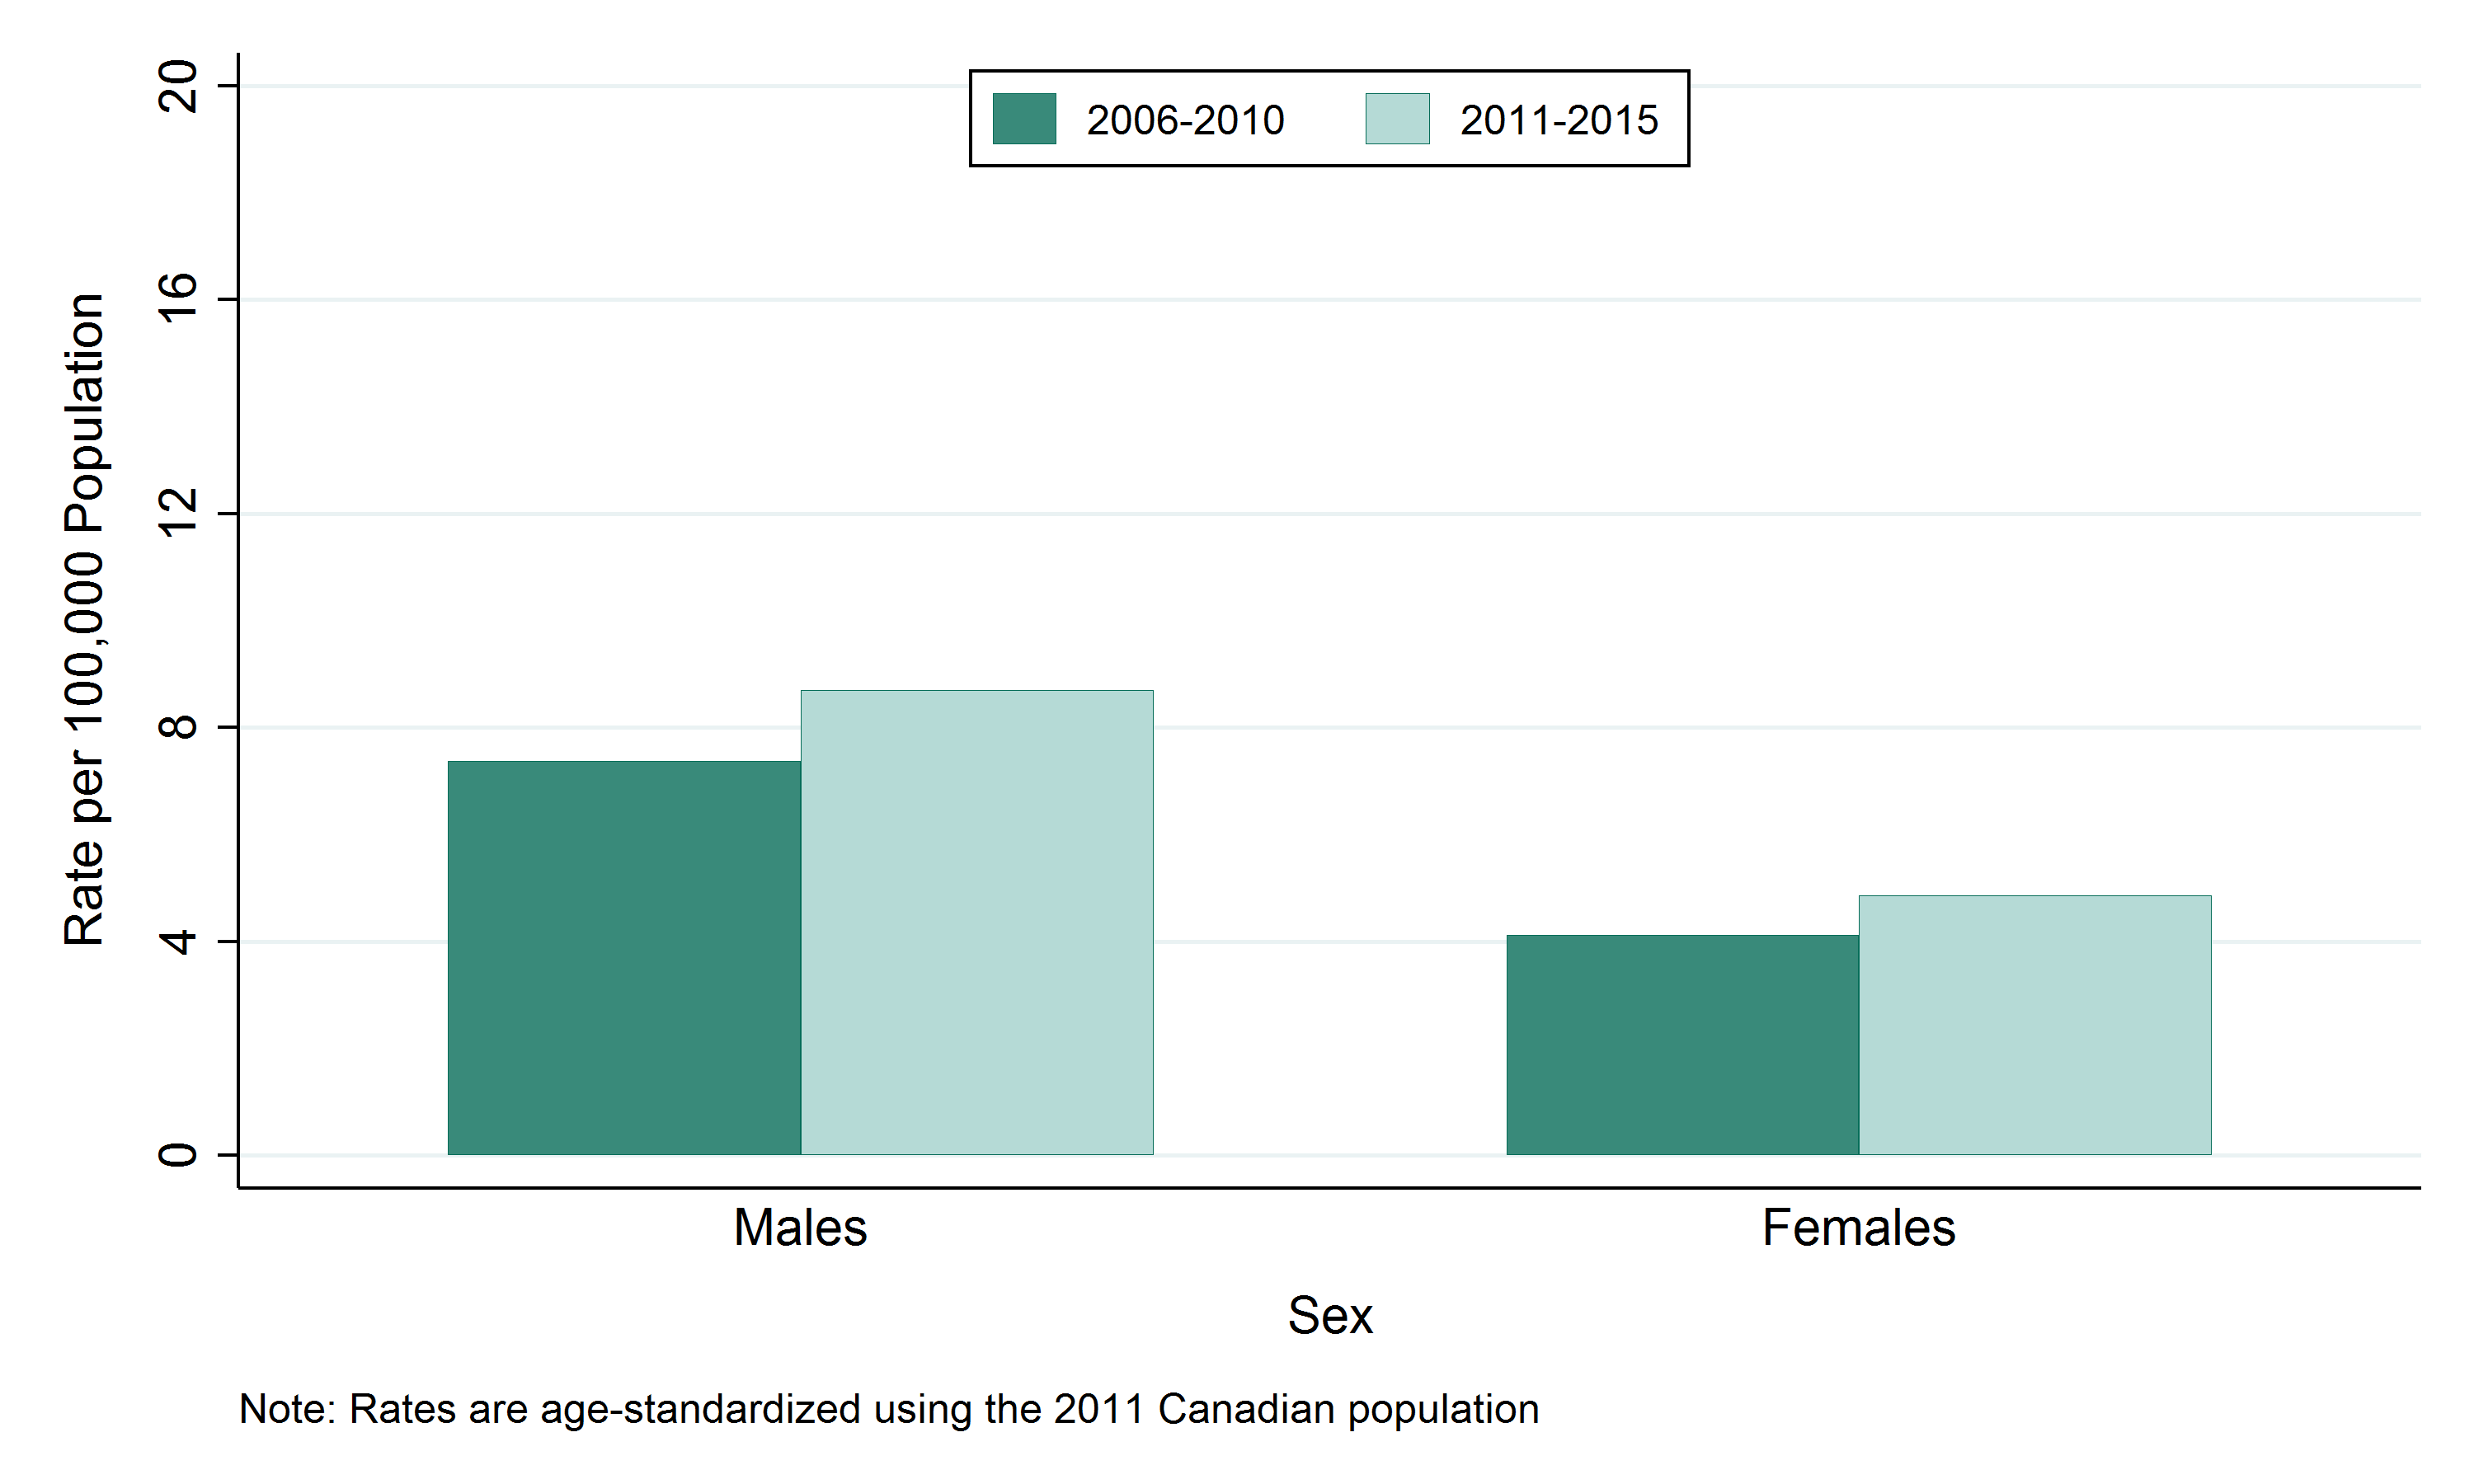
Table: Age-standardized rate, HIV, by sex, Sudbury & District Health Unit (SDHU), 2006–2010 and 2011–2015
| Sex | Rate per 100,000 2006-2010 | Rate per 100,000 2011-2015 |
|---|---|---|
| Males | 7.4 | 8.7 |
| Females | 4.1 | 4.9 |
Table: Annual number of cases of HIV, by sex, Sudbury & District Health Unit (SDHU), 2006–2010 and 2011–2015
| Sex | Total Counts 2006-2010 | Total Counts 2011-2015 | Average Annual Counts 2006-2010 | Average Annual Counts 2011-2015 |
|---|---|---|---|---|
| Males | 37 | 42 | 7.4 | 8.4 |
| Females | 20 | 23 | 4.0 | 4.6 |
HIV cases by age group
Key findings:
- Between 2011 and 2015, the highest number of HIV cases was in the 20 to 44 age group, with a total of 43 cases or an average of 9 per year in the SDHU area.
- In the SDHU area, the highest annual rate of HIV was in the 20 to 44 age group, with 14 cases per 100,000 population between 2011 and 2015.
- The rate of HIV is highest in the 20 to 44 age group and lowest in the 0 to 19, and 65-and-over age groups.
- Between the time periods 2006–2010 and 2011–2015, the rate of HIV has increased slightly in age groups 20 to 44, and 45 to 64.
Notes:
- Data Source: Infectious Diseases Query, Public Health Ontario, Extracted Feb. 2016, and Population Estimates and Projections, Ontario Ministry of Health and Long-Term Care: IntelliHEALTH ONTARIO, Extracted Sep. 2015.
Figure: HIV, by age group, Sudbury & District Health Unit (SDHU), 2006–2010 and 2011–2015
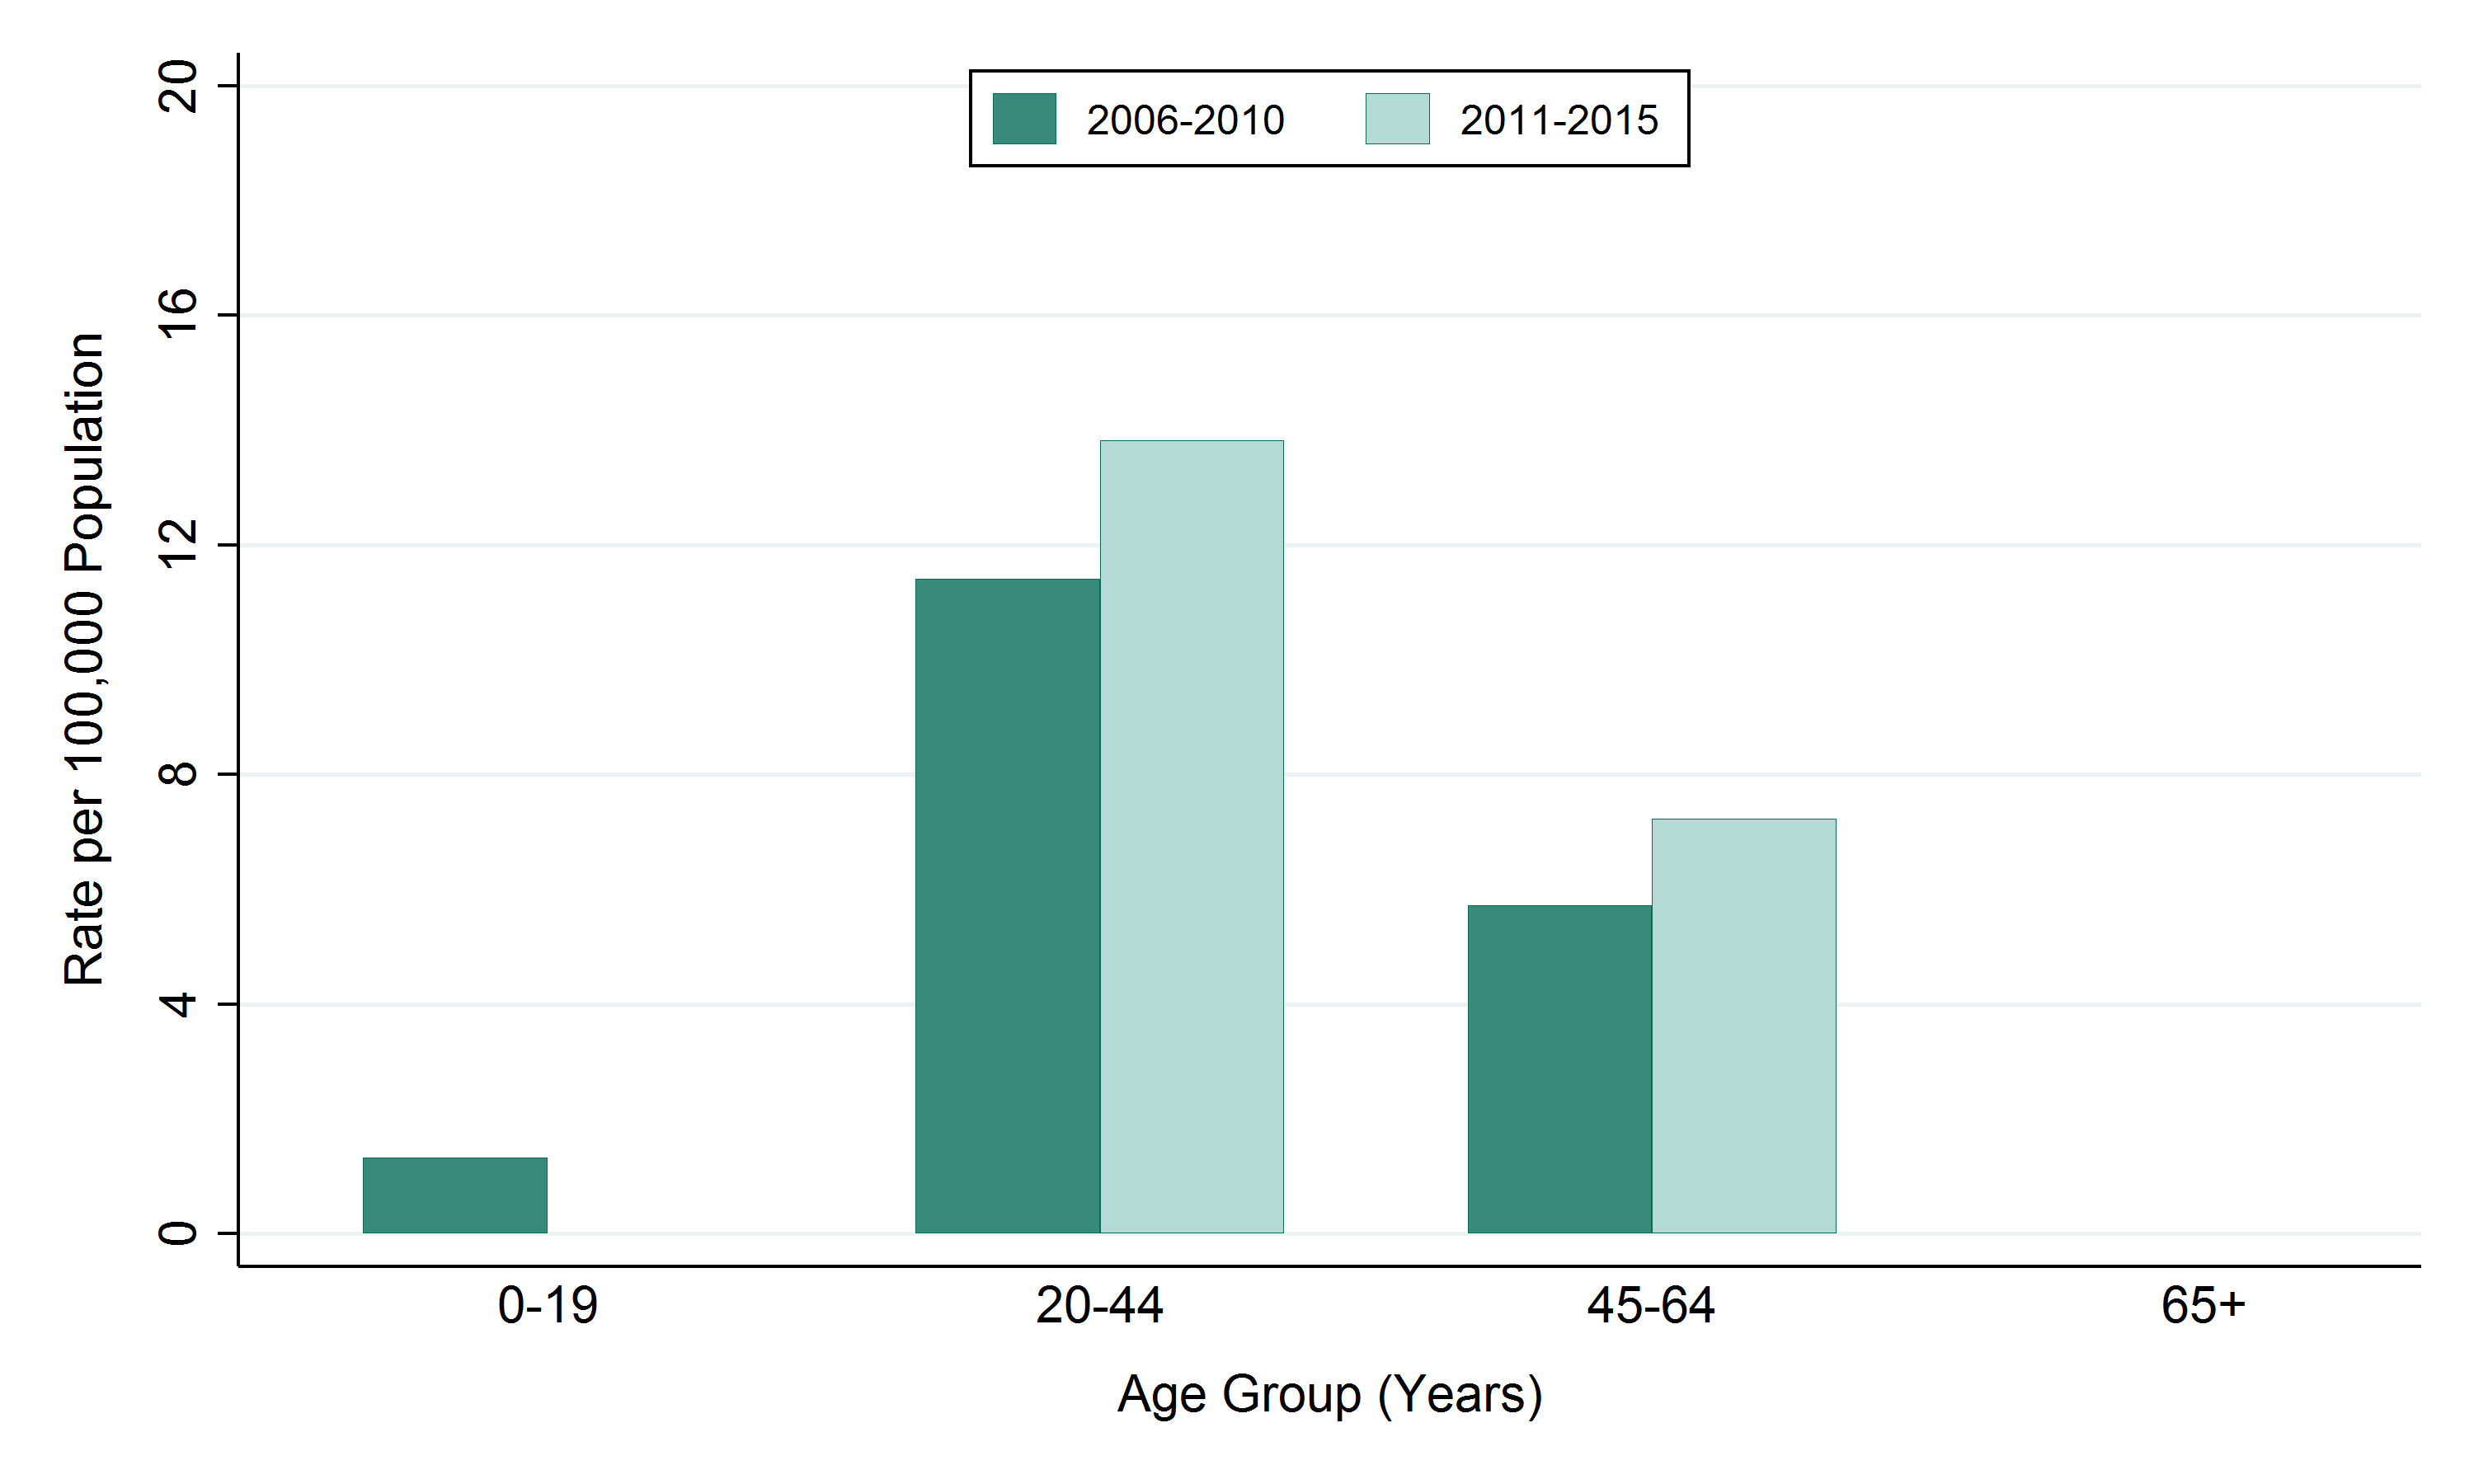
Table: Rate of HIV, by age group, Sudbury & District Health Unit (SDHU), 2006–2010 and 2011–2015
| Age Group | Rate per 100,000 2006-2010 | Rate per 100,000 2011-2015 |
|---|---|---|
| 0-19 | 1.3 | 0 |
| 20-44 | 11.4 | 13.8 |
| 45-64 | 5.7 | 7.2 |
| 65+ | 0 | 0 |
Table: Annual number of HIV, by age group, Sudbury & District Health Unit (SDHU), 2006–2010 and 2011–2015
| Age Group | Total Counts 2006-2010 | Total Counts 2011-2015 | Average Annual Counts 2006-2010 | Average Annual Counts 2011-2015 |
|---|---|---|---|---|
| 0-19 | 3 | 0 | 0.6 | 0.0 |
| 20-44 | 37 | 43 | 7.4 | 8.6 |
| 45-64 | 17 | 22 | 3.4 | 4.4 |
| 65+ | 0 | 0 | 0.0 | 0.0 |
This item was last modified on March 26, 2018