Giardiasis
Giardiasis is an intestinal infection caused by a parasite that produces diarrheal illness. The giardia parasite is found in the environment on surfaces or in soil, food or water that has been contaminated with feces from infected humans or animals. It can survive in the environment in lakes, creeks, and ponds for long periods of time.
While the parasite can be spread in different ways, ingestion of contaminated water, by drinking or accidentally swallowing it while swimming or during other water activities, is the most common cause of infection. Travel and contact with animals are also important risk factors for infection.
Giardia can also be spread from person-to-person through contact with the feces of someone who has the infection. In North America, infections tend to occur most commonly in late summer and early fall.
Giardiasis cases by geographic area
Key findings:
- In the SDHU area, there were 17 confirmed cases of giardiasis in 2015.
- In 2015, the rate of giardiasis in the SDHU area was 9 per 100,000 population.
- The rate of giardiasis in the SDHU area has been similar to the rate in northeastern Ontario, while the rate in both the SDHU area and northeastern Ontario have been lower than that of Ontario for most years.
- Between 2006 and 2015, there was no clear trend in the rate of giardiasis in the SDHU area over time.
Notes:
- Rates are age-standardized using 2011 Canadian population.
- Data Source: Infectious Diseases Query, Public Health Ontario, Extracted Feb. 2016, and Population Estimates and Projections, Ontario Ministry of Health and Long-Term Care: IntelliHEALTH ONTARIO, Extracted Sep. 2015.
Figure: Annual age-standardized rate, giardiasis, by geographic area, 2006–2015
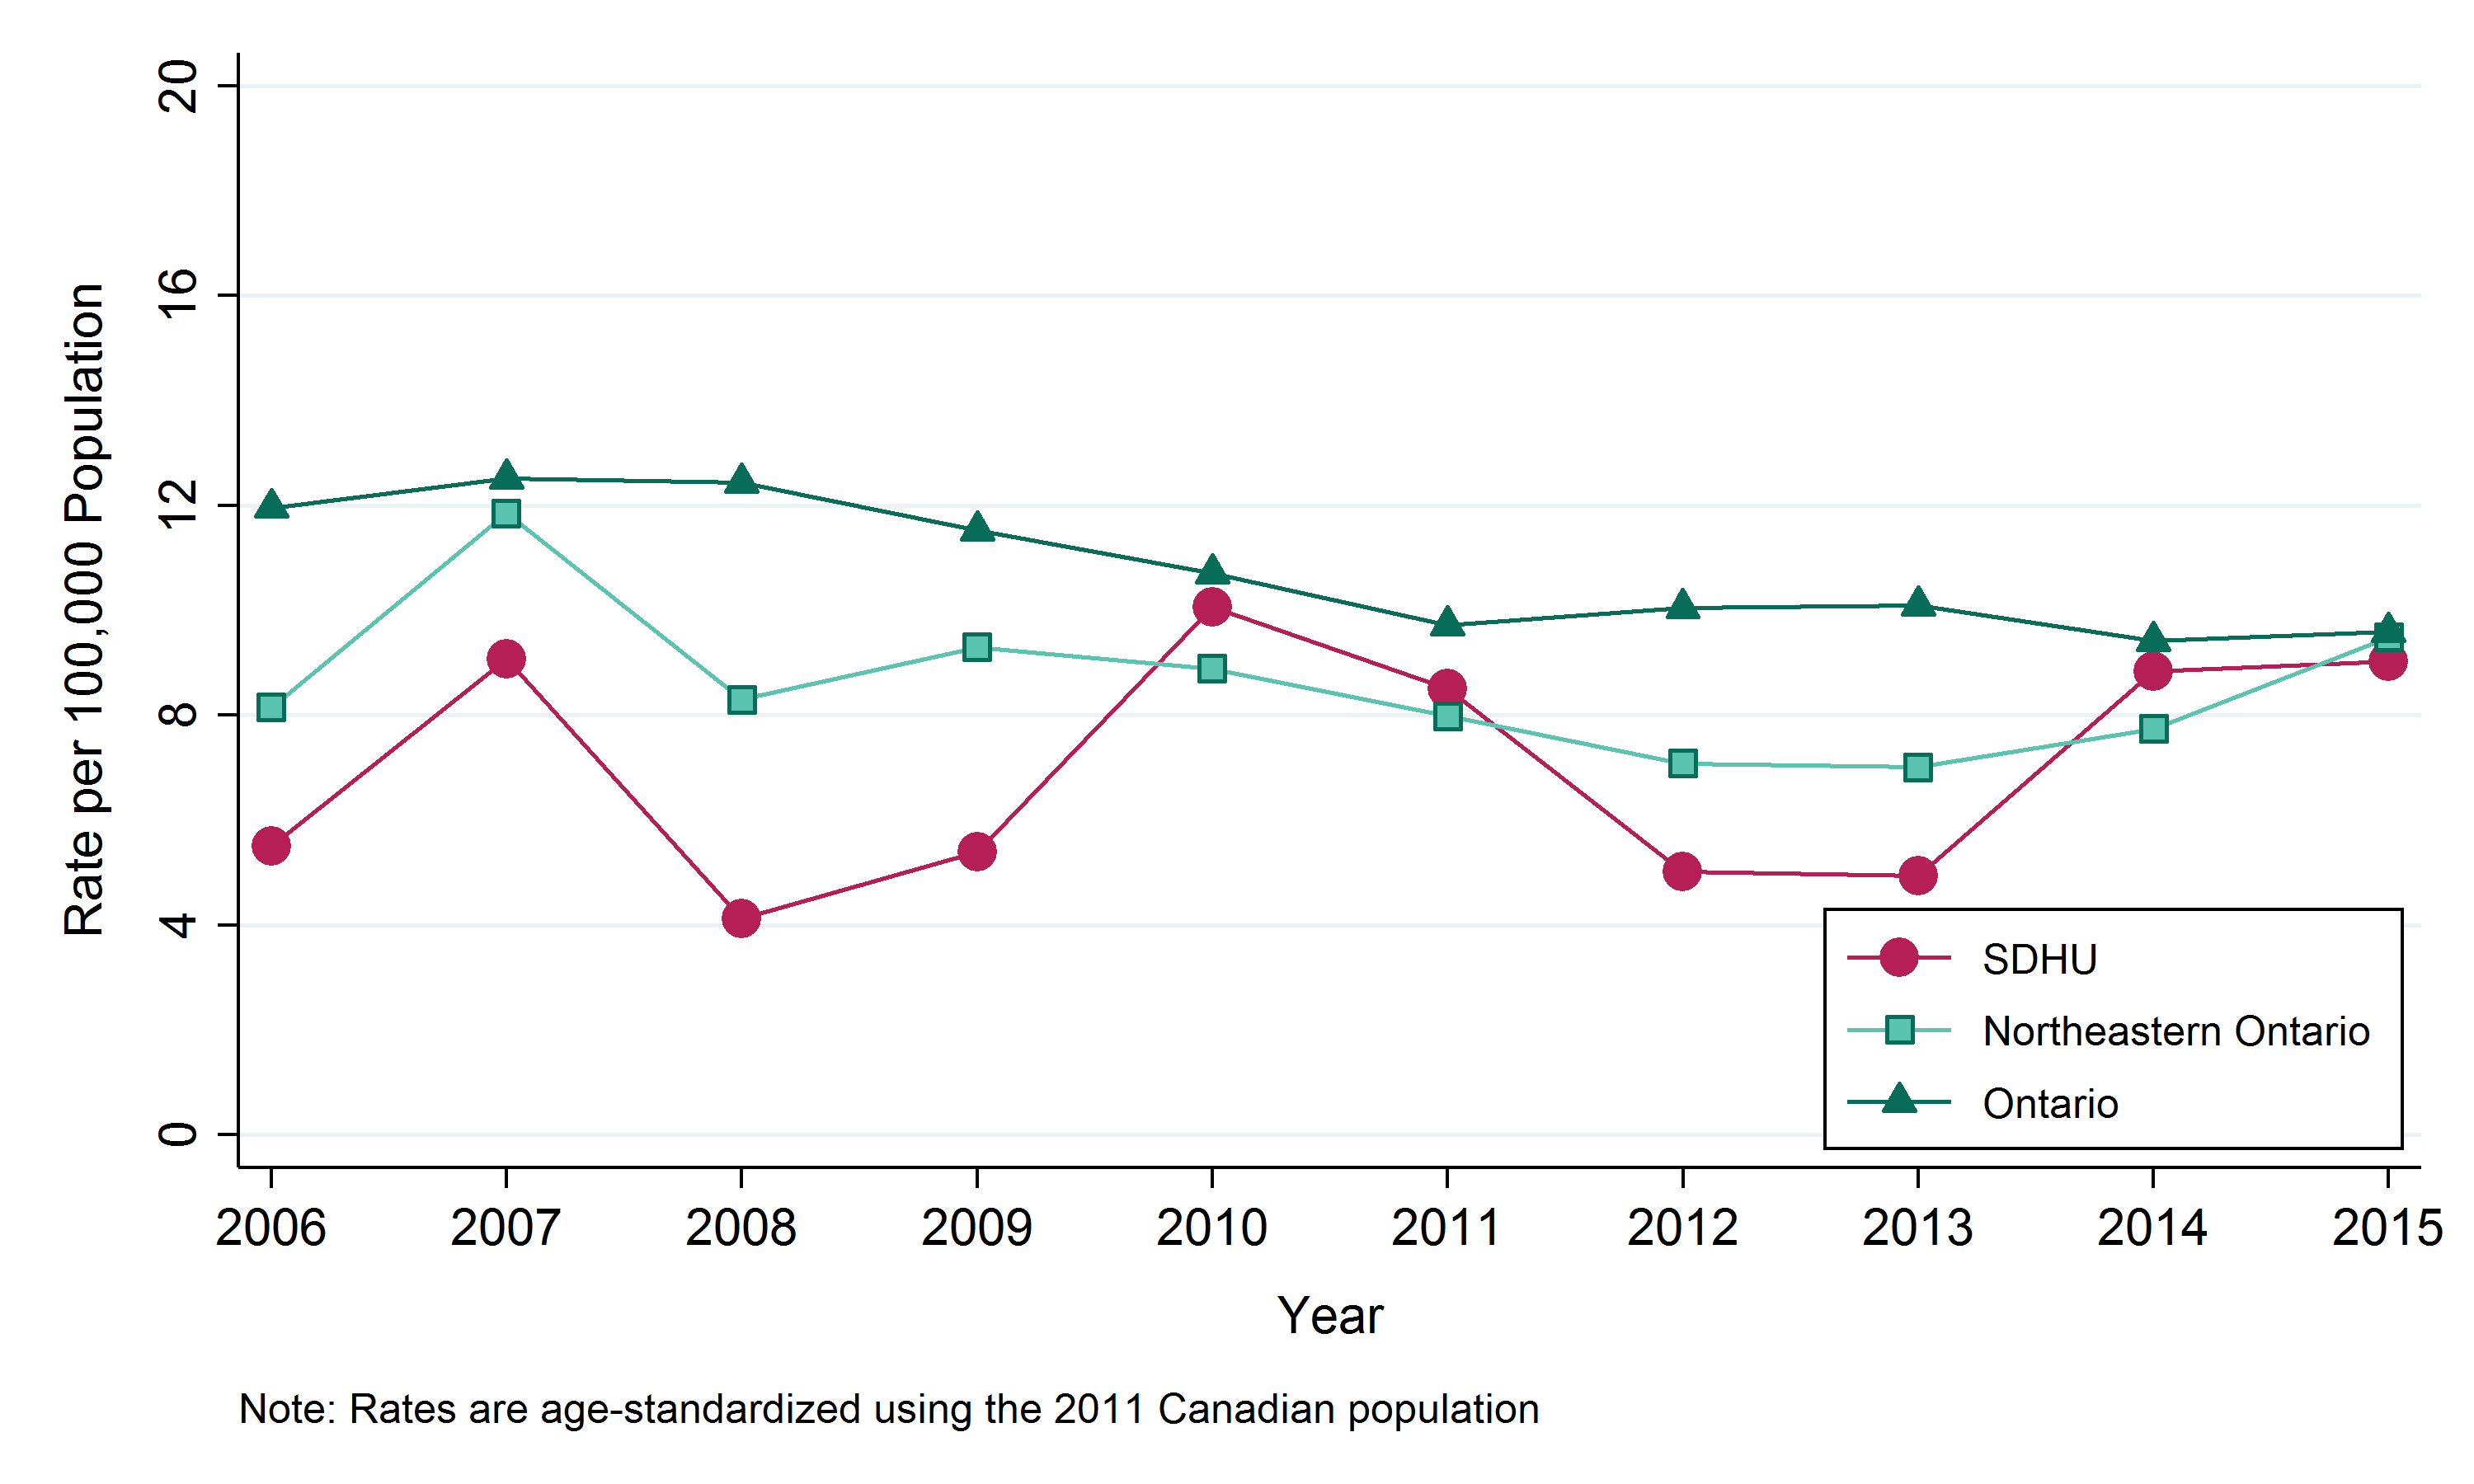
Table: Annual age-standardized rate, giardiasis, by geographic area, 2006–2015
| Geographic Region | 2006 | 2007 | 2008 | 2009 | 2010 | 2011 | 2012 | 2013 | 2014 | 2015 |
|---|---|---|---|---|---|---|---|---|---|---|
| SDHU | 5.5 | 9.1 | 4.1 | 5.4 | 10.1 | 8.5 | 5.0 | 4.9 | 8.8 | 9.0 |
| Northeast | 8.1 | 11.9 | 8.3 | 9.3 | 8.9 | 8.0 | 7.1 | 7.0 | 7.7 | 9.5 |
| Ontario | 12.0 | 12.5 | 12.4 | 11.5 | 10.7 | 9.7 | 10.0 | 10.1 | 9.4 | 9.6 |
Table: Annual number of cases of giardiasis, by geographic area, 2006–2015
| Geographic Region | 2006 | 2007 | 2008 | 2009 | 2010 | 2011 | 2012 | 2013 | 2014 | 2015 |
|---|---|---|---|---|---|---|---|---|---|---|
| SDHU | 11 | 18 | 8 | 11 | 20 | 17 | 10 | 10 | 17 | 17 |
| Northeast | 46 | 66 | 46 | 53 | 49 | 45 | 40 | 39 | 42 | 50 |
| Ontario | 1543 | 1615 | 1616 | 1512 | 1413 | 1293 | 1351 | 1366 | 1286 | 1321 |
Giardiasis cases by sex
Key findings:
- Between 2011 and 2015, there were a total of 48 males and 23 females diagnosed with giardiasis in the SDHU area, an average of 10 males and 5 females per year.
- In the SDHU area, the annual rate of giardiasis between 2011 and 2015 was 10 per 100,000 males and 5 per 100,000 females.
- The rate of giardiasis among males has been higher than the rate among females.
- Between the time periods 2006–2010 and 2011–2015, the rates of giardiasis has remained stable for both males and females in the SDHU area.
Notes:
- Rates are age-standardized using 2011 Canadian population.
- Data Source: Infectious Diseases Query, Public Health Ontario, Extracted Feb. 2016, and Population Estimates and Projections, Ontario Ministry of Health and Long-Term Care: IntelliHEALTH ONTARIO, Extracted Sep. 2015.
Figure: Age-Standardized rate, giardiasis, by sex, Sudbury & District Health Unit (SDHU), 2006–2010 and 2011–2015
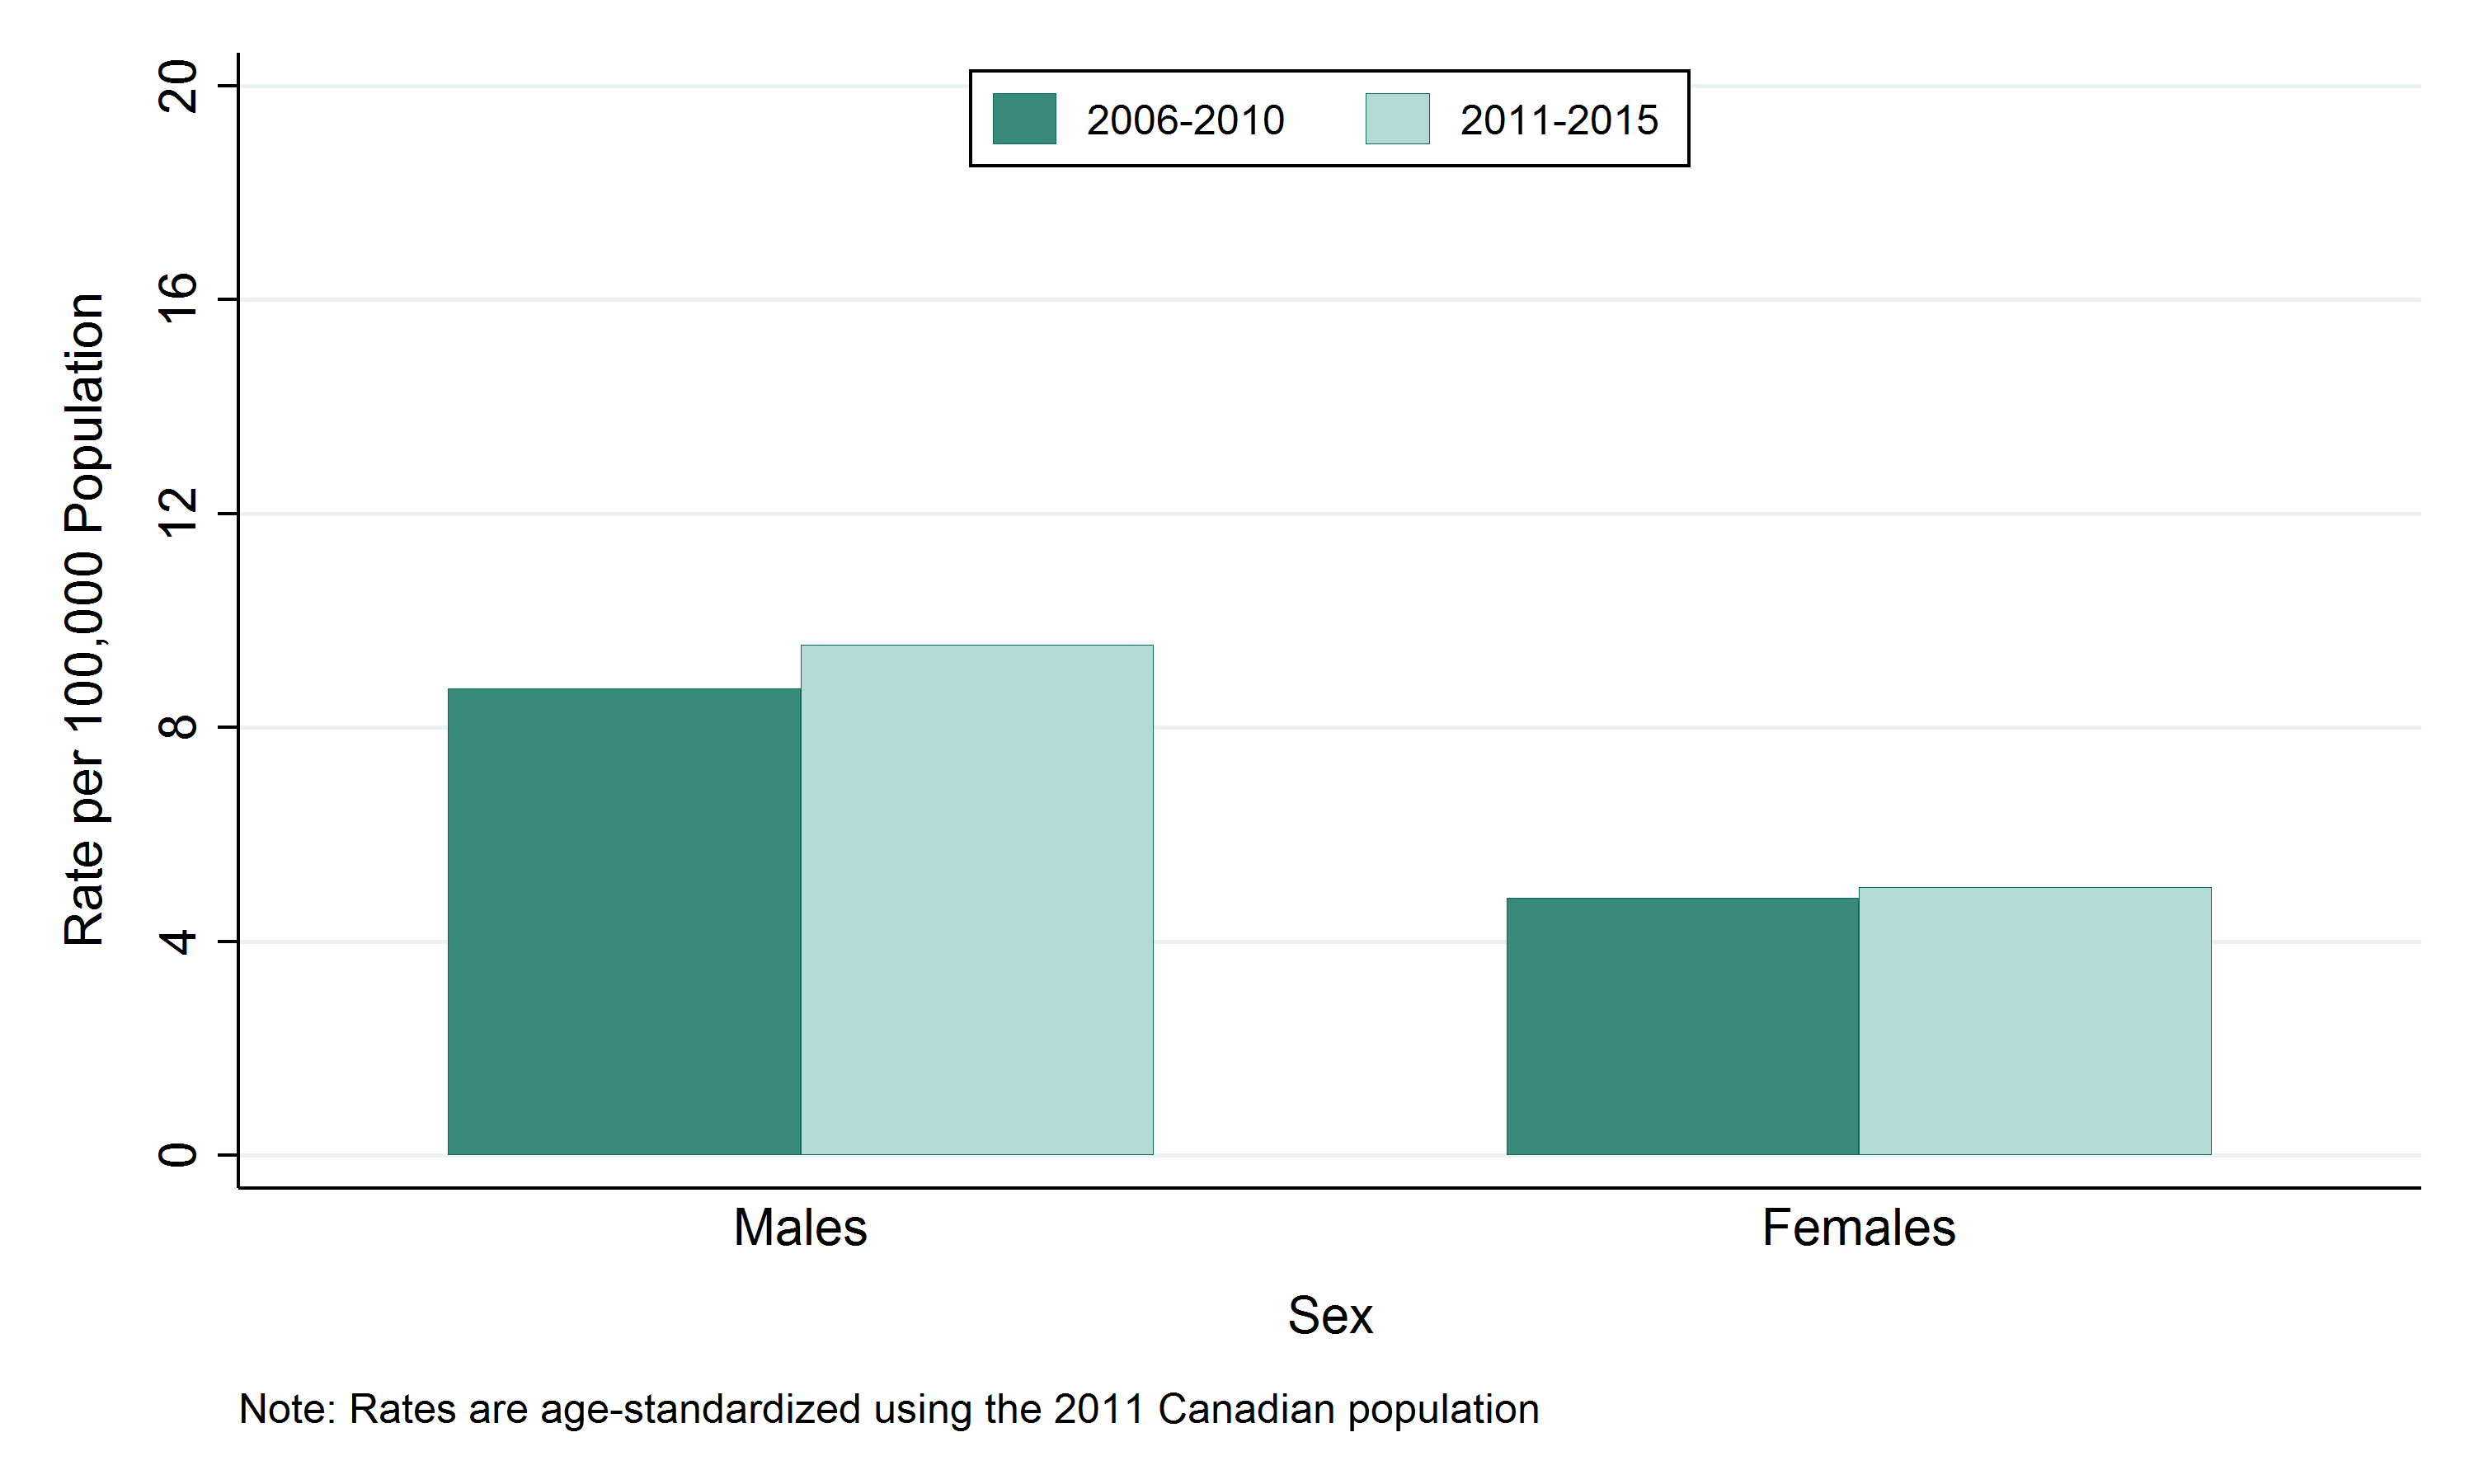
Table: Age-standardized rate, giardiasis, by sex, Sudbury & District Health Unit (SDHU), 2006–2010 and 2011–2015
| Sex | Rate per 100,000 2006-2010 | Rate per 100,000 2011-2015 |
|---|---|---|
| Males | 8.7 | 9.5 |
| Females | 4.8 | 5 |
Table: Annual number of cases of giardiasis, by sex, Sudbury & District Health Unit (SDHU), 2006–2010 and 2011–2015
| Sex | Total Counts 2006-2010 | Total Counts 2011-2015 | Average Annual Counts 2006-2010 | Average Annual Counts 2011-2015 |
|---|---|---|---|---|
| Males | 44 | 48 | 8.8 | 9.6 |
| Females | 24 | 23 | 4.8 | 4.6 |
Giardiasis cases by age group
Key findings:
- Between 2011 and 2015, the highest number of giardiasis cases was in the 20 to 44 age group, with a total of 34 cases or an average of 7 per year in the SDHU area.
- In the SDHU area, the highest annual rate of giardiasis was in the 20 to 44 age group, with 11 cases per 100,000 population between 2011 and 2015.
- The rate of giardiasis is highest in the 20 to 44 age group and fairly similar in rest of the age groups.
- Between the time periods 2006–2010 and 2011–2015, the rate of giardiasis has remained relatively stable in all age groups.
Notes:
- Data Source: Infectious Diseases Query, Public Health Ontario, Extracted Feb. 2016, and Population Estimates and Projections, Ontario Ministry of Health and Long-Term Care: IntelliHEALTH ONTARIO, Extracted Sep. 2015.
Figure: Giardiasis by age group, Sudbury & District Health unit (SDHU) 2006–2010 and 2011–2015
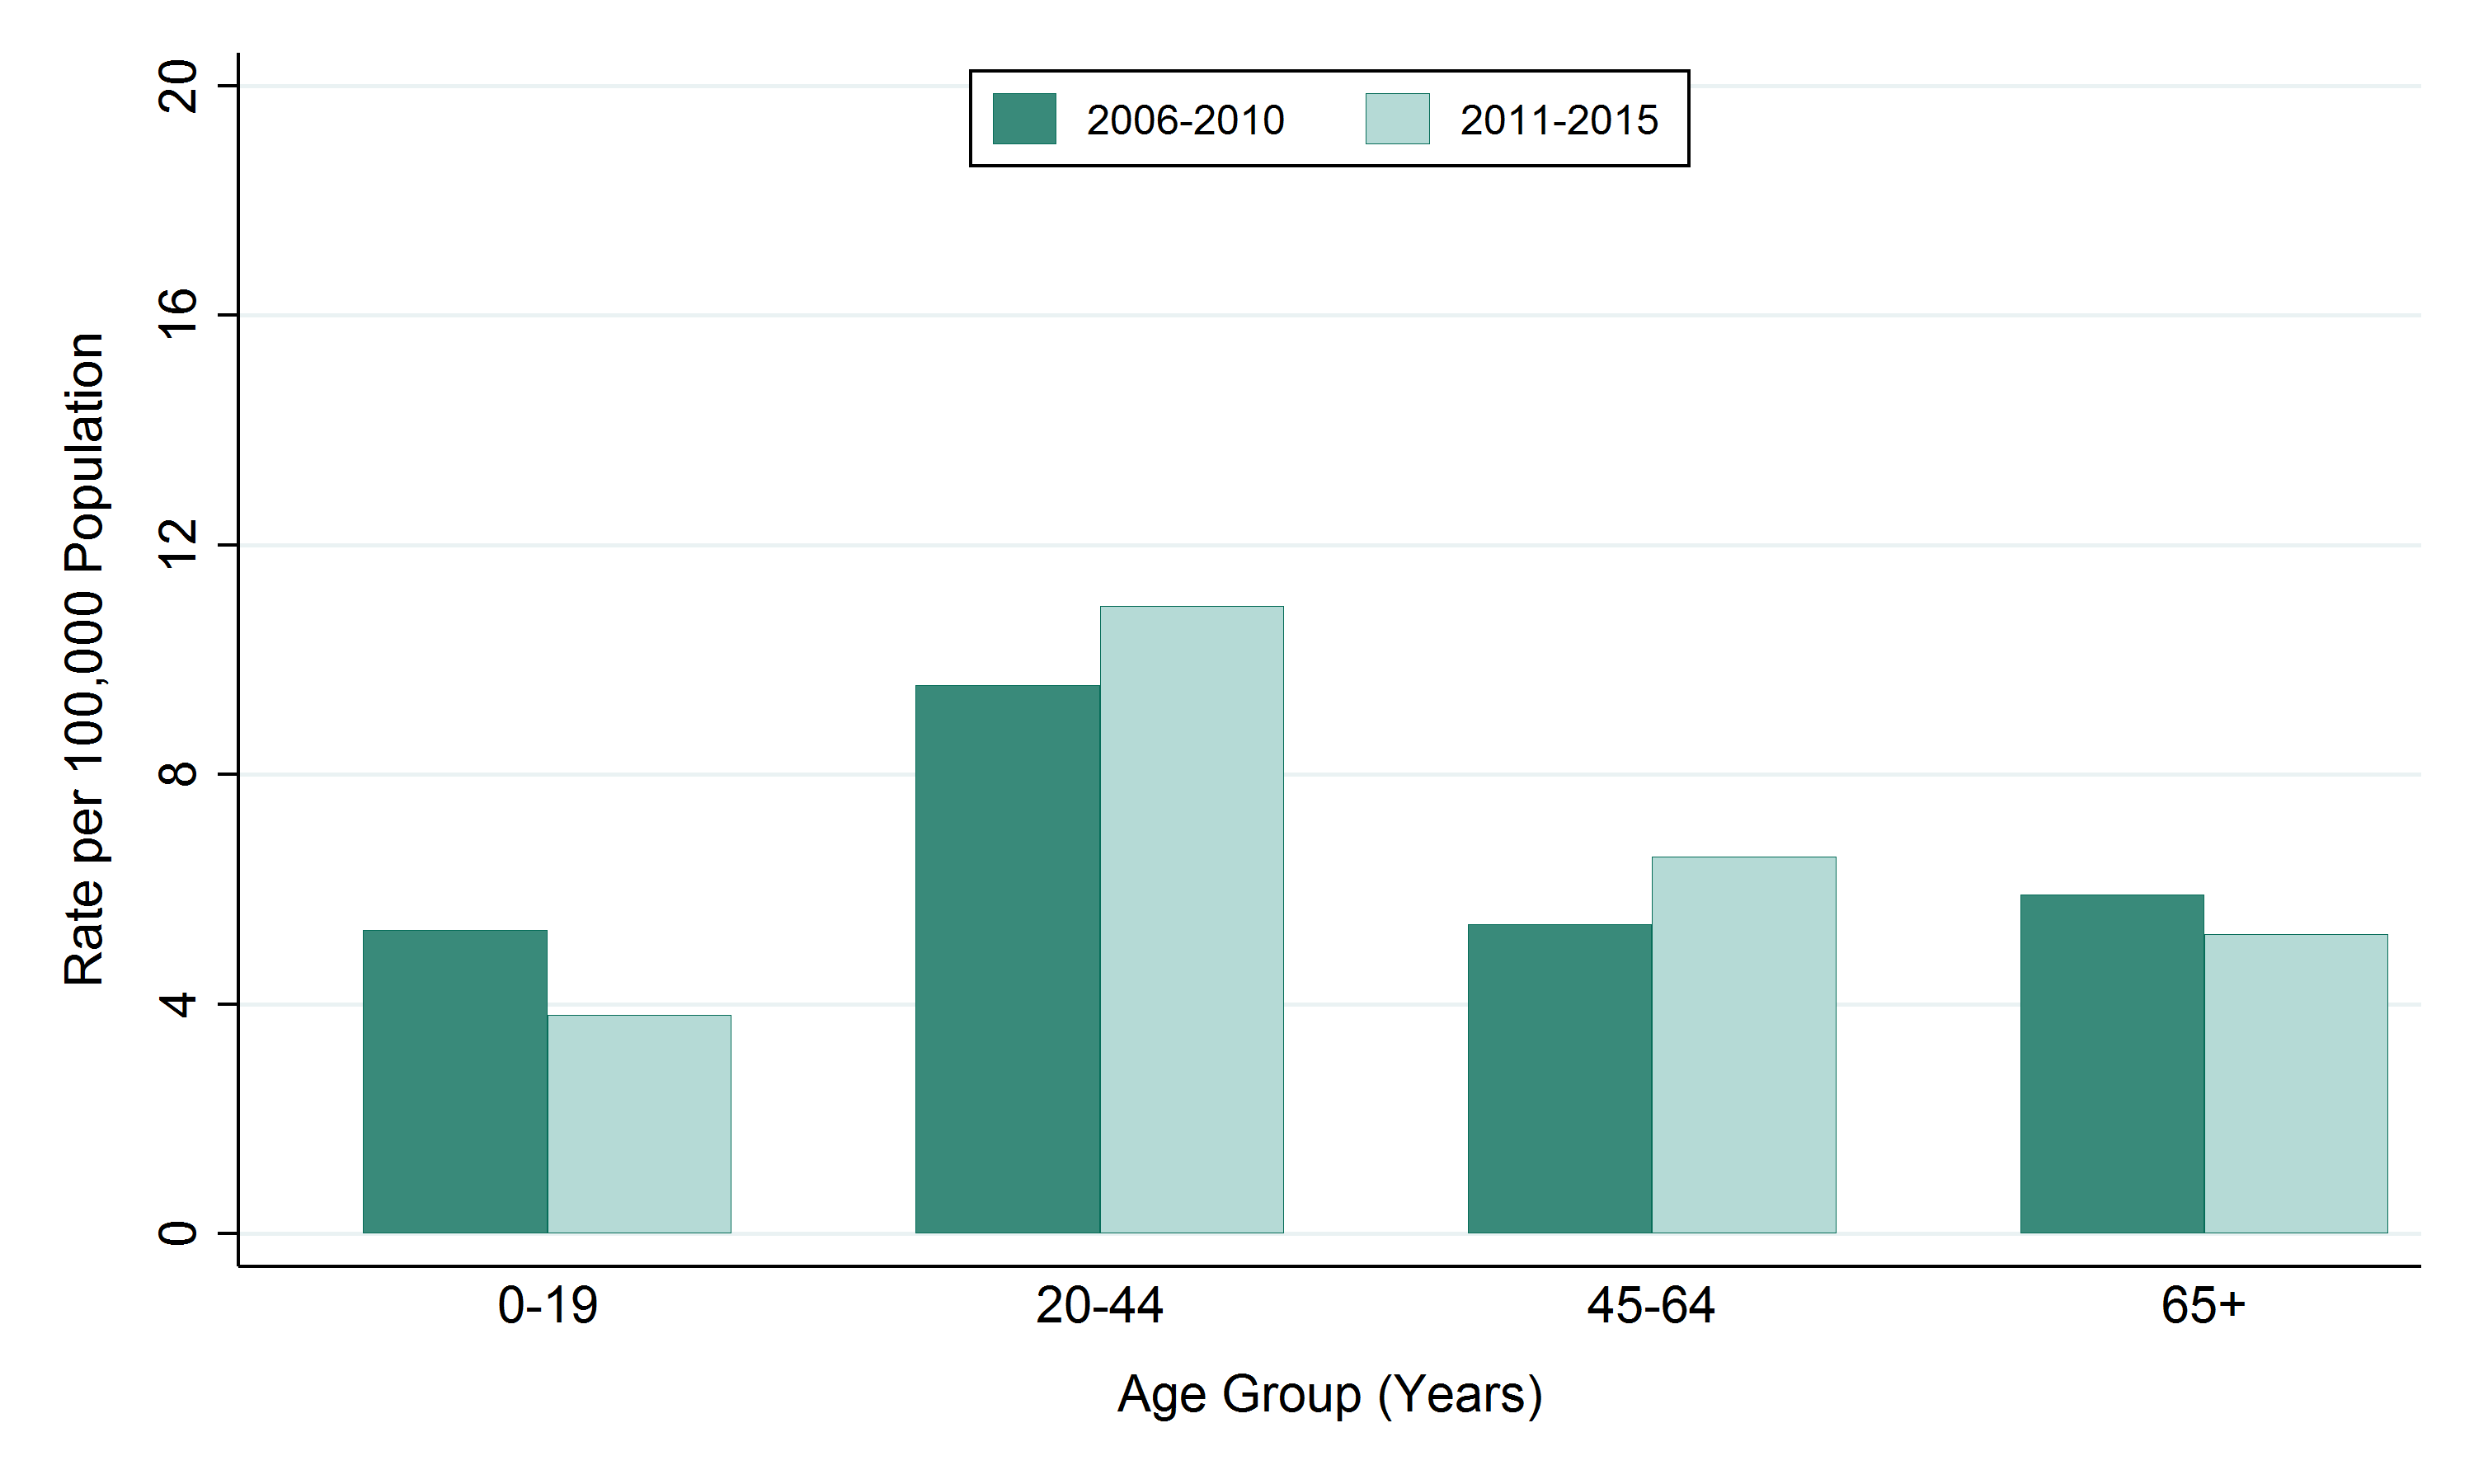
Table: Rate of giardiasis, by age group, Sudbury & District Health Unit (SDHU), 2006–2010 and 2011–2015
| Age Group | Rate per 100,000 2006-2010 | Rate per 100,000 2011-2015 |
|---|---|---|
| 0-19 | 5.3 | 3.8 |
| 20-44 | 9.6 | 10.9 |
| 45-64 | 5.4 | 6.6 |
| 65+ | 5.9 | 5.2 |
Table: Annual number of giardiasis cases, by age group, Sudbury & District Health Unit (SDHU), 2006–2010 and 2011–2015
| Age Group | Total Counts 2006-2010 | Total Counts 2011-2015 | Average Annual Counts 2006-2010 | Average Annual Counts 2011-2015 |
|---|---|---|---|---|
| 0-19 | 12 | 8 | 2.4 | 1.6 |
| 20-44 | 31 | 34 | 6.2 | 6.8 |
| 45-64 | 16 | 20 | 3.2 | 4.0 |
| 65+ | 9 | 9 | 1.8 | 1.8 |
This item was last modified on March 26, 2018