Salmonellosis
Salmonellosis is an infection of the intestines caused by bacteria. There are many different kinds of salmonella bacteria, but all cause food-borne illness. Salmonellosis is more common in the summer months than in the winter. While anyone can become infected with salmonella bacteria, young children, older adults, and people with weakened immune systems are more likely to have serious complications from the infection.
Infection with salmonella bacteria can occur after eating food that has been contaminated with the bacteria. Salmonella bacteria may also be found in the feces of household pets. Reptiles, baby chicks and ducklings, and small rodents such as hamsters can also carry the bacteria.
Symptoms of infection usually occur between 12 – 36 hours after exposure and include diarrhea, fever, and abdominal cramps. Salmonellosis infections are confirmed through stool samples. Only positive cases are reported. Outbreaks of infection affecting large numbers of people can occur, particularly through a contaminated food source.
Salmonellosis cases by geographic area
Key findings:
- In the SDHU area, there were 33 confirmed cases of salmonellosis in 2015.
- In 2015, the rate of salmonellosis in the SDHU area was 17 per 100,000 population.
- The rate of salmonellosis in the SDHU area has been similar to the rate in northeastern Ontario, while the rate in both the SDHU area and northeastern Ontario have been lower than that of Ontario for most years.
- Between 2006 and 2015, there was no clear trend in the rate of salmonellosis in the SDHU area over time.
Notes:
- Rates are age-standardized using 2011 Canadian population.
- Data Source: Infectious Diseases Query, Public Health Ontario, Extracted Feb. 2016, and Population Estimates and Projections, Ontario Ministry of Health and Long-Term Care: IntelliHEALTH ONTARIO, Extracted Sep. 2015.
Figure: Annual age-standardized rate, salmonellosis, by geographic area, 2006–2015
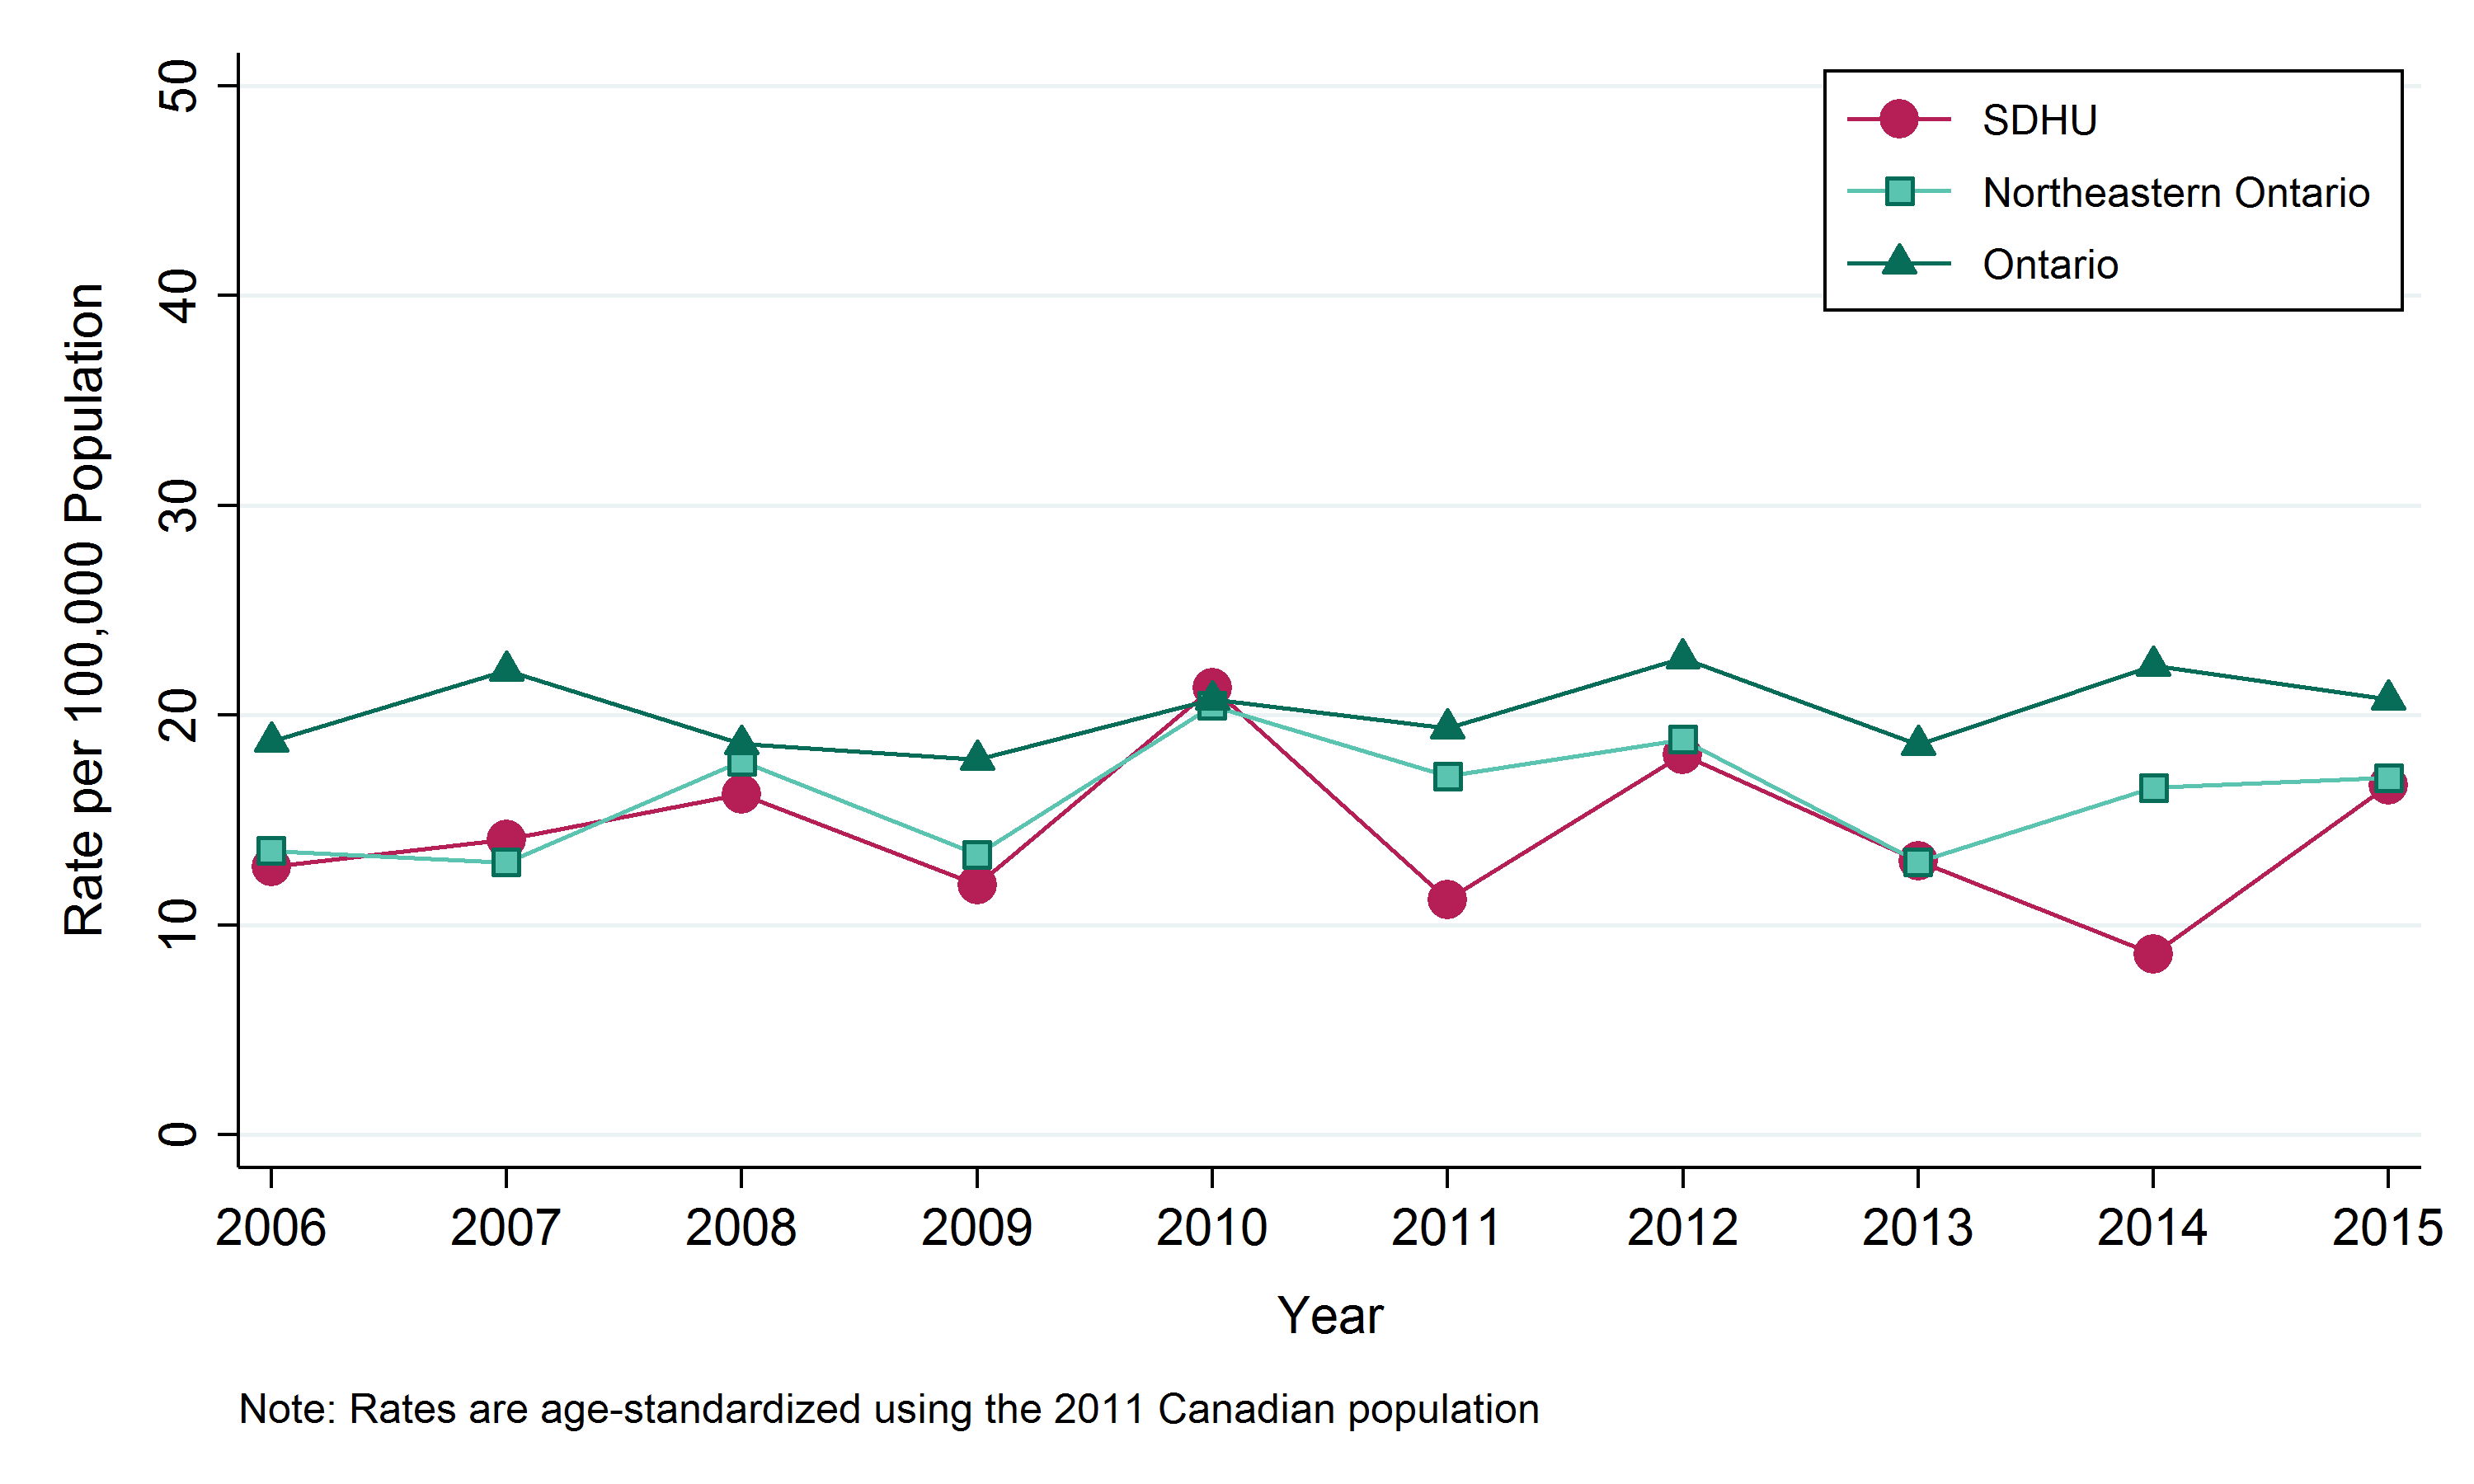
Table: Annual age-standardized rate, salmonellosis, by geographic area, 2006–2015
| Geographic Region | 2006 | 2007 | 2008 | 2009 | 2010 | 2011 | 2012 | 2013 | 2014 | 2015 |
|---|---|---|---|---|---|---|---|---|---|---|
| SDHU | 12.8 | 14.1 | 16.2 | 11.9 | 21.3 | 11.2 | 18.1 | 13.1 | 8.6 | 16.7 |
| Northeast | 13.5 | 13.0 | 17.8 | 13.4 | 20.5 | 17.1 | 18.8 | 13.0 | 16.6 | 17.0 |
| Ontario | 18.7 | 22.1 | 18.6 | 17.9 | 20.7 | 19.4 | 22.7 | 18.6 | 22.4 | 20.8 |
Table: Annual number of cases of salmonellosis, by geographic area, 2006–2015
| Geographic Region | 2006 | 2007 | 2008 | 2009 | 2010 | 2011 | 2012 | 2013 | 2014 | 2015 |
|---|---|---|---|---|---|---|---|---|---|---|
| SDHU | 24 | 28 | 32 | 24 | 43 | 23 | 36 | 26 | 18 | 33 |
| Northeast | 77 | 74 | 99 | 74 | 117 | 99 | 105 | 76 | 95 | 98 |
| Ontario | 2369 | 2835 | 2407 | 2319 | 2725 | 2567 | 3035 | 2505 | 3042 | 2850 |
Salmonellosis cases by sex
Key findings:
- Between 2011 and 2015, there were a total of 67 males and 69 females diagnosed with salmonellosis in the SDHU area, an average of 13 males and 14 females per year.
- In the SDHU area, the annual rate of salmonellosis between 2011 and 2015 was 14 per 100,000 males and 14 per 100,000 females.
- The rate of salmonellosis among males has been similar to the rate among females.
- Between the time periods 2006–2010 and 2011–2015, the rates of salmonellosis has remained stable for both males and females in the SDHU area.
Notes:
- Rates are age-standardized using 2011 Canadian population.
- Data Source: Infectious Diseases Query, Public Health Ontario, Extracted Feb. 2016, and Population Estimates and Projections, Ontario Ministry of Health and Long-Term Care: IntelliHEALTH ONTARIO, Extracted Sep. 2015.
Figure: Age-standardized rate, salmonellosis, by sex, Sudbury & District Health Unit (SDHU), 2006–2010 and 2011–2015
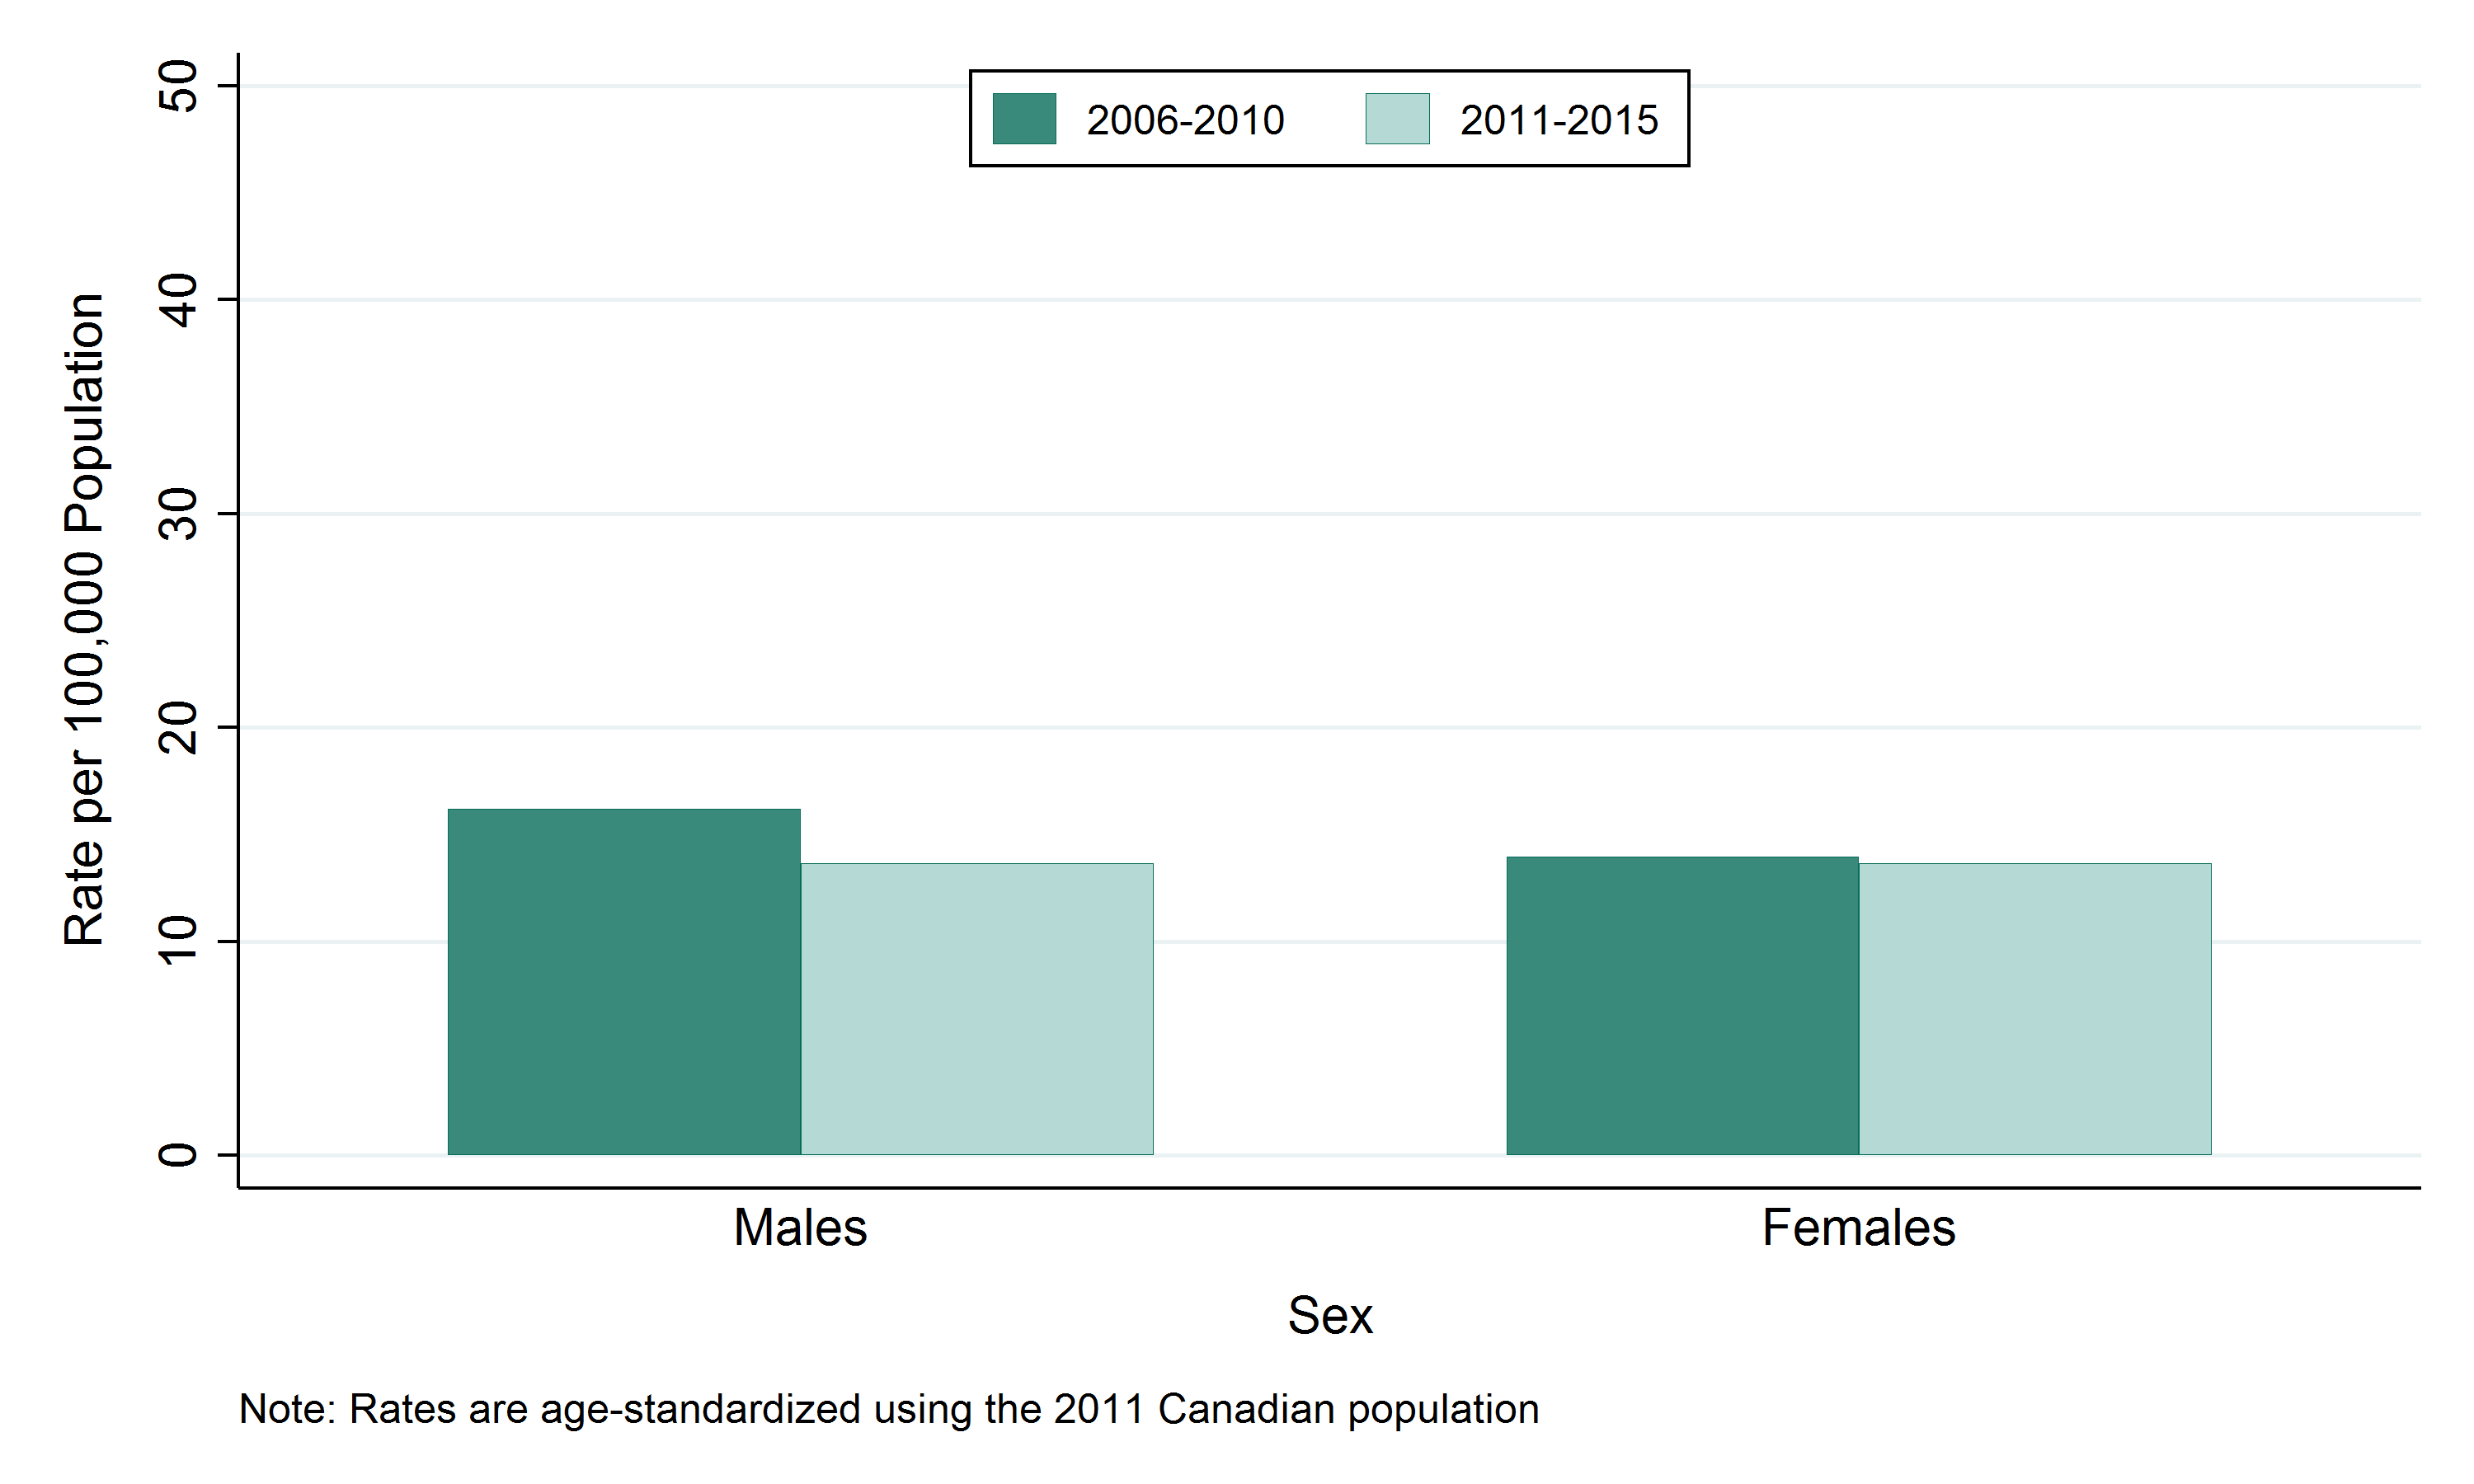
Table: Age-standardized rate, salmonellosis, by sex, Sudbury & District Health Unit (SDHU), 2006–2010 and 2011–2015
| Sex | Rate per 100,000 2006-2010 | Rate per 100,000 2011-2015 |
|---|---|---|
| Males | 16.2 | 13.7 |
| Females | 14 | 13.6 |
Table: Annual number of cases of salmonellosis, by sex, Sudbury & District Health Unit (SDHU), 2006–2010 and 2011–2015
| Sex | Total Counts 2006-2010 | Total Counts 2011-2015 | Average Annual Counts 2006-2010 | Average Annual Counts 2011-2015 |
|---|---|---|---|---|
| Males | 79 | 67 | 15.8 | 13.4 |
| Females | 72 | 69 | 14.4 | 13.8 |
Salmonellosis cases by age group
Key findings:
- Between 2011 and 2015, the highest number of salmonellosis cases was in the 45 to 64 age group, with a total of 46 cases or an average of 9 per year in the SDHU area.
- In the SDHU area, the highest annual rate of salmonellosis was in the 45 to 64, and 65-and-over age groups, with 15 cases per 100,000 population between 2011 and 2015.
- The rate of salmonellosis was lowest in the 20 to 44 age group.
- Between the time periods 2006–2010 and 2011–2015, the rate of salmonellosis has decreased in the 20 to 44, and 65-and-over age groups.
Notes:
- Data Source: Infectious Diseases Query, Public Health Ontario, Extracted Feb. 2016, and Population Estimates and Projections, Ontario Ministry of Health and Long-Term Care: IntelliHEALTH ONTARIO, Extracted Sep. 2015.
Figure: Salmonellosis, by age group, Sudbury & District Health Unit (SDHU), 2006–2010 and 2011–2015
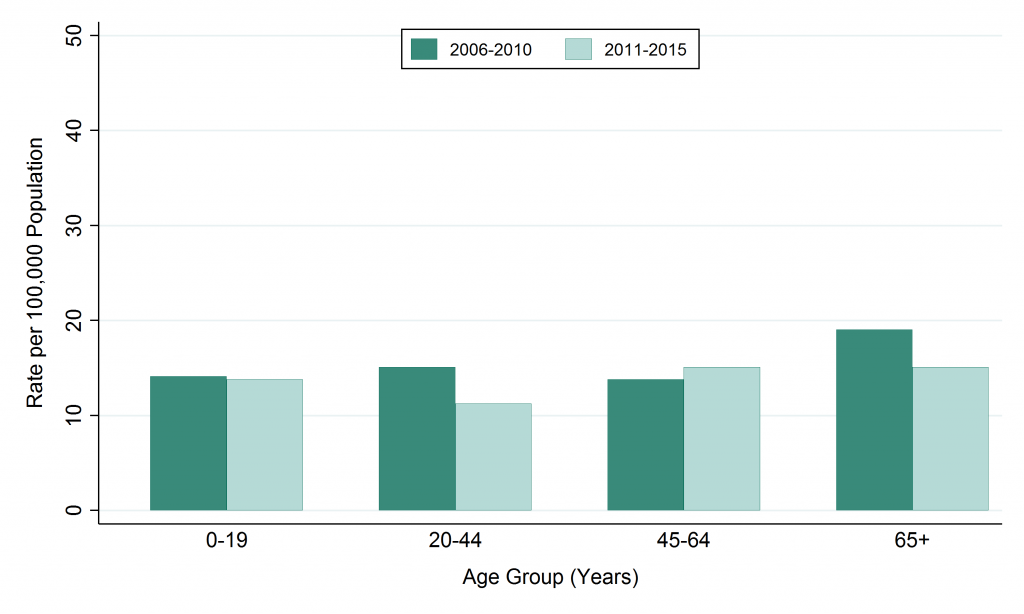
Table: Rate of salmonellosis, by age group, Sudbury & District Health Unit (SDHU), 2006–2010 and 2011–2015
| Age Group | Rate per 100,000 2006-2010 | Rate per 100,000 2011-2015 |
|---|---|---|
| 0-19 | 14.1 | 13.8 |
| 20-44 | 15.1 | 11.3 |
| 45-64 | 13.8 | 15.1 |
| 65+ | 19 | 15.1 |
Table: Annual number of cases of salmonellosis, by age group, Sudbury & District Health Unit (SDHU), 2006–2010 and 2011–2015
| Age Group | Total Counts 2006-2010 | Total Counts 2011-2015 | Average Annual Counts 2006-2010 | Average Annual Counts 2011-2015 |
|---|---|---|---|---|
| 0-19 | 32 | 29 | 6.4 | 5.8 |
| 20-44 | 49 | 35 | 9.8 | 7.0 |
| 45-64 | 41 | 46 | 8.2 | 9.2 |
| 65+ | 29 | 26 | 5.8 | 5.2 |
This item was last modified on March 26, 2018