ATV/Snowmobile Injuries
Injuries in this section include those resulting from the use of a snowmobile, all-terrain vehicle (ATV) or other motor vehicle designed primarily for off-road use. They include injuries due to collisions and other events related to the vehicle.
Emergency department (ED) visits due to ATV/snowmobile injuries by geographic region
Key Findings:
- Among residents of the Sudbury & District Health Unit (SDHU) area, there were 282 emergency department (ED) visits due to ATV/snowmobile injuries in 2015.
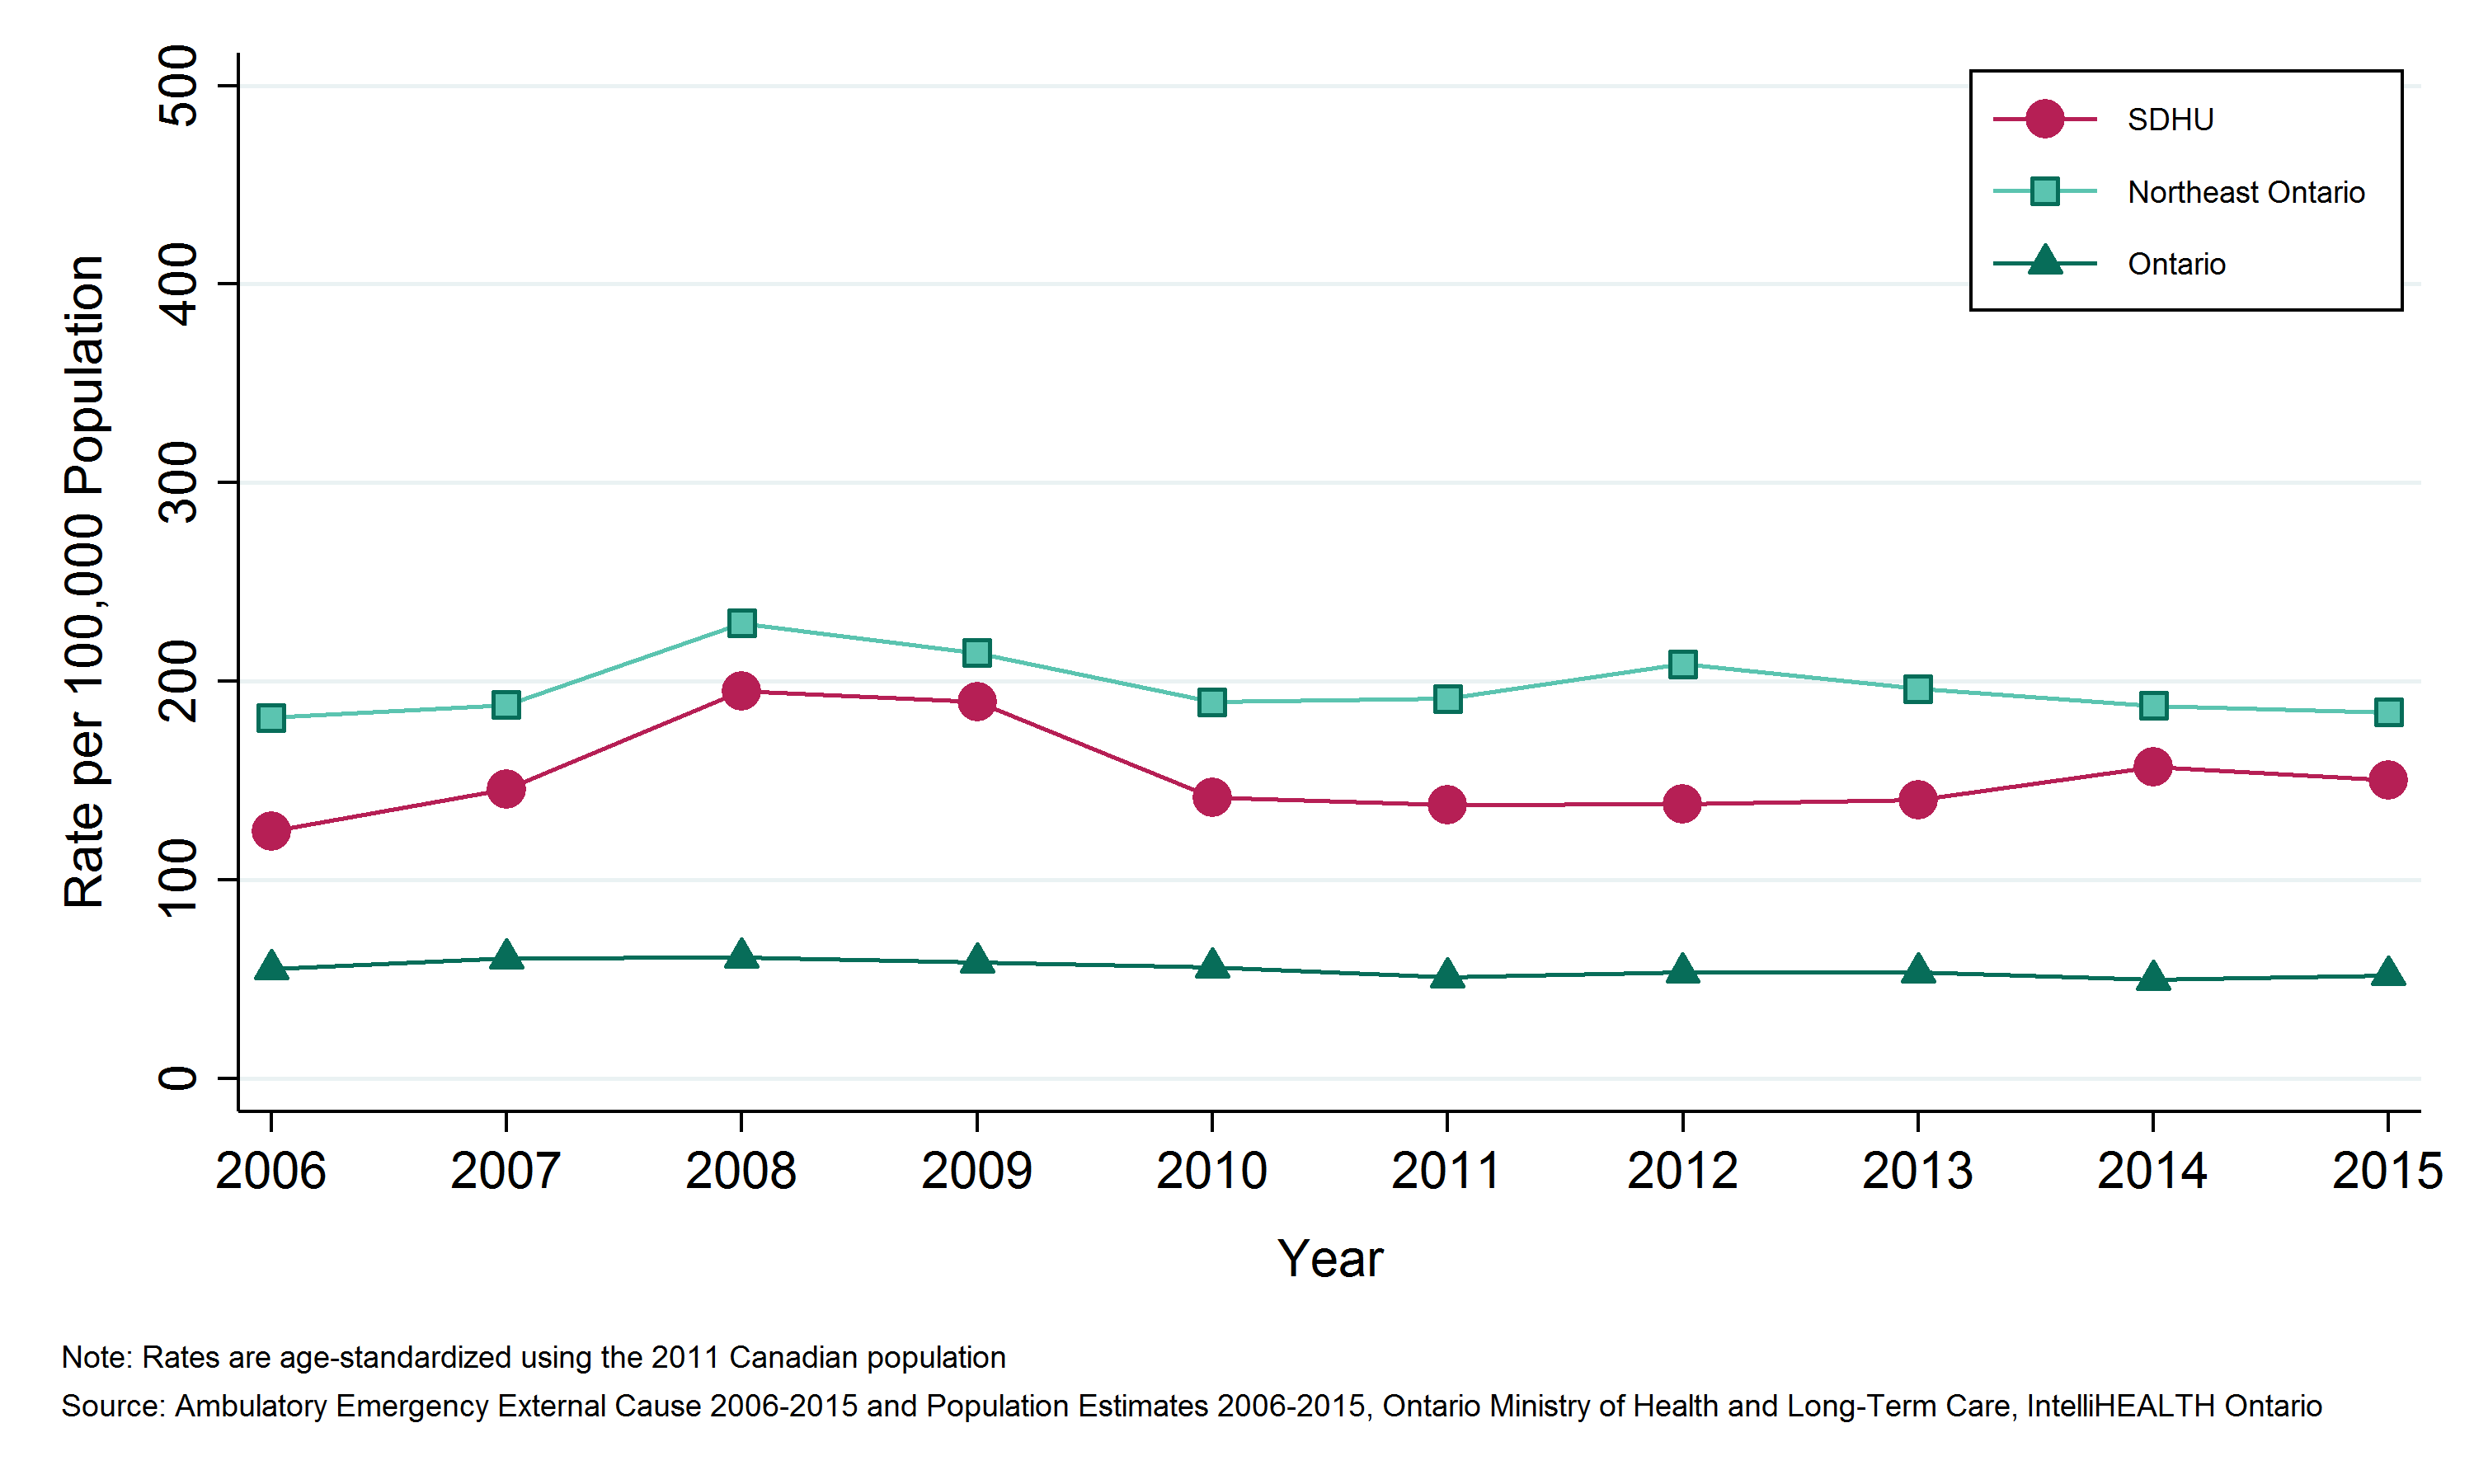
- In 2015, the rate of ED visits due to ATV/snowmobile injuries in the SDHU area was 150 ED visits per 100,000 population per year.
- The rate of ED visits due to ATV/snowmobile injuries in the SDHU area has been consistently lower than the rate in northeastern Ontario, while the rates in both the SDHU area and northeastern Ontario have been consistently higher than that of Ontario overall.
- Between 2006 and 2015, there was no clear trend in the rate of ED visits due to ATV/snowmobile injuries in the SDHU area over time.
Notes:
- Geographic areas and/or time periods in which there is less access to walk-in clinics and other alternatives to the local ED can be expected to have higher rates of injury-related ED visits than they would otherwise.
- Rates are age-standardized using the 2011 Canadian population.
- Data Source: Ambulatory Emergency External Cause 2006 to 2015 (extracted June 6, 2016) and Population Estimates 2006 to 2015 (extracted October 7, 2016), Ontario Ministry of Health and Long-Term Care, IntelliHEALTH Ontario.
Figure: Annual age-standardized rate of emergency department visits, ATV and snowmobile-related injuries, by geographic region, 2006 to 2015
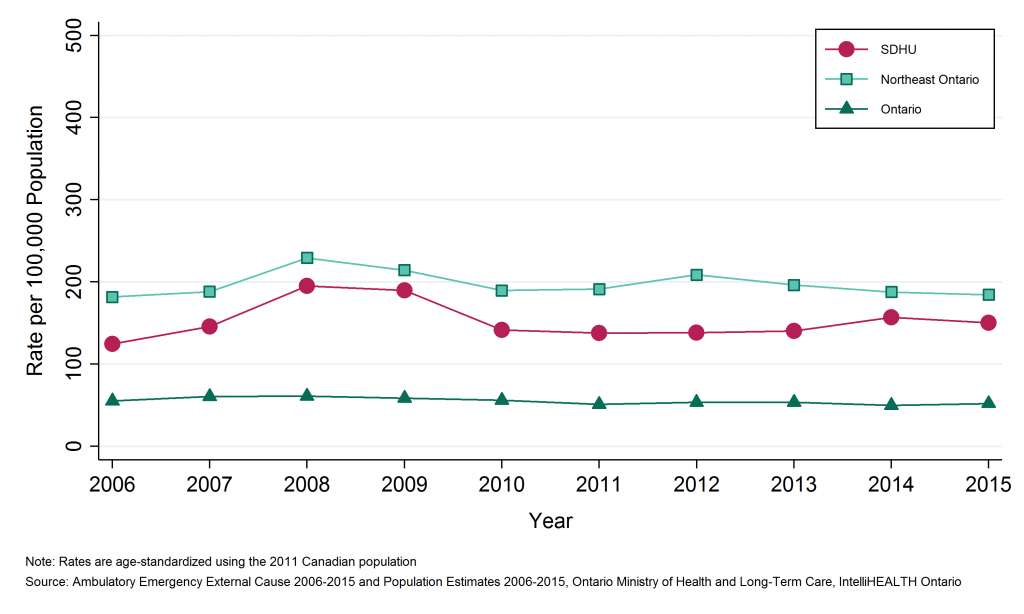
Table: Annual age-standardized rate of emergency department visits, ATV and snowmobile-related injuries, by geographic region, 2006 to 2015
| Geographic Region | 2006 | 2007 | 2008 | 2009 | 2010 | 2011 | 2012 | 2013 | 2014 | 2015 |
| SDHU | 124.7 | 145.9 | 195.3 | 189.9 | 141.5 | 137.9 | 138.3 | 140.4 | 156.9 | 150.4 |
| Northeast | 181.8 | 188.3 | 229.3 | 214.5 | 189.6 | 191.3 | 208.7 | 196.3 | 187.9 | 184.5 |
| Ontario | 55.2 | 60.6 | 61.1 | 58.7 | 56.1 | 51.1 | 53.7 | 53.5 | 49.9 | 52.2 |
Table: Annual number of emergency department visits, ATV and snowmobile-related injuries, by geographic region, 2006 to 2015
| Geographic Region | 2006 | 2007 | 2008 | 2009 | 2010 | 2011 | 2012 | 2013 | 2014 | 2015 |
| SDHU | 253 | 292 | 392 | 380 | 282 | 271 | 271 | 269 | 296 | 282 |
| Northeast | 1,037 | 1,063 | 1,287 | 1,194 | 1,052 | 1,043 | 1,130 | 1,049 | 985 | 956 |
| Ontario | 7,387 | 8,125 | 8,213 | 7,906 | 7,581 | 6,927 | 7,312 | 7,306 | 6,834 | 7,145 |
Emergency department (ED) visits due to ATV/snowmobile injuries by Greater Sudbury and outlying areas
Key Findings:
- In 2015, there were 1,066 emergency department (ED) visits due to ATV/snowmobile injuries among residents of Greater Sudbury and 323 ED visits among residents of the SDHU district office areas, an average of 213 and 65 per year, respectively.
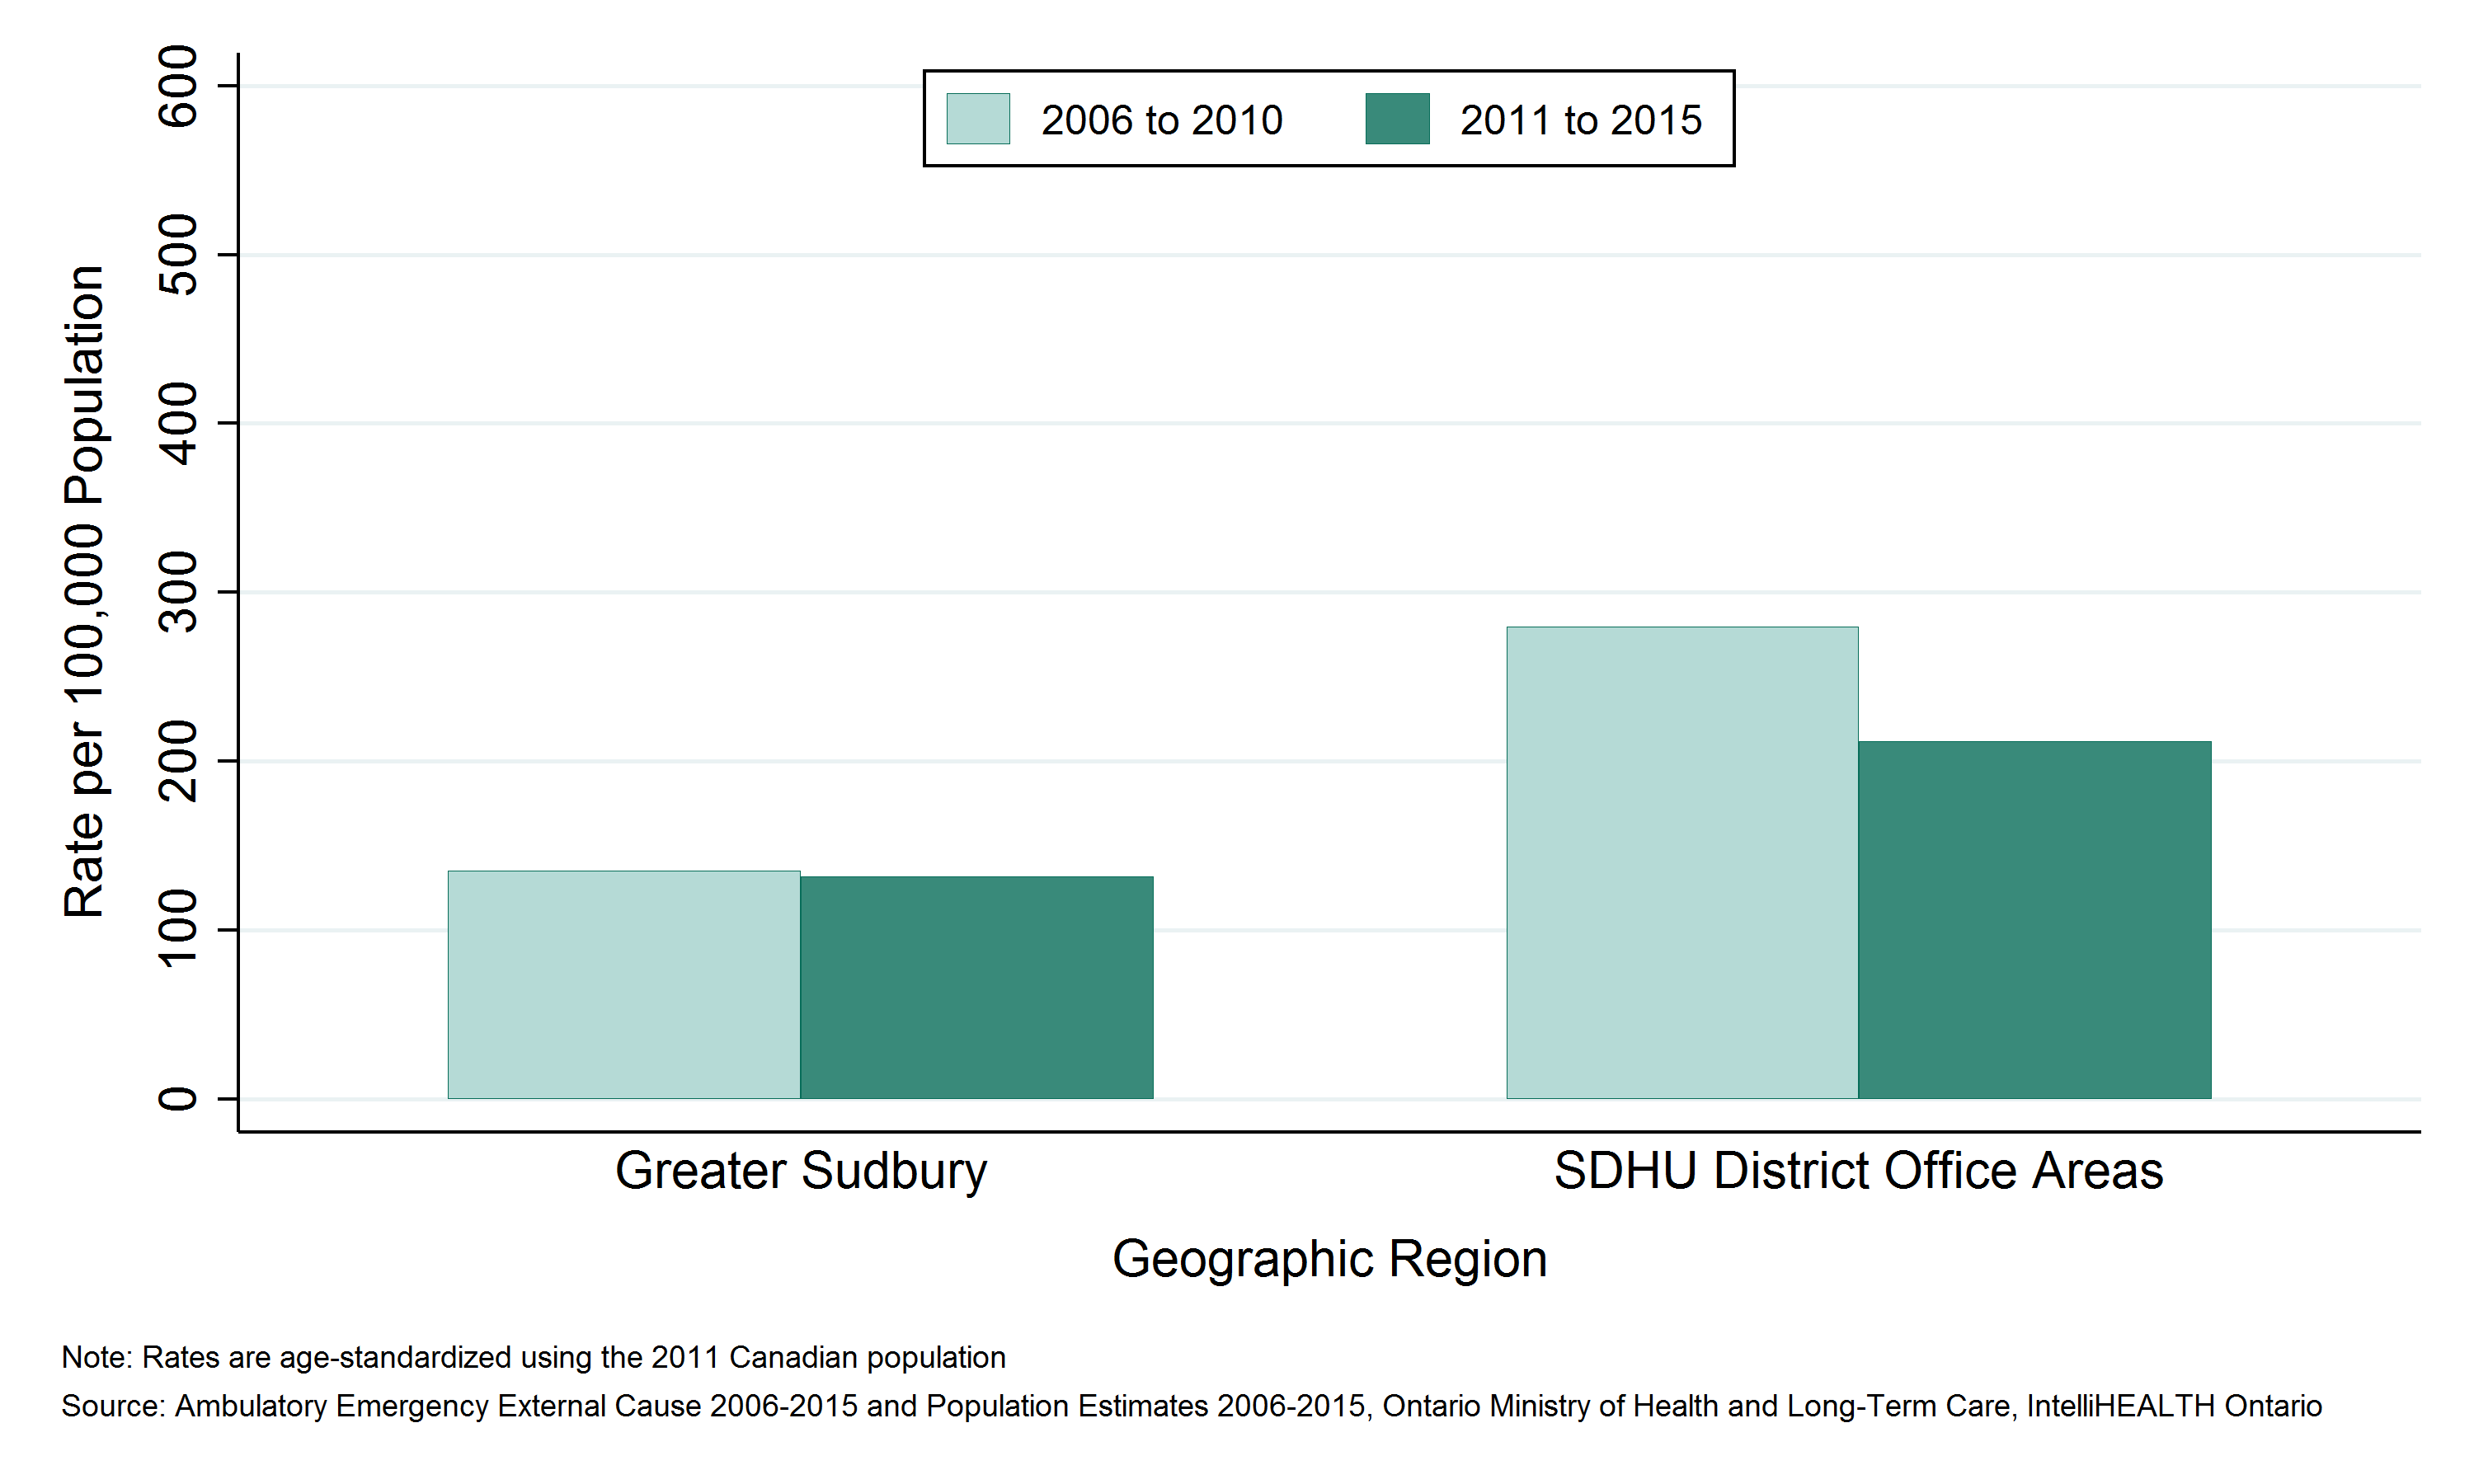
- The rate of ED visits due to ATV/snowmobile injuries was 132 per 100,000 population per year in Greater Sudbury and 211 per 100,000 population per year in the SDHU district office areas between 2011 and 2015.
- The rate of ED visits due to ATV/snowmobile injuries among residents of Greater Sudbury has been consistently lower than among residents in the SDHU district office areas.
- The rate of ED visits due to ATV/snowmobile injuries among Greater Sudbury remained stable while the rate among SDHU district office areas decreased between 2006 to 2010 and 2011 to 2015.
Notes:
- Geographic areas and/or time periods in which there is less access to walk-in clinics and other alternatives to the local ED can be expected to have higher rates of injury-related ED visits than they would otherwise.
- Rates are age-standardized using the 2011 Canadian population.
- Data Source: Ambulatory Emergency External Cause 2006 to 2015 (extracted June 6, 2016) and Population Estimates 2006 to 2015 (extracted October 7, 2016), Ontario Ministry of Health and Long-Term Care, IntelliHEALTH Ontario.
Figure: Annual age-standardized rate of emergency department visits, ATV and snowmobile-related injuries, by Greater Sudbury and outlying areas, 2006 to 2010 and 2011 to 2015

Table: Annual age-standardized rate of emergency department visits, ATV and snowmobile-related injuries, by Greater Sudbury and outlying areas, 2006 to 2010 and 2011 to 2015
| Geographic Region | Rate per 100000 2006 to 2010 | Rate per 100000 2011 to 2015 |
| Greater Sudbury | 135.1 | 132.1 |
| SDHU District Office Areas | 279.6 | 211.7 |
Table: Annual number of emergency department visits, ATV and snowmobile-related injuries, by Greater Sudbury and outlying areas, 2006 to 2010 and 2011 to 2015
| Geographic Region | Total Counts, 2006 to 2010 | Total Counts, 2011 to 2015 | Average Annual Counts, 2006 to 2010 | Average Annual Counts, 2011 to 2015 |
| Greater Sudbury | 1,133 | 1,066 | 226.6 | 213.2 |
| SDHU District Office Areas | 466 | 323 | 93.2 | 64.6 |
Emergency department (ED) visits due to ATV/snowmobile injuries by sex
Key Findings:
- Between 2011 and 2015, there were 1,046 emergency department (ED) visits due to ATV/snowmobile injuries among males, and 343 among females in the Sudbury & District Health Unit (SDHU) area, an average of 209 and 69 per year, respectively.
- The rate of ED visits due to ATV/snowmobile injuries was 215 per 100,000 males per year and 73 per 100,000 females per year in the SDHU area between 2011 and 2015.
- The ED visits rate due to ATV/snowmobile injuries among males has been consistently higher than the rate among females.
- In the SDHU area, the rate of ED visits due to ATV/snowmobile injuries decreased among males and remained stable among females over time between 2006 to 2010 and 2011 to 2015.
Notes:
- Geographic areas and/or time periods in which there is less access to walk-in clinics and other alternatives to the local ED can be expected to have higher rates of injury-related ED visits than they would otherwise.
- Rates are age-standardized using the 2011 Canadian population.
- Data Source: Ambulatory Emergency External Cause 2006 to 2015 (extracted June 6, 2016) and Population Estimates 2006 to 2015 (extracted October 7, 2016), Ontario Ministry of Health and Long-Term Care, IntelliHEALTH Ontario.
Figure: Annual age-standardized rate of emergency department visits, ATV and snowmobile-related injuries, by sex, SDHU, 2006 to 2010 and 2011 to 2015
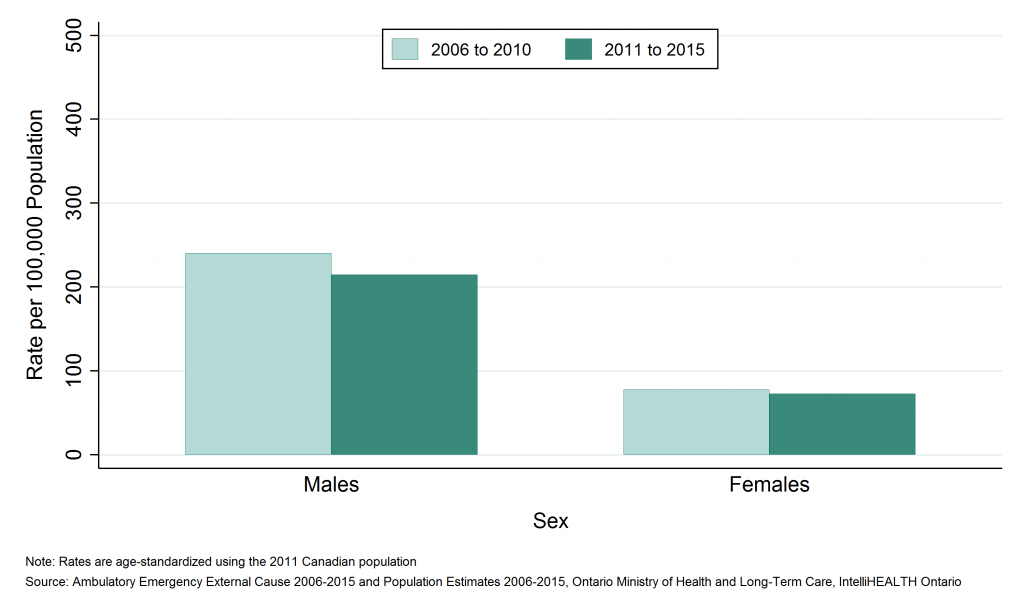
Table: Annual age-standardized rate of emergency department visits, ATV and snowmobile-related injuries, by sex, SDHU, 2006 to 2010 and 2011 to 2015
| Sex | Rate per 100,000, 2006 to 2010 | Rate per 100,000, 2011 to 2015 |
| Males | 240.5 | 214.9 |
| Females | 77.6 | 72.8 |
Table: Annual number of emergency department visits, ATV and snowmobile-related injuries, by sex, SDHU, 2006 to 2010 and 2011 to 2015
| Sex | Total Counts, 2006 to 2010 | Total Counts, 2011 to 2015 | Average Annual Counts, 2006 to 2010 | Average Annual Counts, 2011 to 2015 |
| Males | 1,211 | 1,046 | 242.2 | 209.2 |
| Females | 388 | 343 | 77.6 | 68.6 |
Emergency department (ED) visits due to ATV/snowmobile injuries by age group
Key Findings:
- Among residents of the Sudbury & District Health Unit (SDHU) area, the 25 to 44 age group visited the emergency department (ED) due to ATV/snowmobile injuries the most, with 514 ED visits between 2011 and 2015, or 103 ED visits per year on average.
- Between 2011 and 2015, the 15 to 24 age group had the highest ED visits rate due to ATV/snowmobile injuries with 309 ED visits per 100,000 population per year.
- Rates of ED visits due to ATV/snowmobile injuries increase through childhood and young adulthood, peaking in the 15 to 24 year age group, and then decrease with age.
- Between 2006−2010 and 2011−2015, the ED visits rate due to ATV/snowmobile injuries decreased over time in SDHU-area children, youth and young adults (ages 0 to 24), and also in individuals aged 75 to 84. Rates have remained stable for all other age groups.
Notes:
- Data Source: Ambulatory Emergency External Cause 2006 to 2015 (extracted June 6, 2016) and Population Estimates 2006 to 2015 (extracted October 7, 2016), Ontario Ministry of Health and Long-Term Care, IntelliHEALTH Ontario.
Figure: Annual rate of emergency department visits, ATV and snowmobile-related injuries, by age group, SDHU, 2006 to 2010 and 2011 to 2015
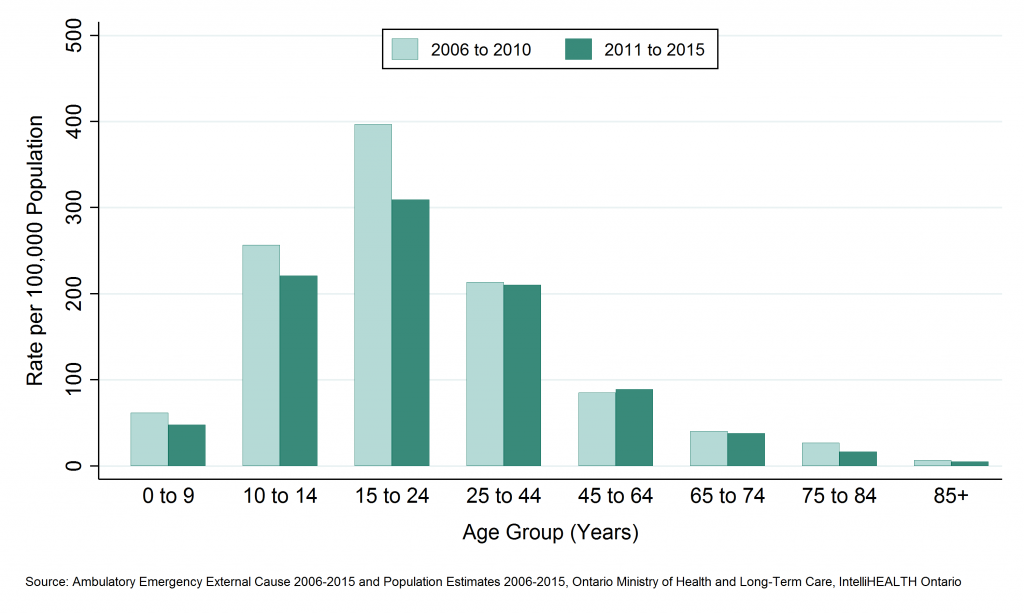
Table: Annual rate of emergency department visits, ATV and snowmobile-related injuries, by age group, SDHU, 2006 to 2010 and 2011 to 2015
| Age Group | Rate per 100000, 2006 to 2010 | Rate per 100000, 2011 to 2015 |
| 0 to 9 | 61.9 | 48.0 |
| 10 to 14 | 256.6 | 220.9 |
| 15 to 24 | 397.0 | 309.1 |
| 25 to 44 | 213.4 | 210.3 |
| 45 to 64 | 85.1 | 88.9 |
| 65 to 74 | 40.2 | 37.8 |
| 75 to 84 | 26.8 | 16.5 |
| 85+ | 6.5 | 5.1 |
Table: Annual number of emergency department visits, ATV and snowmobile-related injuries, by age group, SDHU, 2006 to 2010 and 2011 to 2015
| Age Group | Total Counts, 2006 to 2010 | Total Counts, 2011 to 2015 | Average Annual Counts, 2006 to 2010 | Average Annual Counts, 2011 to 2015 |
| 0 to 9 | 61 | 46 | 12.2 | 9.2 |
| 10 to 14 | 155 | 114 | 31.0 | 22.8 |
| 15 to 24 | 528 | 398 | 105.6 | 79.6 |
| 25 to 44 | 553 | 514 | 110.6 | 102.8 |
| 45 to 64 | 253 | 270 | 50.6 | 54.0 |
| 65 to 74 | 34 | 37 | 6.8 | 7.4 |
| 75 to 84 | 14 | 9 | 2.8 | 1.8 |
| 85+ | 1 | 1 | 0.2 | 0.2 |
Deaths due to ATV/snowmobile injuries by geographic region
Key Findings:
- Among residents of the Sudbury & District Health Unit (SDHU) area, there were 12 deaths due to ATV/snowmobile injuries between 2007 and 2011, an average of 2 per year.
- Between 2006 and 2015, the mortality rate due to ATV/snowmobile injuries in the SDHU area was 1 death per 100,000 population per year.
- The mortality rate due to ATV/snowmobile injuries in the SDHU area is similar to that in northeastern Ontario, but higher than the rate in Ontario overall.
- Between 2002 to 2006 and 2007 to 2011, the mortality rate due to ATV/snowmobile injuries in the SDHU area remained stable.
Notes:
- Rates are age-standardized using the 2011 Canadian population.
- Data Source: Ontario Mortality Data 2002 to 2011 (extracted June 6, 2016) and Population Estimates 2006 to 2015 (extracted October 7, 2016), Ontario Ministry of Health and Long-Term Care, IntelliHEALTH Ontario.
Figure: Annual age-standardized mortality rate, ATV and snowmobile-related injuries, by geographic region, 2002 to 2006 and 2007 to 2011

Table: Annual age-standardized mortality rate, ATV and snowmobile-related injuries, by geographic region, 2002 to 2006 and 2007 to 2011
| Geographic Region | Rate per 100,000 2002 to 2006 | Rate per 100,000 2007 to 2011 |
| SDHU | 1.5 | 1.2 |
| Northeast | 1.4 | 1.6 |
| Ontario | 0.3 | 0.3 |
Table: Annual number of deaths, ATV and snowmobile-related injuries, by geographic region, 2002 to 2006 and 2007 to 2011
| Geographic Region | Total Counts 2002 to 2006 | Total Counts 2007 to 2011 | Average Annual Counts, 2002 to 2006 | Average Annual Counts, 2007 to 2011 |
| SDHU | 14 | 12 | 2.8 | 2.4 |
| Northeast | 37 | 47 | 7.4 | 9.4 |
| Ontario | 195 | 226 | 39.0 | 45.2 |
Potential years of life lost (PYLL) due to ATV/snowmobile injuries by geographic region
Key Findings:
- Between 2006 and 2015, Sudbury & District Health Unit (SDHU) area residents lost 384 years of potential life due to deaths from ATV/snowmobile injuries before the age of 75, an average of 77 per year.
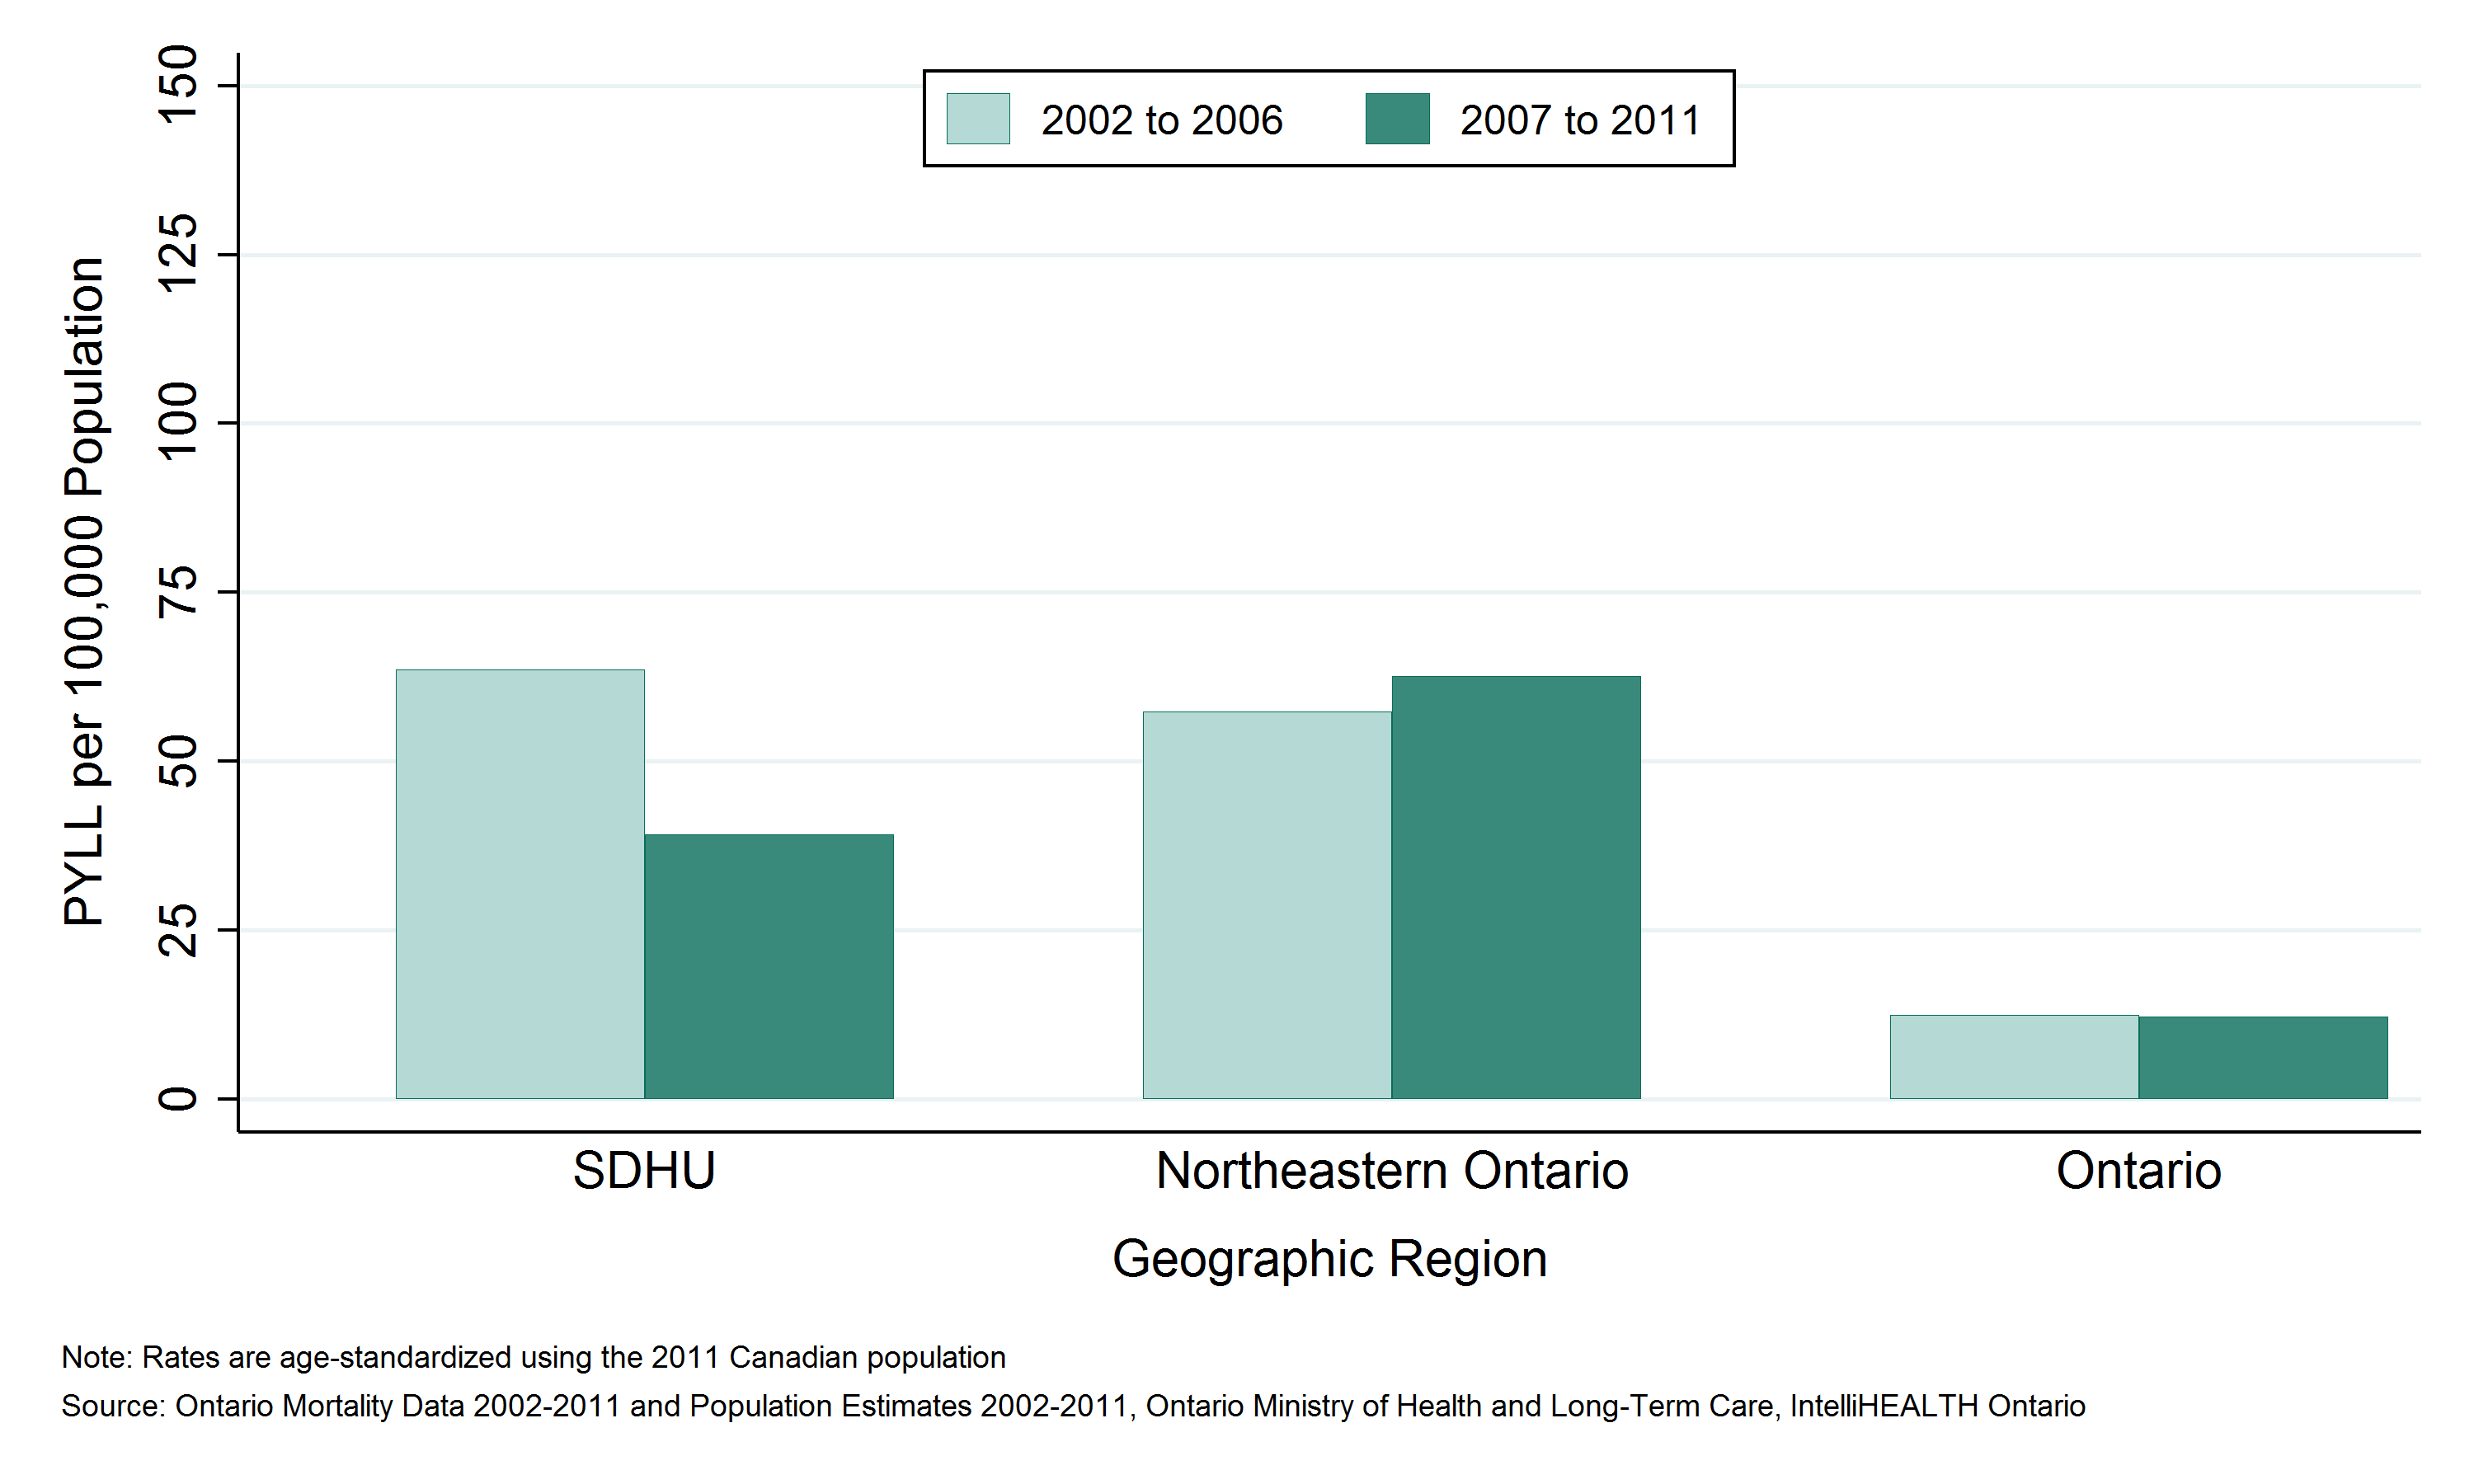
- The rate of potential years of life lost (PYLL) in the SDHU area due to ATV/snowmobile injuries was 39 PYLL per 100,000 population per year.
- The rate of PYLL due to ATV/snowmobile injuries in the SDHU area was lower than that in northeastern Ontario between 2007 and 2011, while rates in both areas were higher than the rate in Ontario overall.
- Between 2002 to 2006 and 2007 to 2011, the rate of PYLL due to ATV/snowmobile injuries in the SDHU area decreased.
Notes:
- Rates are age-standardized using the 2011 Canadian population.
- Data Source: Ontario Mortality Data 2002 to 2011 (extracted June 6, 2016) and Population Estimates 2006 to 2015 (extracted October 7, 2016), Ontario Ministry of Health and Long-Term Care, IntelliHEALTH Ontario.
Figure: Annual age-standardized rate of potential years of life lost, ATV and snowmobile-related injuries, by geographic region, 2002 to 2006 and 2007 to 2011

Table: Annual age-standardized rate of potential years of life lost, ATV and snowmobile-related injuries, by geographic region, 2002 to 2006 and 2007 to 2011
| Geographic Region | Rate per 100,000, 2002 to 2006 | Rate per 100,000, 2007 to 2011 |
| SDHU | 63.6 | 39.2 |
| Northeast | 57.4 | 62.6 |
| Ontario | 12.5 | 12.3 |
Table: Annual number of potential years of life lost, ATV and snowmobile-related injuries, by geographic region, 2002 to 2006 and 2007 to 2011
| Geographic Region | Total PYLL, 2002 to 2006 | Total PYLL, 2007 to 2011 | Average Annual Counts, 2002 to 2006 | Average Annual Counts, 2007 to 2011 |
| SDHU | 575 | 384 | 115.0 | 76.8 |
| Northeast | 1,493 | 1,674 | 298.6 | 334.8 |
| Ontario | 8,003 | 7,955 | 1,600.6 | 1,591.0 |
This item was last modified on July 25, 2017