Motor vehicle collisions
Injuries in this section include those related to land transport motor vehicles in motion. The injuries include those to any person injured in a collision of a motor vehicle with other motor vehicles, non-motor vehicles, cyclists, pedestrians, animal riders, occupants of an animal-drawn vehicle, or a fixed or stationary object.
Emergency department (ED) visits due to motor vehicle collisions by geographic region
Key Findings:
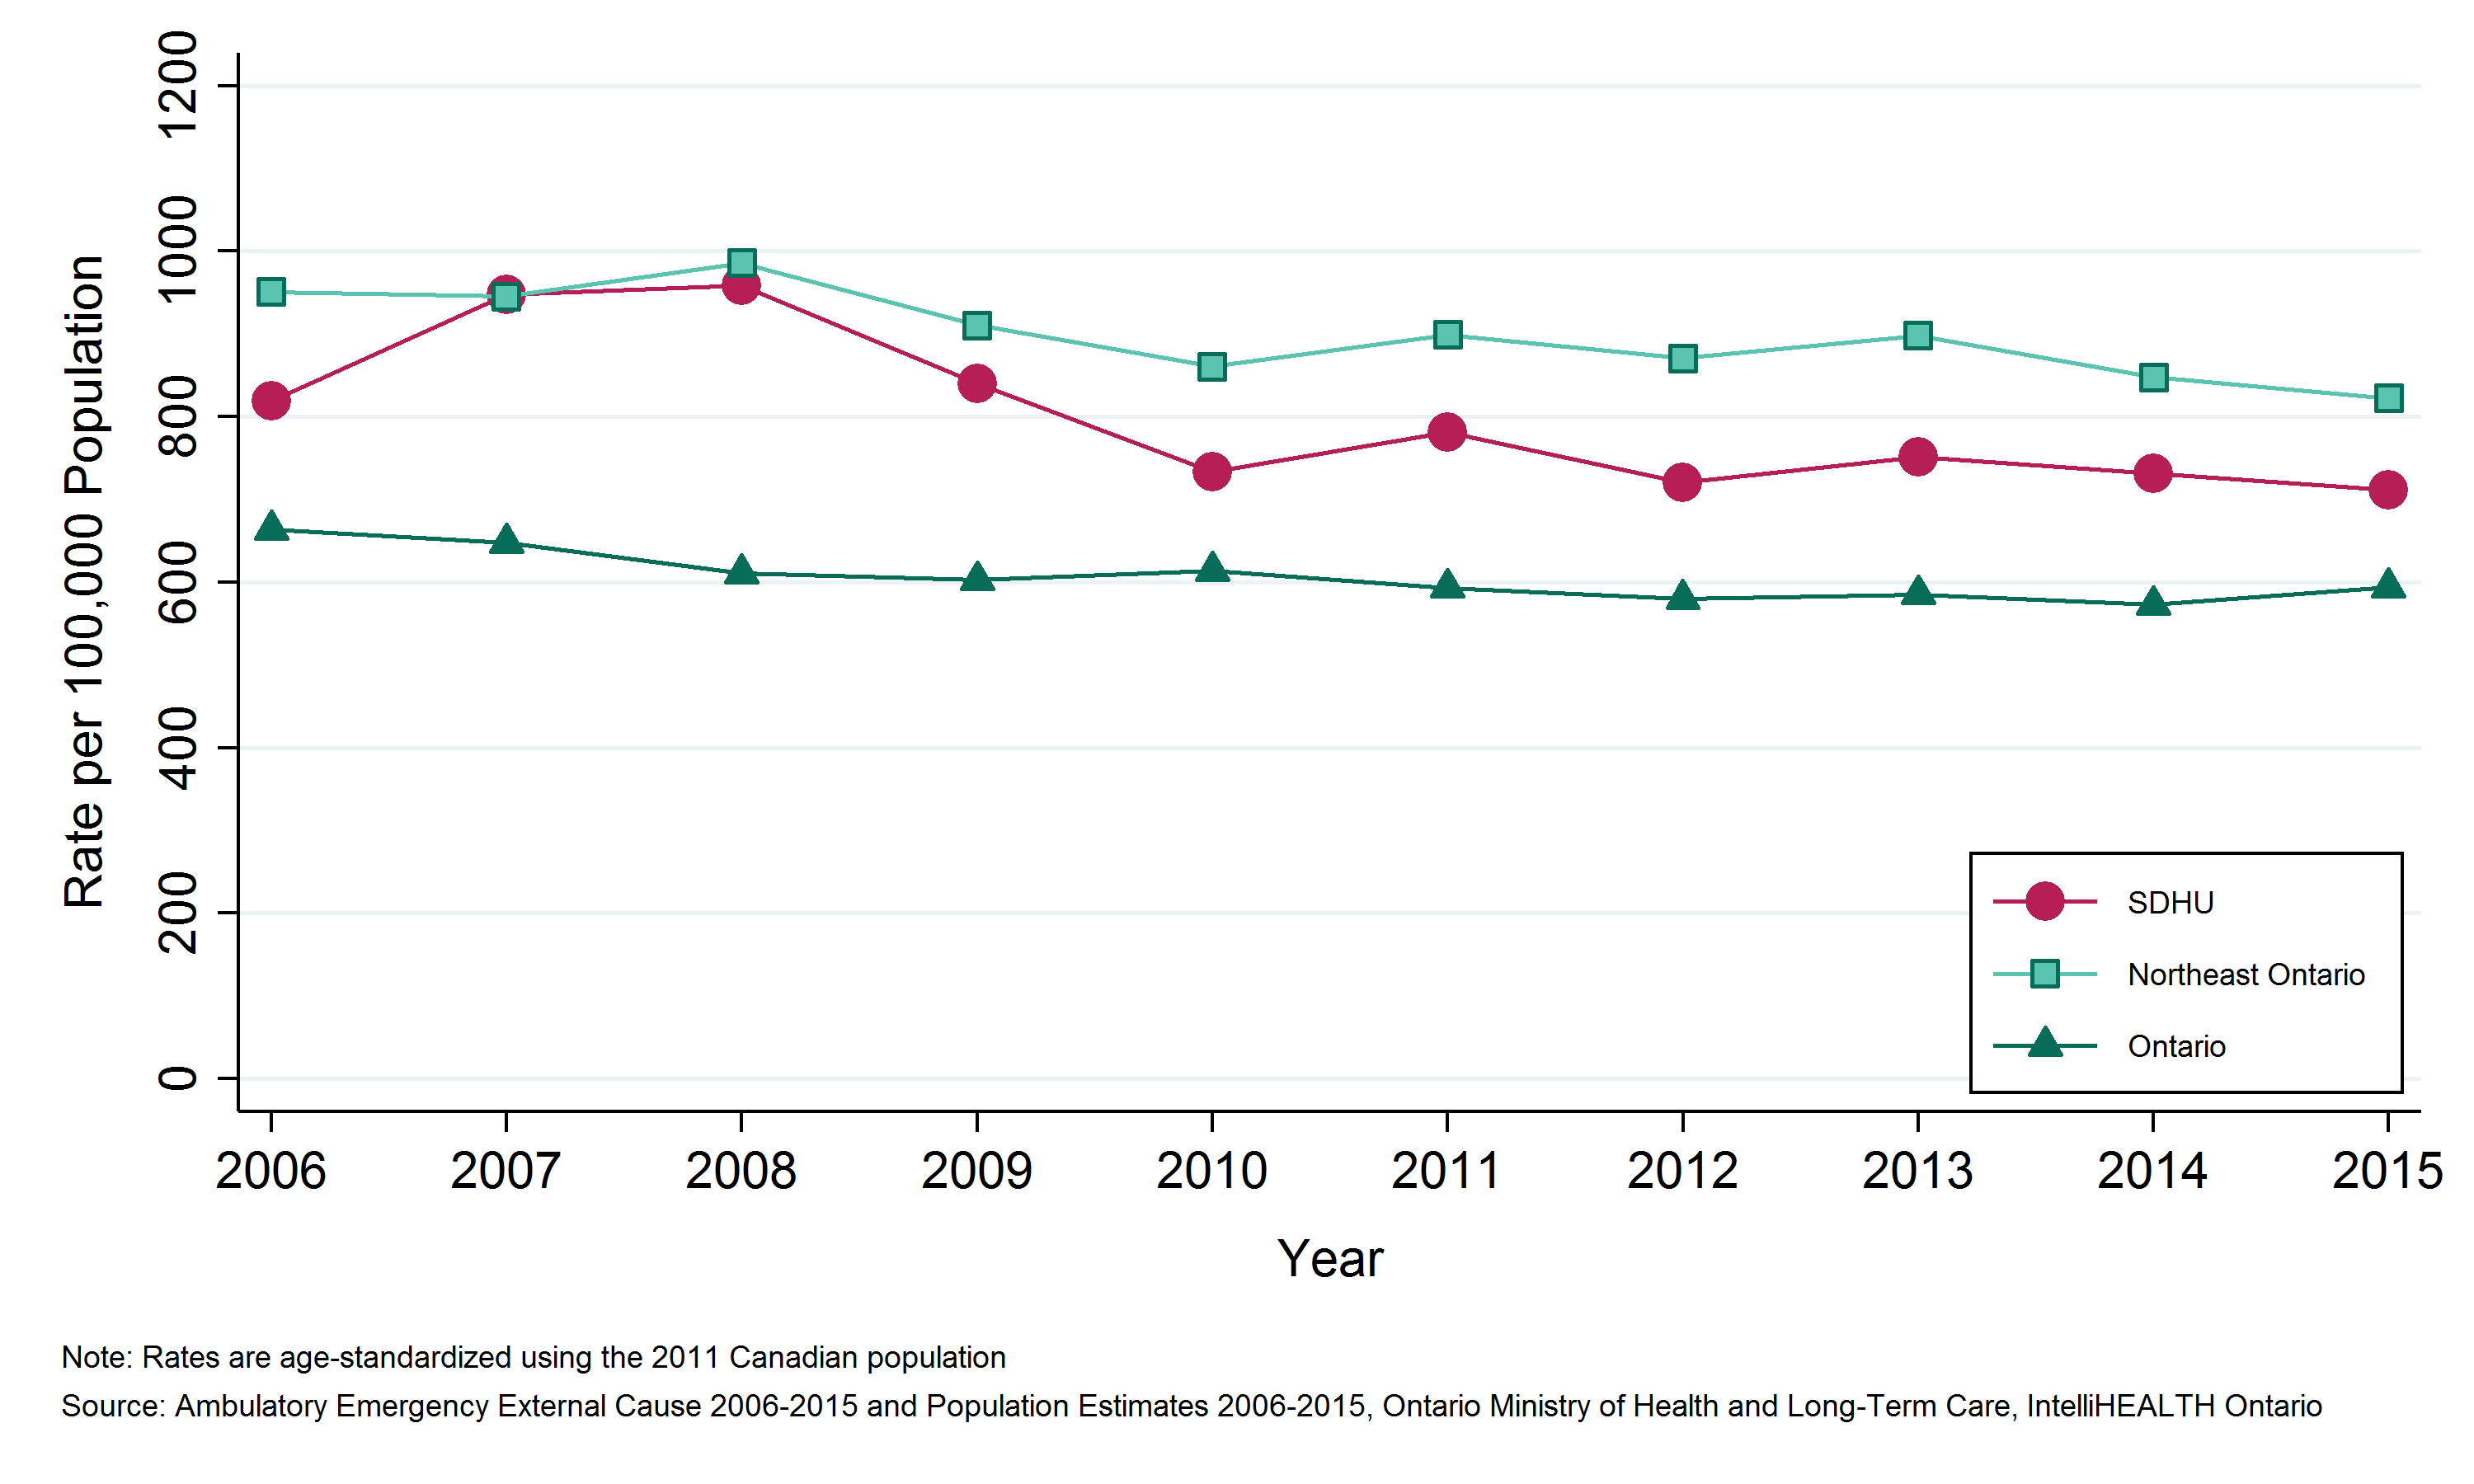
- Among residents of the Sudbury & District Health Unit (SDHU) area, there were 1,374 emergency department (ED) visits due to motor vehicle collisions (MVCs) in 2015.
- In 2015, the rate of ED visits due to MVCs in the SDHU area was 711 per 100,000 population per year.
- The rate of ED visits due to MVCs in the SDHU area has been consistently lower than that of northeastern Ontario, yet both the SDHU area and northeastern Ontario rates have been consistently higher than the rate for Ontario overall.
- Between 2006 and 2015, the ED visits rate due to MVCs in the SDHU area decreased slightly overall.
Notes:
- Geographic areas and/or time periods in which there is less access to walk-in clinics and other alternatives to the local ED can be expected to have higher rates of injury-related ED visits than they would otherwise.
- Rates are age-standardized using the 2011 Canadian population.
- Data Source: Ambulatory Emergency External Cause 2006 to 2015 (extracted June 6, 2016) and Population Estimates 2006 to 2015 (extracted October 7, 2016), Ontario Ministry of Health and Long-Term Care, IntelliHEALTH Ontario.
Figure: Annual age-standardized rate of emergency department visits, motor vehicle collisions, by geographic region, 2006 to 2015
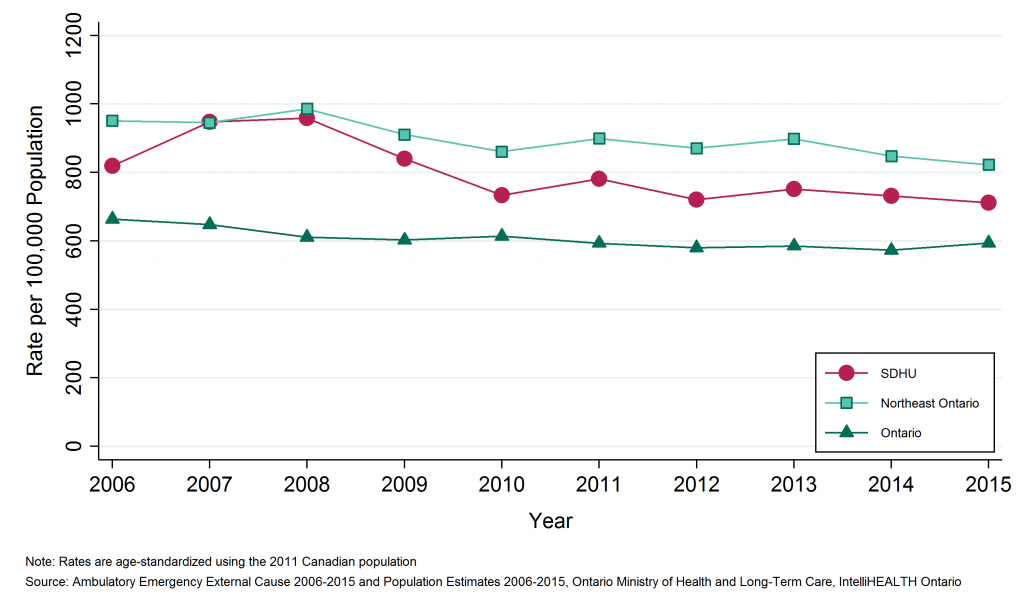
Table: Annual age-standardized rate of emergency department visits, motor vehicle collisions, by geographic region, 2006 to 2015
| Geographic Region | 2006 | 2007 | 2008 | 2009 | 2010 | 2011 | 2012 | 2013 | 2014 | 2015 |
| SDHU | 819.2 | 947.2 | 958.9 | 839.7 | 732.9 | 781.0 | 720.9 | 751.1 | 731.3 | 711.4 |
| Northeast | 950.7 | 945.4 | 985.9 | 910.3 | 860.8 | 899.1 | 870.6 | 898.1 | 847.8 | 822.5 |
| Ontario | 663.5 | 648.0 | 611.1 | 602.5 | 613.7 | 593.4 | 579.8 | 585.5 | 572.7 | 594.1 |
Table: Annual number of emergency department visits, motor vehicle collisions, by geographic region, 2006 to 2015
| Geographic Region | 2006 | 2007 | 2008 | 2009 | 2010 | 2011 | 2012 | 2013 | 2014 | 2015 |
| SDHU | 1,648 | 1,897 | 1,930 | 1,688 | 1,463 | 1,550 | 1,431 | 1,485 | 1,427 | 1,374 |
| Northeast | 5,416 | 5,360 | 5,564 | 5,123 | 4,815 | 4,988 | 4,803 | 4,927 | 4,601 | 4,399 |
| Ontario | 85,689 | 84,291 | 80,041 | 79,454 | 81,706 | 79,620 | 78,590 | 79,935 | 78,874 | 82,348 |
Emergency department (ED) visits due to motor vehicle collisions by Greater Sudbury and outlying areas
Key Findings:
- Between 2011 and 2015, there were 5,661 emergency department (ED) visits due to motor vehicle collisions (MVCs) among residents of Greater Sudbury and 1,606 among residents of the SDHU district office areas, an average of 1,132 and 321 per year, respectively.
- The rate of ED visits due to MVCs was 687 per 100,000 population per year in Greater Sudbury and 1,025 per 100,000 population per year in the SDHU district office areas between 2011 and 2015.
- The rate of ED visits due to MVCs among residents of Greater Sudbury has been consistently lower than among residents in the SDHU district office areas.
- The rate of ED visits due to MVCs among residents in both areas decreased slightly between 2006 to 2010 and 2011 to 2015.
Notes:
- Geographic areas and/or time periods in which there is less access to walk-in clinics and other alternatives to the local ED can be expected to have higher rates of injury-related ED visits than they would otherwise.
- Rates are age-standardized using the 2011 Canadian population.
- Data Source: Ambulatory Emergency External Cause 2006 to 2015 (extracted June 6, 2016) and Population Estimates 2006 to 2015 (extracted October 7, 2016), Ontario Ministry of Health and Long-Term Care, IntelliHEALTH Ontario.
Figure: Annual age-standardized rate of emergency department visits, motor vehicle collisions, by Greater Sudbury and outlying areas, 2006 to 2010 and 2011 to 2015
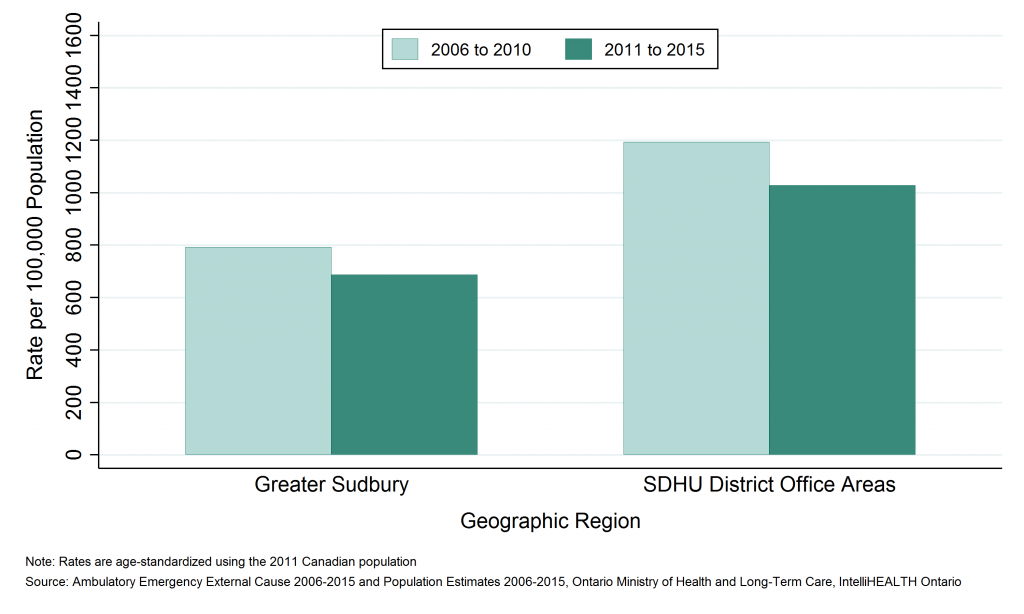
Table: Annual age-standardized rate of emergency department visits, motor vehicle collisions, by Greater Sudbury and outlying areas, 2006 to 2010 and 2011 to 2015
| Geographic Region | Rate per 100000 2006 to 2010 | Rate per 100000 2011 to 2015 |
| Greater Sudbury | 793.2 | 687.1 |
| SDHU District Office Areas | 1,192.8 | 1,028.5 |
Table: Annual number of emergency department visits, motor vehicle collisions, by Greater Sudbury and outlying areas, 2006 to 2010 and 2011 to 2015
| Geographic Region | Total Counts, 2006 to 2010 | Total Counts, 2011 to 2015 | Average Annual Counts, 2006 to 2010 | Average Annual Counts, 2011 to 2015 |
| Greater Sudbury | 6,627 | 5,661 | 1,325.4 | 1,132.2 |
| SDHU District Office Areas | 1,999 | 1,606 | 399.8 | 321.2 |
Emergency department (ED) visits due to motor vehicle collisions by sex
Key Findings:
- Between 2011 and 2015, there were 3,942 emergency department (ED) visits due to motor vehicle collisions (MVCs) among males, and 3,324 among females in the Sudbury & District Health Unit (SDHU) area, an average of 788 and 665 per year, respectively.
- The rate of ED visits due to MVCs was 803 per 100,000 males per year and 674 per 100,000 females per year in the SDHU area between 2011 and 2015.
- The rate of ED visits due to MVCs among males has been consistently higher than the rate among females.
- In the SDHU area, the rate of ED visits due to MVCs decreased among both males and females over time between 2006 to 2010 and 2011 to 2015.
Notes:
- Geographic areas and/or time periods in which there is less access to walk-in clinics and other alternatives to the local ED can be expected to have higher rates of injury-related ED visits than they would otherwise.
- Rates are age-standardized using the 2011 Canadian population.
- Data Source: Ambulatory Emergency External Cause 2006 to 2015 (extracted June 6, 2016) and Population Estimates 2006 to 2015 (extracted October 7, 2016), Ontario Ministry of Health and Long-Term Care, IntelliHEALTH Ontario.
Figure: Annual age-standardized rate of emergency department visits, motor vehicle collisions, by sex, SDHU, 2006 to 2010 and 2011 to 2015
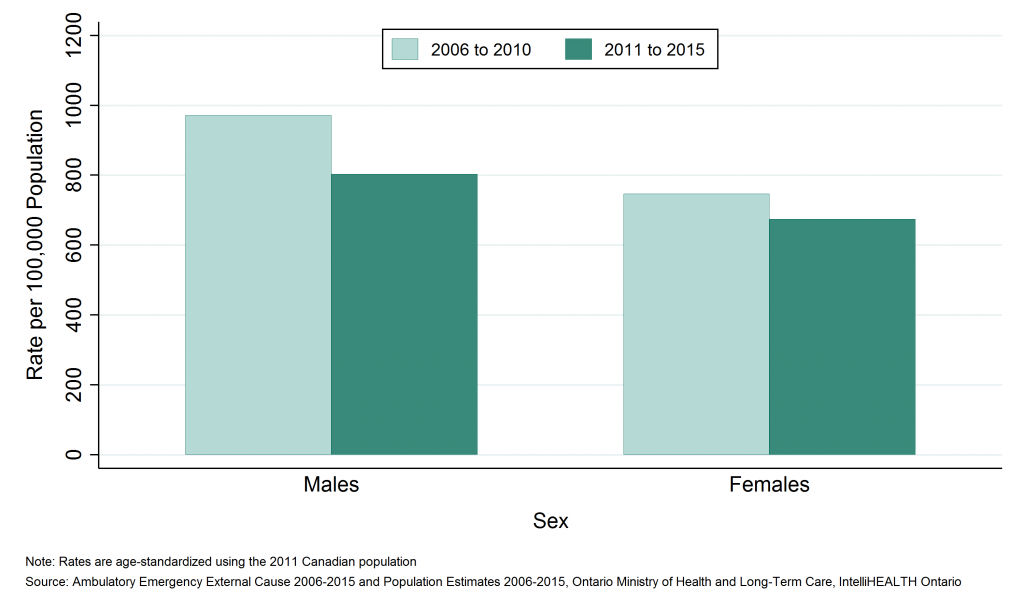
Table: Annual age-standardized rate of emergency department visits, motor vehicle collisions, by sex, SDHU, 2006 to 2010 and 2011 to 2015
| Sex | Rate per 100,000, 2006 to 2010 | Rate per 100,000, 2011 to 2015 |
| Males | 971.4 | 803.3 |
| Females | 746.4 | 675.0 |
Table: Annual number of emergency department visits, motor vehicle collisions, by sex, SDHU, 2006 to 2010 and 2011 to 2015
| Sex | Total Counts, 2006 to 2010 | Total Counts, 2011 to 2015 | Average Annual Counts, 2006 to 2010 | Average Annual Counts, 2011 to 2015 |
| Males | 4,861 | 3,942 | 972.2 | 788.4 |
| Females | 3,765 | 3,324 | 753.0 | 664.8 |
Emergency department (ED) visits due to motor vehicle collisions by age group
Key Findings:
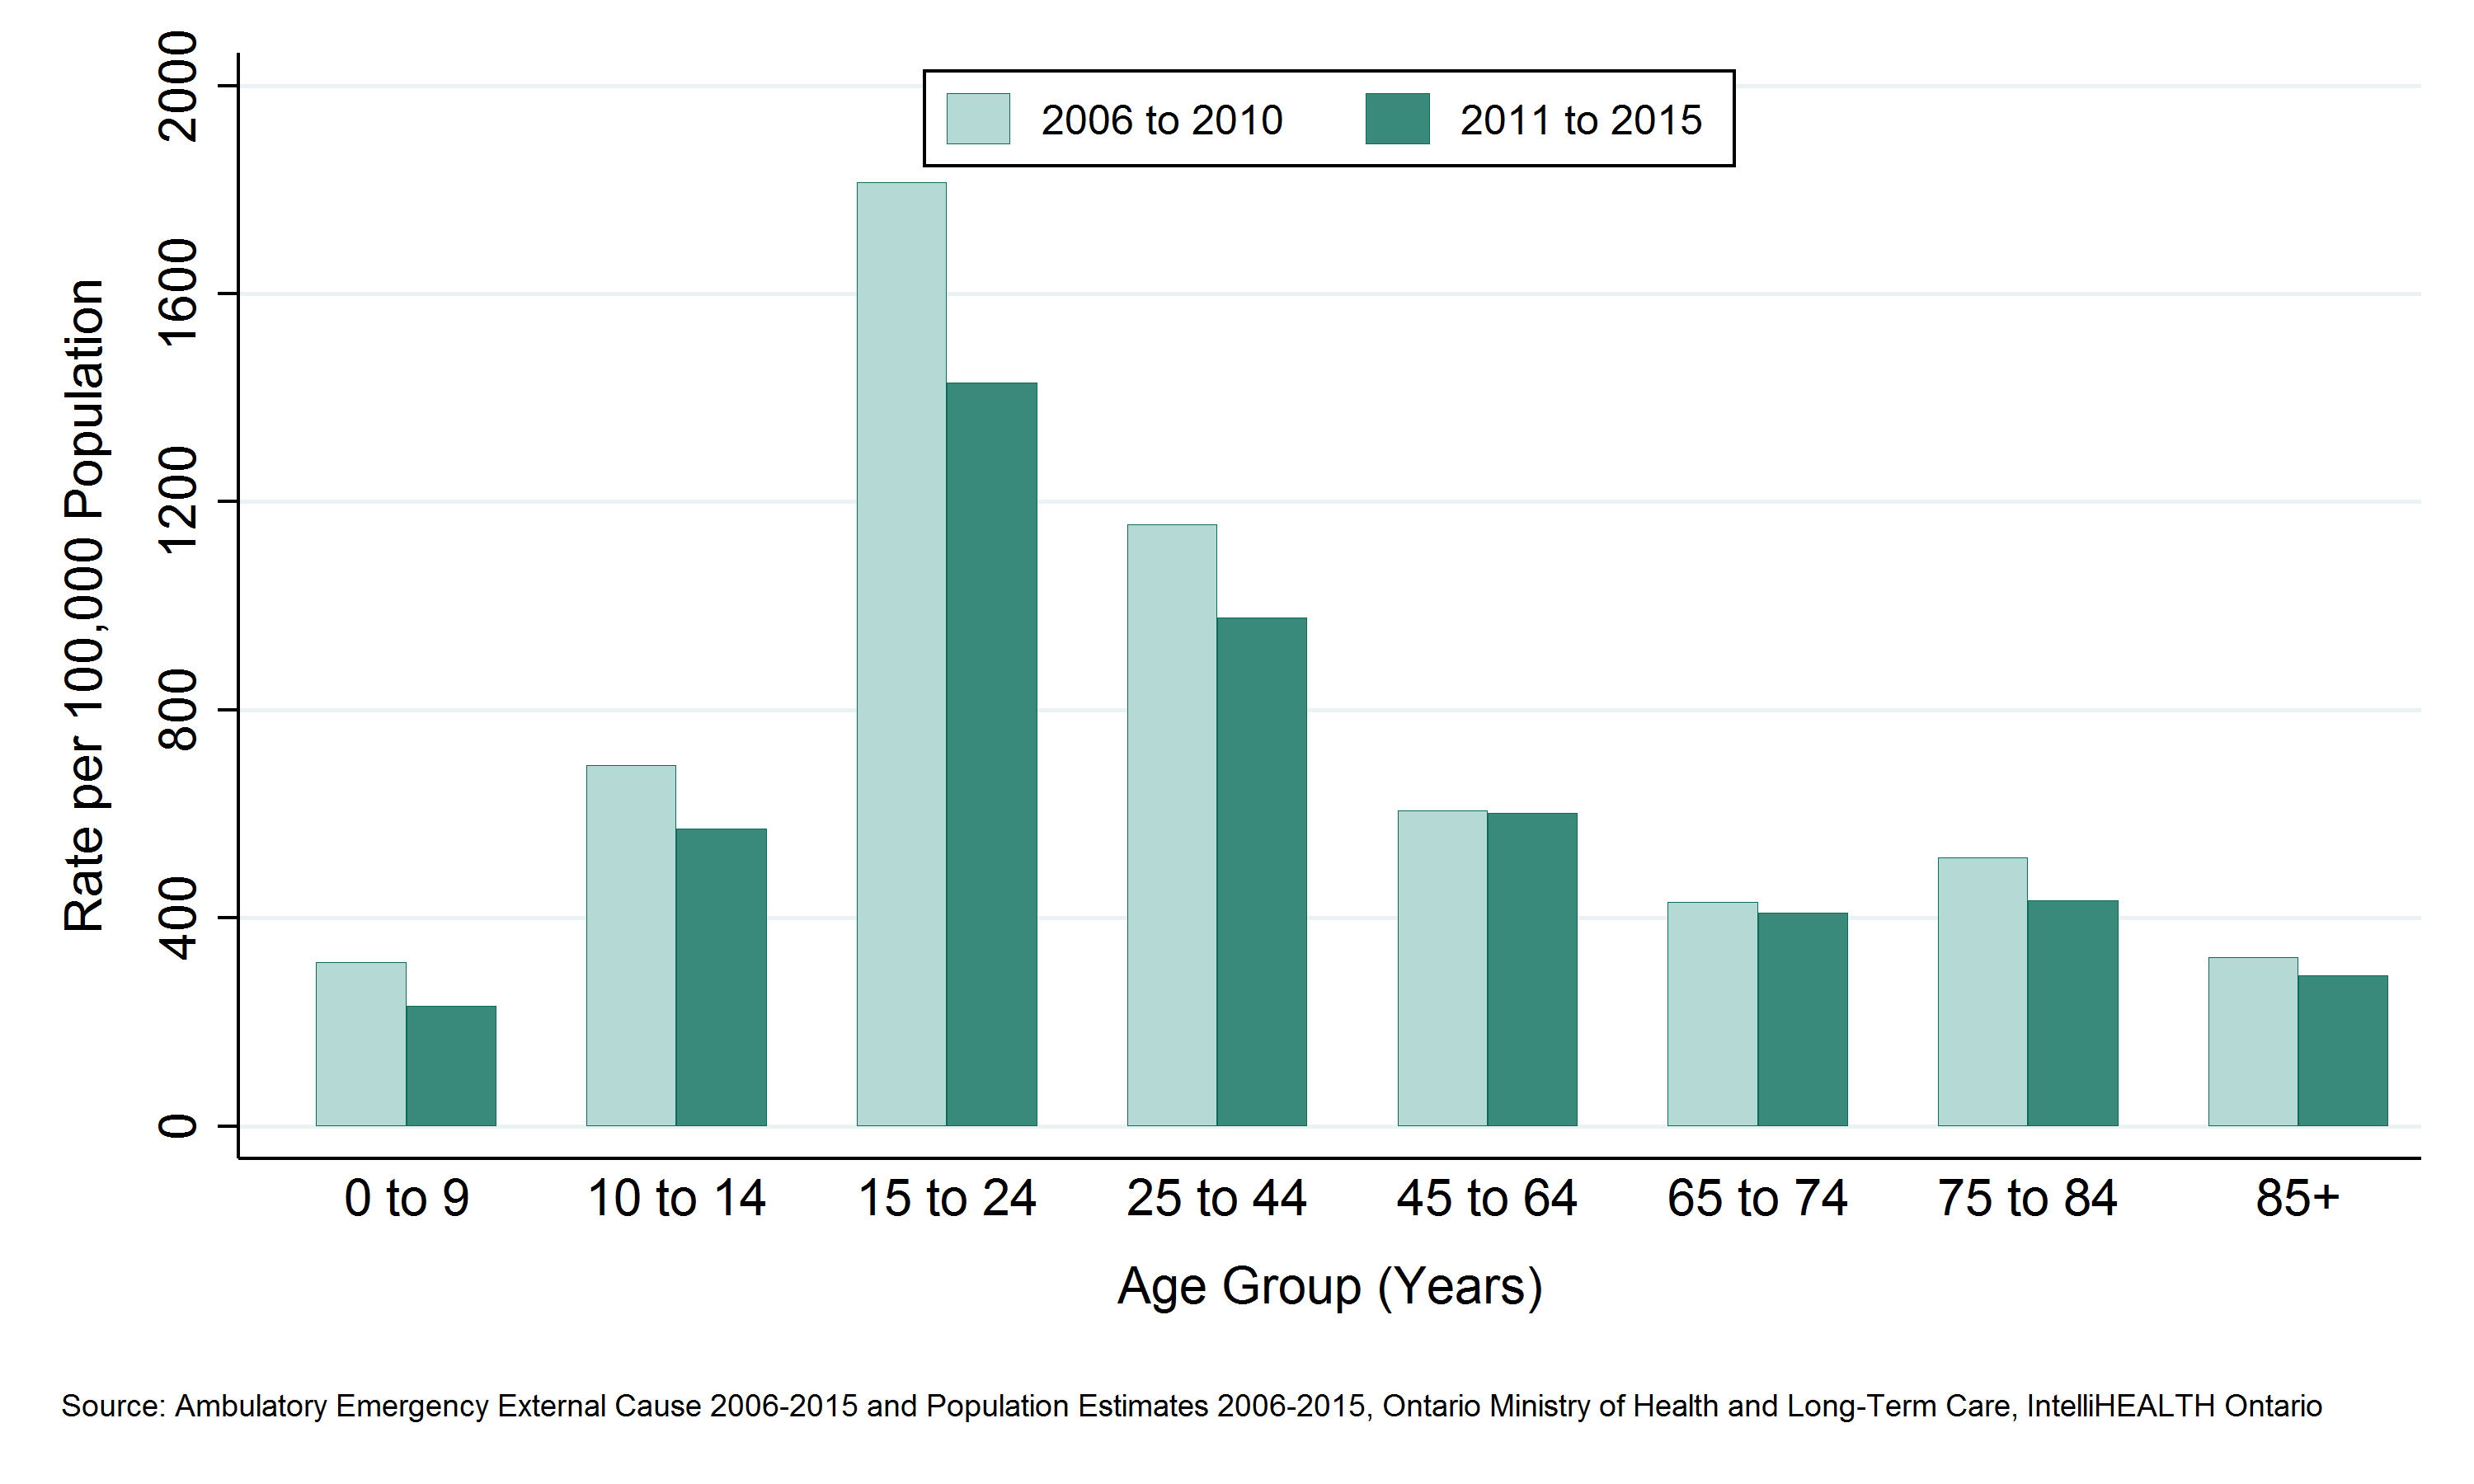
- Among residents of the Sudbury & District Health Unit (SDHU) area, the 25 to 44 age group visited the emergency department (ED) the most due to motor vehicle collisions (MVCs), with 2,390 ED visits between 2011 and 2015, or 478 ED visits per year on average.
- Between 2011 and 2015, the 15 to 24 year age group had the highest ED visits rate due to MVCs with 1,428 ED visits per 100,000 population per year.
- Rates of ED visits due to MVCs increase significantly in the 15 to 24 age group, then decrease with increasing age.
- In the SDHU area, the ED visits rate due to MVCs decreased in most age groups between 2006 to 2010 and 2011 to 2015. The 45 to 64, 65 to 74 and 85+ year age groups had little to no change.
Notes:
- Geographic areas and/or time periods in which there is less access to walk-in clinics and other alternatives to the local ED can be expected to have higher rates of injury-related ED visits than they would otherwise.
- Rates are age-standardized using the 2011 Canadian population.
- Data Source: Ambulatory Emergency External Cause 2006 to 2015 (extracted June 6, 2016) and Population Estimates 2006 to 2015 (extracted October 7, 2016), Ontario Ministry of Health and Long-Term Care, IntelliHEALTH Ontario.
Figure: Annual rate of emergency department visits, motor vehicle collisions, by age group, SDHU, 2006 to 2010 and 2011 to 2015

Table: Annual rate of emergency department visits, motor vehicle collisions, by age group, SDHU, 2006 to 2010 and 2011 to 2015
| Age Group | Rate per 100000, 2006 to 2010 | Rate per 100000, 2011 to 2015 |
| 0 to 9 | 314.3 | 231.4 |
| 10 to 14 | 693.5 | 571.7 |
| 15 to 24 | 1,814.3 | 1,428.4 |
| 25 to 44 | 1,155.9 | 977.8 |
| 45 to 64 | 607.0 | 601.3 |
| 65 to 74 | 430.4 | 409.3 |
| 75 to 84 | 516.3 | 433.4 |
| 85+ | 324.9 | 290.0 |
Table: Annual number of emergency department visits, motor vehicle collisions, by age group, SDHU, 2006 to 2010 and 2011 to 2015
| Age Group | Total Counts, 2006 to 2010 | Total Counts, 2011 to 2015 | Average Annual Counts, 2006 to 2010 | Average Annual Counts, 2011 to 2015 |
| 0 to 9 | 310 | 222 | 62.0 | 44.4 |
| 10 to 14 | 419 | 295 | 83.8 | 59.0 |
| 15 to 24 | 2,413 | 1,839 | 482.6 | 367.8 |
| 25 to 44 | 2,996 | 2,390 | 599.2 | 478.0 |
| 45 to 64 | 1,804 | 1,827 | 360.8 | 365.4 |
| 65 to 74 | 364 | 401 | 72.8 | 80.2 |
| 75 to 84 | 270 | 236 | 54.0 | 47.2 |
| 85+ | 50 | 57 | 10.0 | 11.4 |
Deaths due to motor vehicle collisions by geographic region
Key Findings:
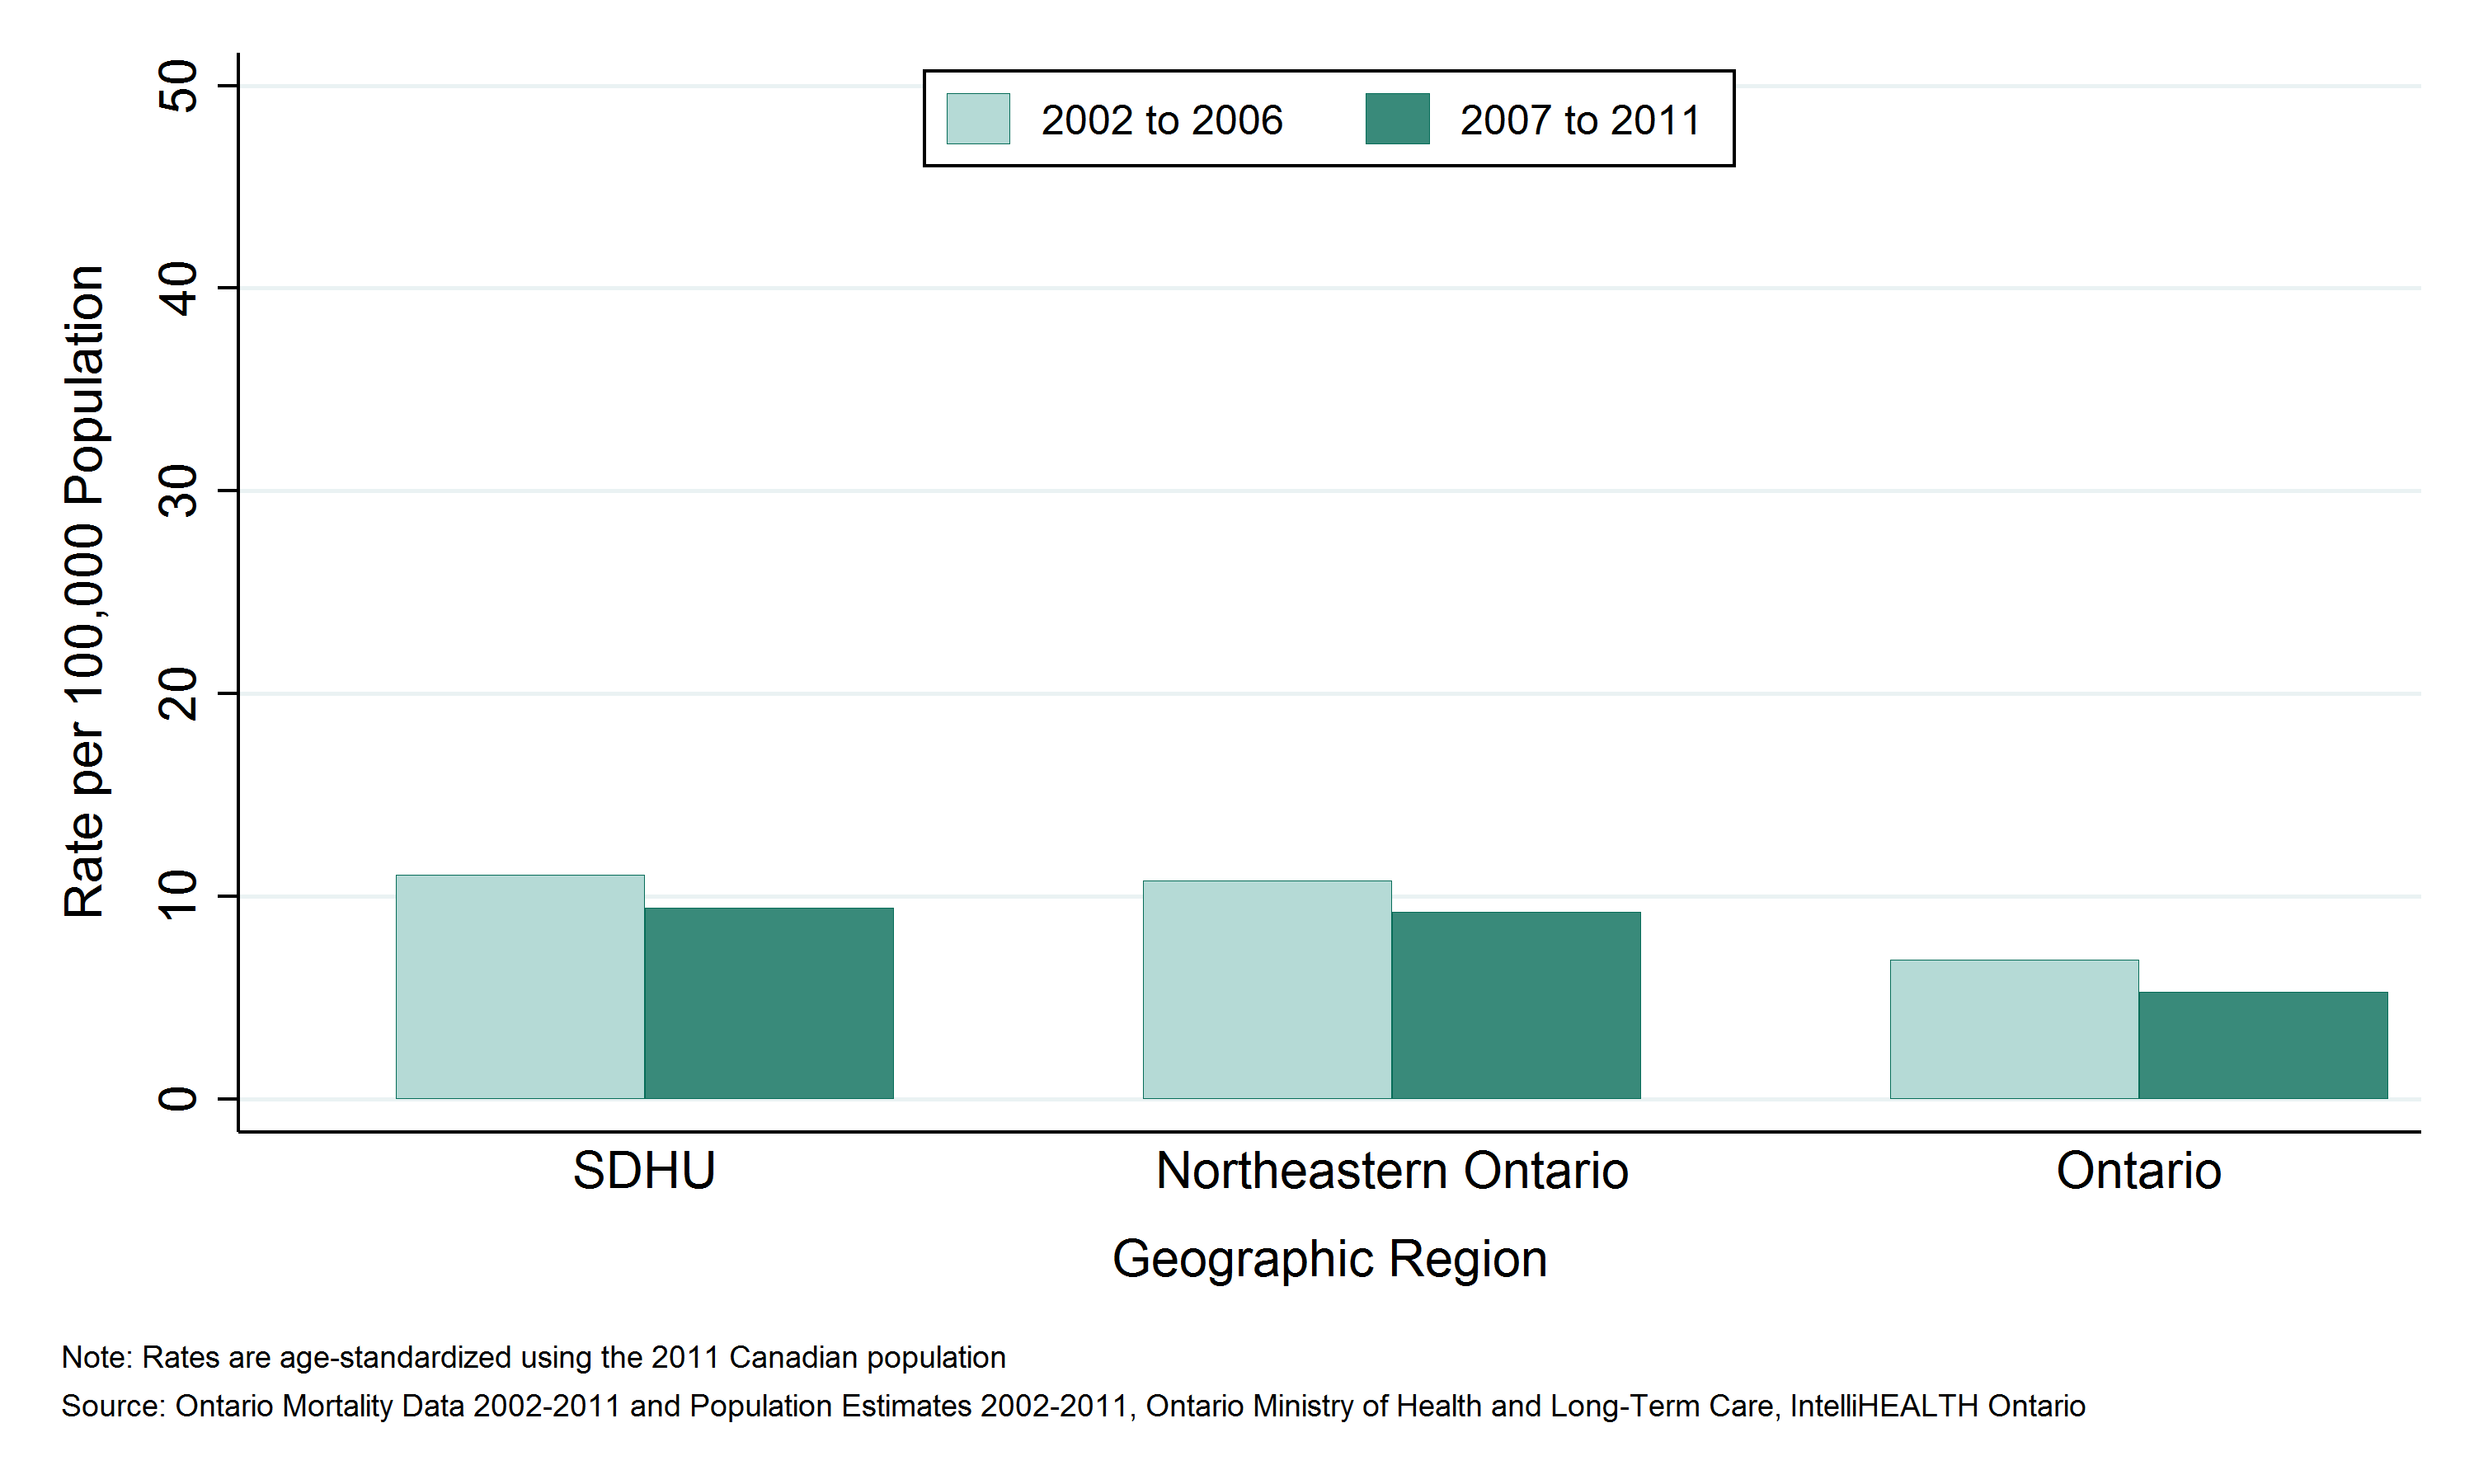
- Among residents of the Sudbury & District Health Unit (SDHU) area, there were 608 deaths due to motor vehicle collisions (MVCs) between 2007 and 2011, an average of 122 per year.
- Between 2006 and 2015, the mortality rate due to MVCs in the SDHU area was 62 deaths per 100,000 population per year.
- The mortality rates due to MVCs in the SDHU area is similar to that in northeastern Ontario, and higher than the rate in Ontario overall.
- Between 2002 to 2006 and 2007 to 2011, the mortality rate due to MVCs in the SDHU area remained stable.
Notes:
- Geographic areas and/or time periods in which there is less access to walk-in clinics and other alternatives to the local ED can be expected to have higher rates of injury-related ED visits than they would otherwise.
- Rates are age-standardized using the 2011 Canadian population.
- Data Source: Ontario Mortality Data 2002 to 2011 (extracted June 6, 2016) and Population Estimates 2006 to 2015 (extracted October 7, 2016), Ontario Ministry of Health and Long-Term Care, IntelliHEALTH Ontario.
Figure: Annual age-standardized mortality rate, motor vehicle collisions, by geographic region, 2002 to 2006 and 2007 to 2011

Table: Annual age-standardized mortality rate, motor vehicle collisions, by geographic region, 2002 to 2006 and 2007 to 2011
| Geographic Region | Rate per 100,000 2002 to 2006 | Rate per 100,000 2007 to 2011 |
| SDHU | 11.1 | 9.4 |
| Northeast | 10.8 | 9.3 |
| Ontario | 6.9 | 5.3 |
Table: Annual number of deaths, motor vehicle collisions, by geographic region, 2002 to 2006 and 2007 to 2011
| Geographic Region | Total Counts 2002 to 2006 | Total Counts 2007 to 2011 | Average Annual Counts, 2002 to 2006 | Average Annual Counts, 2007 to 2011 |
| SDHU | 109 | 96 | 21.8 | 19.2 |
| Northeast | 307 | 270 | 61.4 | 54.0 |
| Ontario | 4,153 | 3,430 | 830.6 | 686.0 |
Potential years of life lost (PYLL) due to motor vehicle collisions by geographic region
Key Findings:
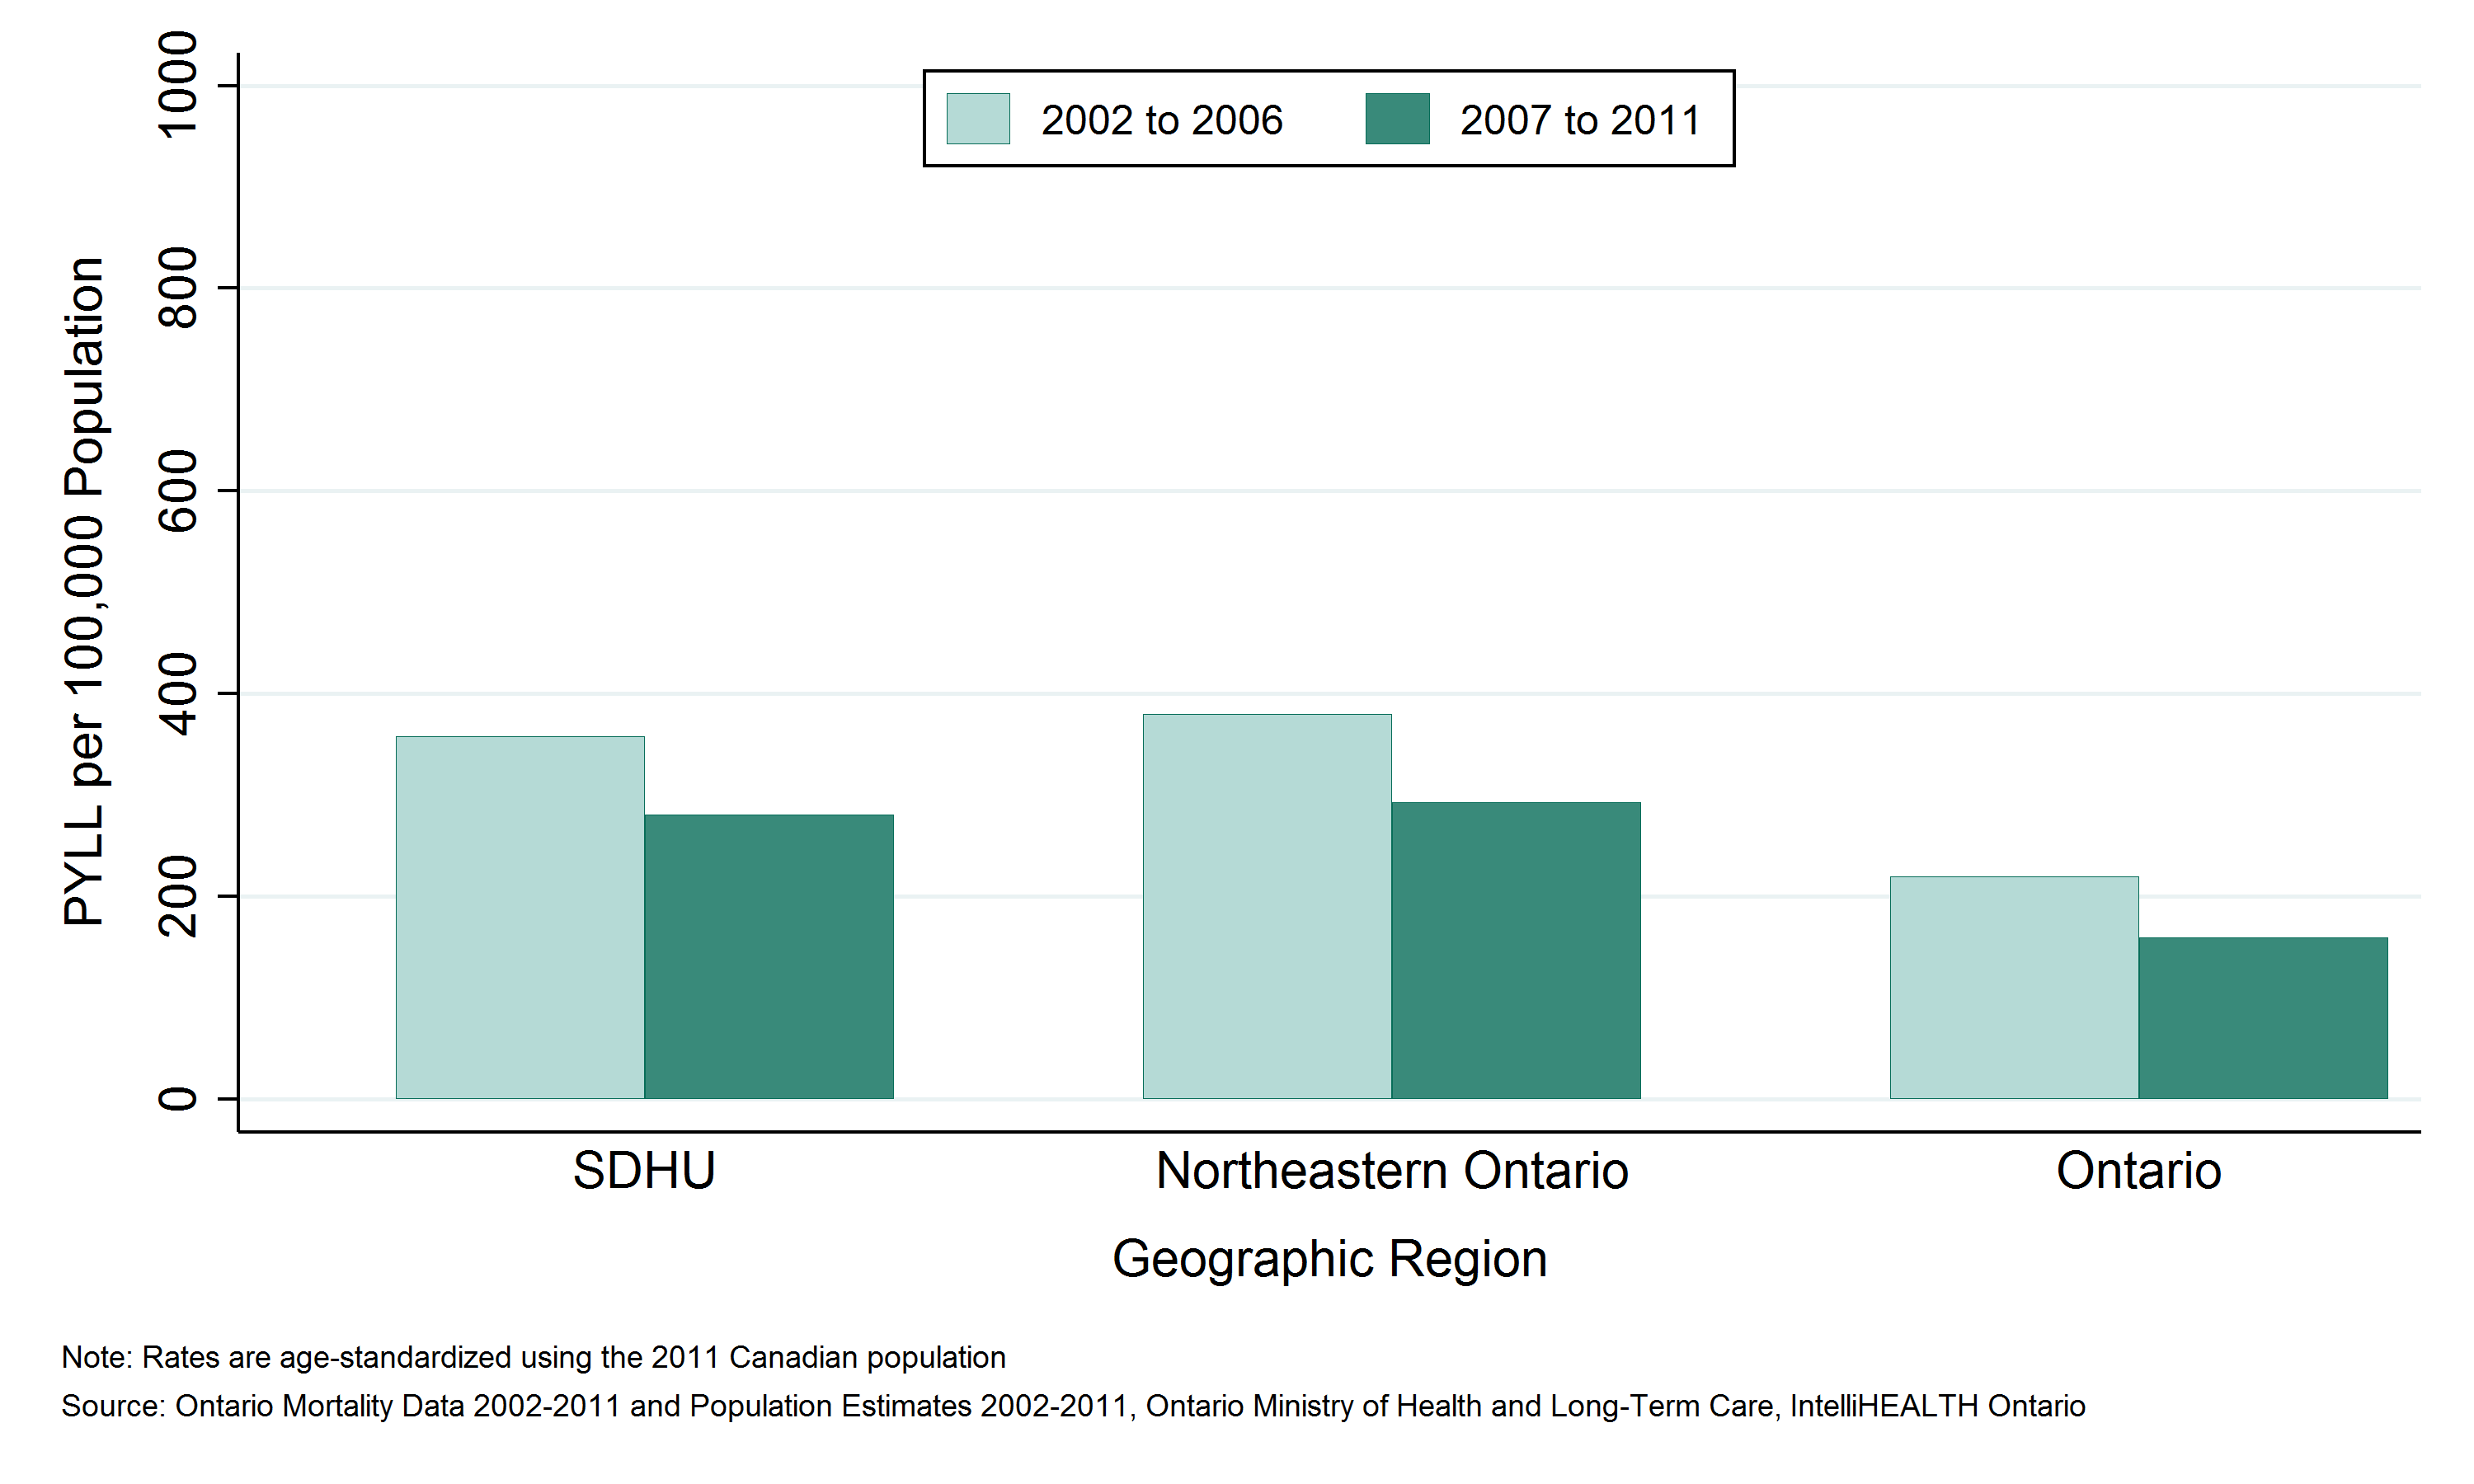
- In 2011, Sudbury & District Health Unit (SDHU) area residents lost 12,497 years of potential life due to deaths from motor vehicle collisions (MVCs) before the age of 75, an average of 2,499 per year.
- The rate of potential years of life lost (PYLL) in the SDHU area due to MVCs was 1,308 PYLL per 100,000 population per year.
- The rate of PYLL due to MVCs in the SDHU area has been similar to that in northeastern Ontario, while rates in both areas have been higher than the rate in Ontario overall.
- Between 2002 to 2006 and 2007 to 2011, the rate of PYLL due to MVCs in the SDHU area has been stable.
Notes:
- Geographic areas and/or time periods in which there is less access to walk-in clinics and other alternatives to the local ED can be expected to have higher rates of injury-related ED visits than they would otherwise.
- Rates are age-standardized using the 2011 Canadian population.
- Data Source: Ontario Mortality Data 2002 to 2011 (extracted June 6, 2016) and Population Estimates 2006 to 2015 (extracted October 7, 2016), Ontario Ministry of Health and Long-Term Care, IntelliHEALTH Ontario.
Figure: Annual age-standardized rate of potential years of life lost (PYLL), motor vehicle collisions, by geographic region, 2002 to 2006 and 2007 to 2011

Table: Annual age-standardized rate of potential years of life lost (PYLL), motor vehicle collisions, by geographic region, 2002 to 2006 and 2007 to 2011
| Geographic Region | Rate per 100,000, 2002 to 2006 | Rate per 100,000, 2007 to 2011 |
| SDHU | 358.3 | 281.0 |
| Northeast | 380.1 | 293.3 |
| Ontario | 219.6 | 159.8 |
Table: Annual number of potential years of life lost (PYLL), motor vehicle collisions, by geographic region, 2002 to 2006 and 2007 to 2011
| Geographic Region | Total PYLL, 2002 to 2006 | Total PYLL, 2007 to 2011 | Average Annual Counts, 2002 to 2006 | Average Annual Counts, 2007 to 2011 |
| SDHU | 3,457 | 2,701 | 691.4 | 540.2 |
| Northeast | 10,407 | 7,863 | 2,081.4 | 1,572.6 |
| Ontario | 136,178 | 102,607 | 27,235.6 | 20,521.4 |
This item was last modified on July 25, 2017