Falls among seniors (age 65 and over)
Injuries in this section are those due from a fall. This includes those resulting from jumping or diving into water causing injury other than drowning or submersion. This section excludes falls:
- resulting from an assault
- resulting from intentional self-harm
- from an animal
- in or from a burning building
- into fire
- into water (with drowning or submersion)
- into machinery in operation
- from a transport vehicle
Emergency department (ED) visits due to falls among seniors (age 65 and over) by geographic region
Key Findings:
- Among residents of the Sudbury & District Health Unit (SDHU) area, there were 2,009 emergency department (ED) visits for falls among seniors in 2015.
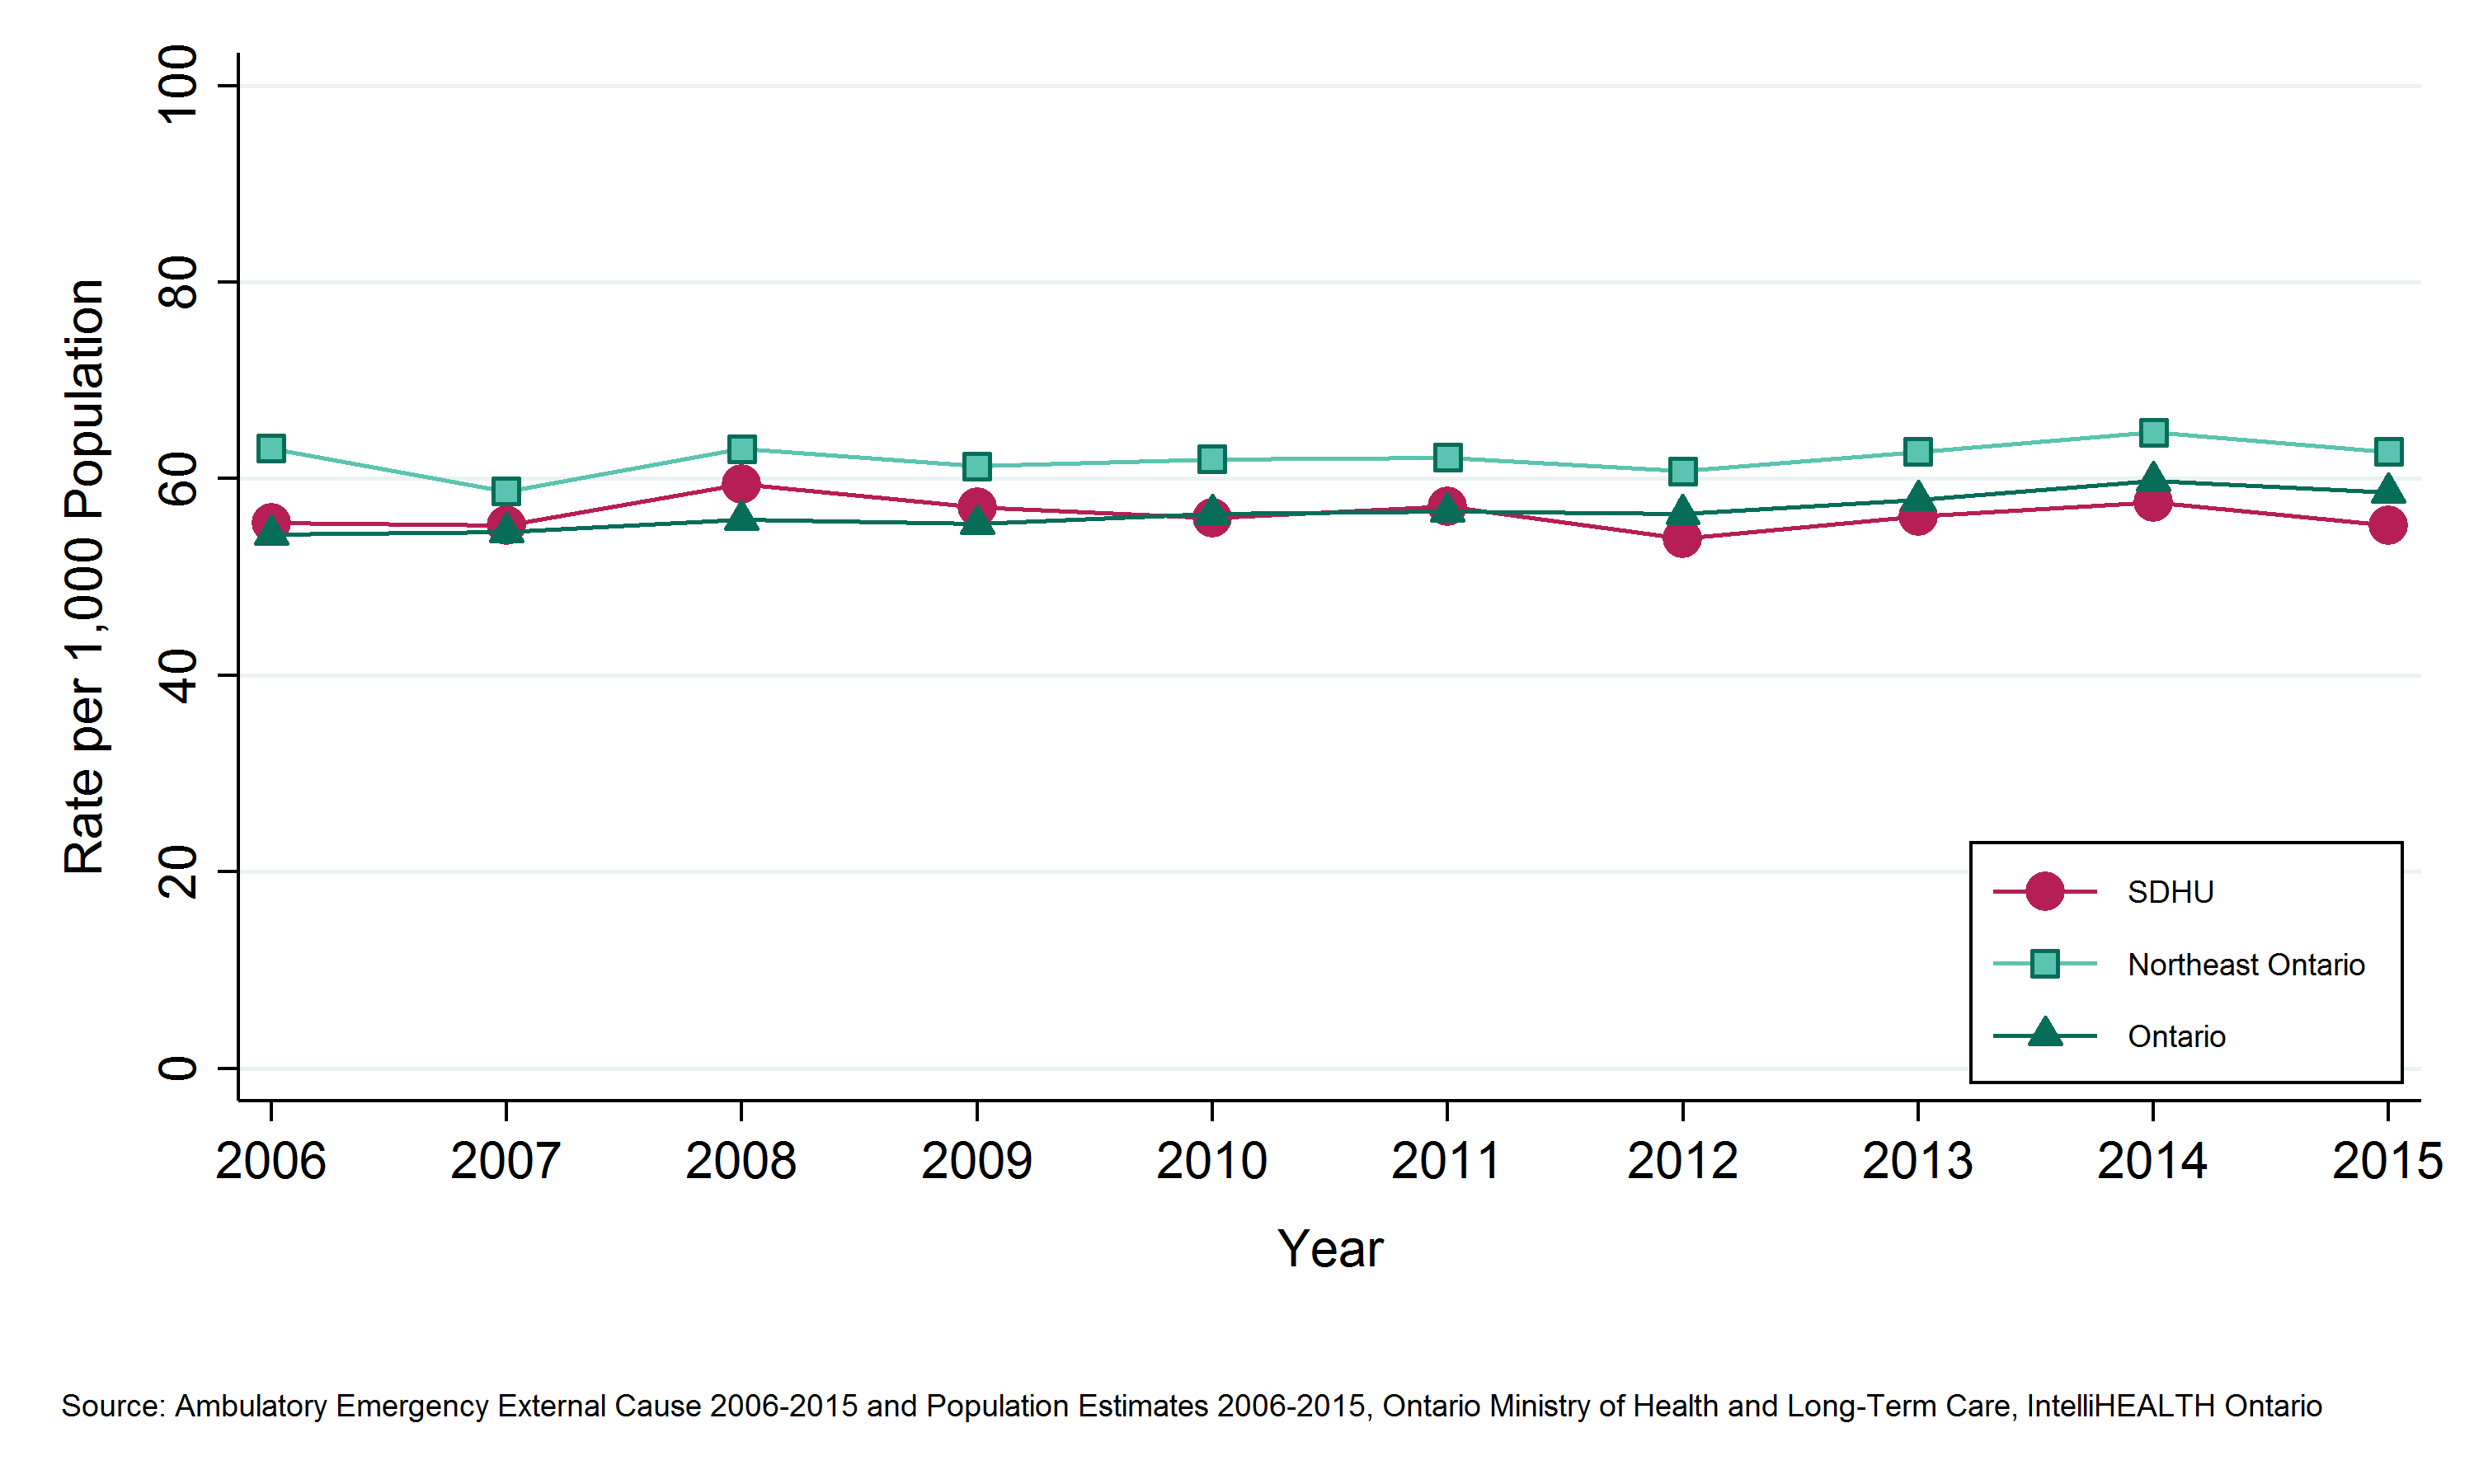
- In 2015, the ED visits rate for falls among seniors in the SDHU area was 55 per 1,000 seniors per year.
- The rate of ED visits for falls among seniors in the SDHU area has been consistently lower than that of northeastern Ontario, yet similar to the rate for Ontario overall.
- Between 2006 and 2015, the rate of ED visits for falls among seniors in the SDHU area remained stable over time.
Notes:
- Geographic areas and/or time periods in which there is less access to walk-in clinics and other alternatives to the local ED can be expected to have higher rates of injury-related ED visits than they would otherwise.
- Data Source: Ambulatory Emergency External Cause 2006 to 2015 (extracted June 6, 2016) and Population Estimates 2006 to 2015 (extracted October 7, 2016), Ontario Ministry of Health and Long-Term Care, IntelliHEALTH Ontario.
Figure: Annual rate of emergency department visits, falls, ages 65+, by geographic region, 2006 to 2015
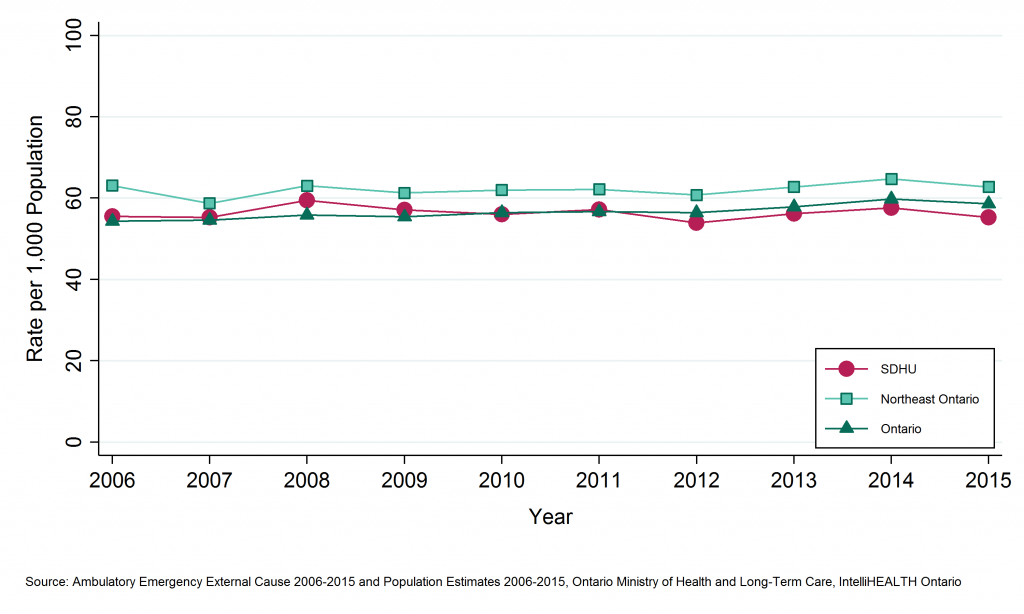
Table: Annual rate of emergency department visits, falls, ages 65+, by geographic region, 2006 to 2015
| Geographic Region | 2006 | 2007 | 2008 | 2009 | 2010 | 2011 | 2012 | 2013 | 2014 | 2015 |
| SDHU | 55.5 | 55.2 | 59.4 | 57.1 | 56.0 | 57.2 | 53.9 | 56.2 | 57.6 | 55.3 |
| Northeast | 63.1 | 58.7 | 63.0 | 61.3 | 62.0 | 62.2 | 60.8 | 62.8 | 64.7 | 62.7 |
| Ontario | 54.4 | 54.6 | 55.8 | 55.4 | 56.5 | 56.6 | 56.5 | 57.9 | 59.8 | 58.6 |
Table: Annual number of emergency department visits, falls, ages 65+, by geographic region, 2006 to 2015
| Geographic Region | 2006 | 2007 | 2008 | 2009 | 2010 | 2011 | 2012 | 2013 | 2014 | 2015 |
| SDHU | 1,623 | 1,647 | 1,812 | 1,774 | 1,772 | 1,848 | 1,802 | 1,940 | 2,044 | 2,009 |
| Northeast | 5,730 | 5,436 | 5,962 | 5,891 | 6,056 | 6,197 | 6,255 | 6,643 | 7,027 | 6,960 |
| Ontario | 89,636 | 92,113 | 96,781 | 98,620 | 103,319 | 106,900 | 111,341 | 119,077 | 127,721 | 129,544 |
Leading causes of falls injury in seniors (age 65 and over) by geographic region
Key Findings:
- A large proportion (23%) of fall-related emergency department (ED) visits among seniors between 2011 and 2015 were due to falls with an unspecified cause. These visits are not shown in the graphs and tables below, but are accounted for in the calculation of percentages.
- Between 2011 and 2015, the most commonly specified cause of fall-related ED visits among seniors in the Sudbury & District Health Unit (SDHU) area was slips, trips, and stumbles, accounting for 28% of fall-related ED visits. The second most common cause was falls from stairs/steps, which accounted for 13%.
- Between 2011 and 2015, there were on average 1,460 ED visits per year among seniors for slips, trips, and stumbles, and 849 visits per year due to falls from stairs/steps.
- The percentage of fall-related ED visits among seniors due to slips, trips and stumbles is lower in the SDHU area than that in Ontario.
Notes:
- Data Source: Ambulatory Emergency External Cause 2006 to 2015 (extracted June 6, 2016), Ontario Ministry of Health and Long-Term Care, IntelliHEALTH Ontario.
Figure: Leading causes of fall-related emergency department visits (%), ages 65+, by geographic region, 2011 to 2015
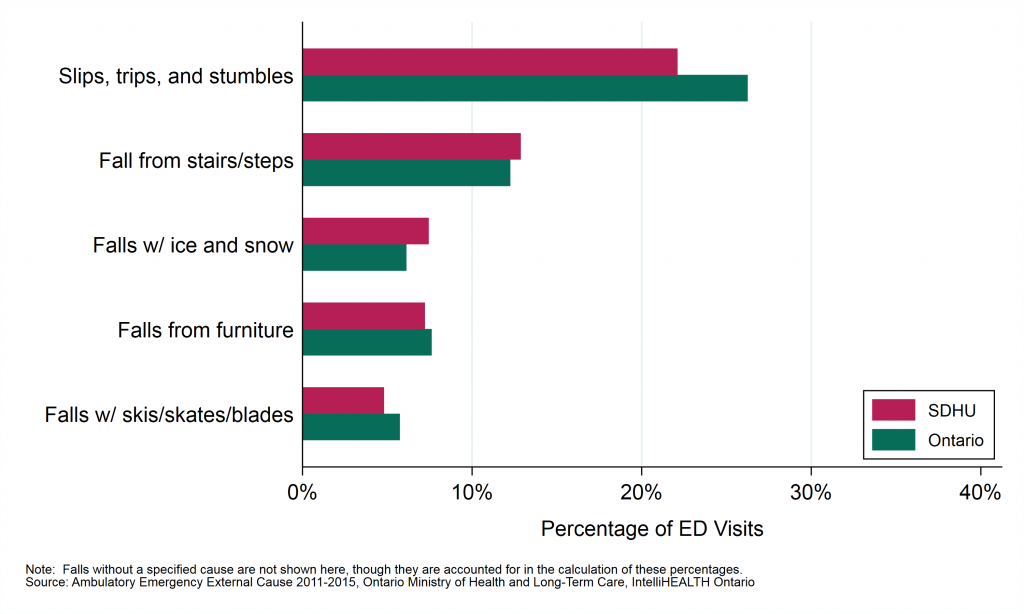
Table: Percent of leading causes of fall-related emergency department visits (%), ages 65+, by geographic region, 2006 to 2015
| Rank | Leading Cause | SDHU | Ontario |
| 1 | Slips, trips, and stumbles | 22.1 | 26.3 |
| 2 | Fall from stairs/steps | 12.9 | 12.3 |
| 3 | Falls w/ ice and snow | 7.4 | 6.1 |
| 4 | Falls from furniture | 7.2 | 7.6 |
| 5 | Falls w/ skis/skates/blades | 4.8 | 5.7 |
Table: Number of leading causes of fall-related emergency department visits (%), ages 65+, by geographic region, 2011 to 2015
| Rank | Leading Cause | Total Count, SDHU | Total Counts, Ontario | Average Annual Count, SDHU | Average Annual Count, Ontario |
| 1 | Slips, trips, and stumbles | 7,298 | 542,279 | 1,460 | 108,456 |
| 2 | Fall from stairs/steps | 4,246 | 253,123 | 849 | 50,625 |
| 3 | Falls w/ ice and snow | 2,456 | 126,564 | 491 | 25,313 |
| 4 | Falls from furniture | 2,382 | 157,323 | 476 | 31,465 |
| 5 | Falls w/ skis/skates/blades | 1,586 | 118,522 | 317 | 23,704 |
Emergency department (ED) visits due to falls among seniors (age 65 and over) by Greater Sudbury and outlying areas
Key Findings:
- Between 2011 and 2015, there were 7,232 emergency department (ED) visits for falls among seniors in Greater Sudbury and 2,411 falls among seniors in the SDHU district office areas, an average of 1,446 and 482 per year, respectively.
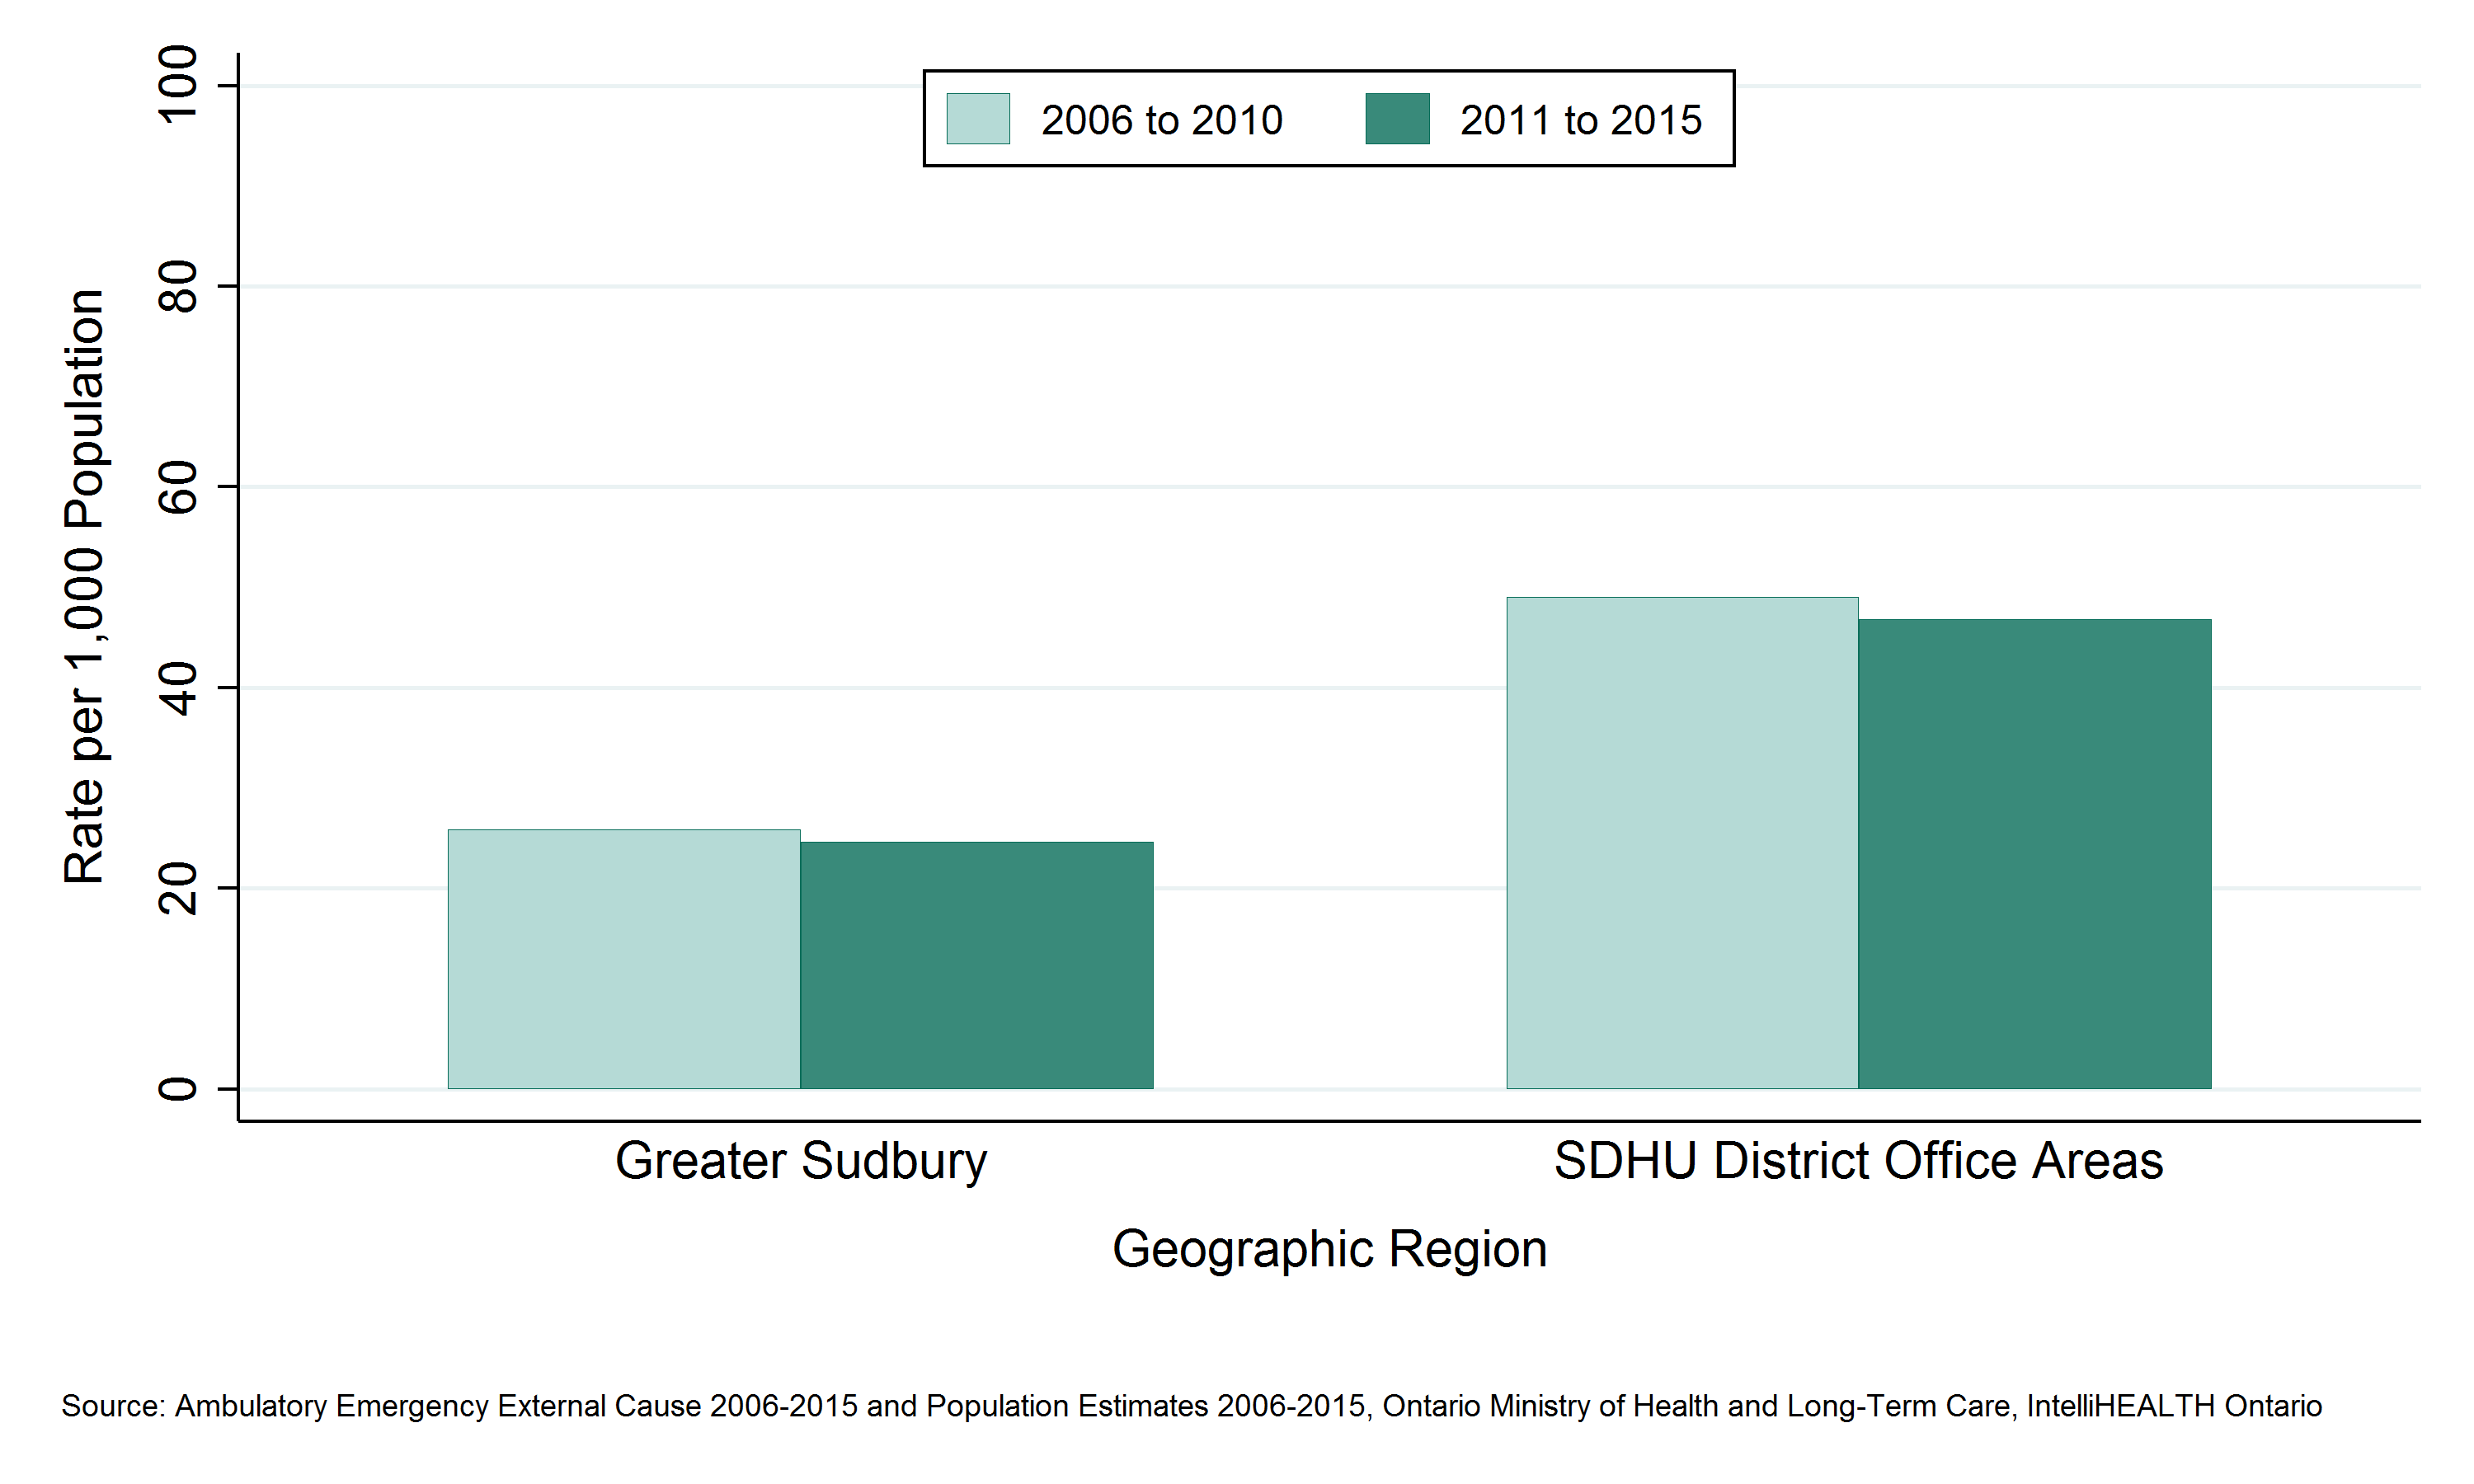
- The rate of ED visits for falls among seniors was 53 per 1,000 population per year in Greater Sudbury and 69 per 1,000 population per year in the SDHU district office areas between 2011 and 2015.
- The rate of ED visits for falls among seniors in Greater Sudbury has been consistently lower than the rate among seniors in the SDHU district office areas.
- The rates of ED visits for falls among seniors in Greater Sudbury and the SDHU district office areas have remained stable between the 2006 to 2010 and 2011 to 2015 periods.
Notes:
- Geographic areas and/or time periods in which there is less access to walk-in clinics and other alternatives to the local ED can be expected to have higher rates of injury-related ED visits than they would otherwise.
- Data Source: Ambulatory Emergency External Cause 2006 to 2015 (extracted June 6, 2016) and Population Estimates 2006 to 2015 (extracted October 7, 2016), Ontario Ministry of Health and Long-Term Care, IntelliHEALTH Ontario.
Figure: Annual rate of emergency department visits, falls, ages 65+, by Greater Sudbury and outlying areas, 2006 to 2010 and 2011 to 2015

Table: Annual rate of emergency department visits, falls, ages 65+, by Greater Sudbury and outlying areas, 2006 to 2010 and 2011 to 2015
| Geographic Region | Rate per 1000 2006 to 2010 | Rate per 1000 2011 to 2015 |
| Greater Sudbury | 25.9 | 24.6 |
| SDHU District Office Areas | 49.0 | 46.8 |
Table: Annual number of emergency department visits, falls, ages 65+, by Greater Sudbury and outlying areas, 2006 to 2010 and 2011 to 2015
| Geographic Region | Total Counts, 2006 to 2010 | Total Counts, 2011 to 2015 | Average Annual Counts, 2006 to 2010 | Average Annual Counts, 2011 to 2015 |
| Greater Sudbury | 18,150 | 16,923 | 3,630.0 | 3,384.6 |
| SDHU District Office Areas | 7,206 | 6,428 | 1,441.2 | 1,285.6 |
Emergency department (ED) visits due to falls among seniors (age 65 and over) by sex
Key Findings:
- Between 2011 and 2015, there were 3,473 emergency department (ED) visits for falls among male seniors, and 6,169 for falls among female seniors in the Sudbury & District Health Unit (SDHU) area, an average of 695 and 1,234 per year, respectively.
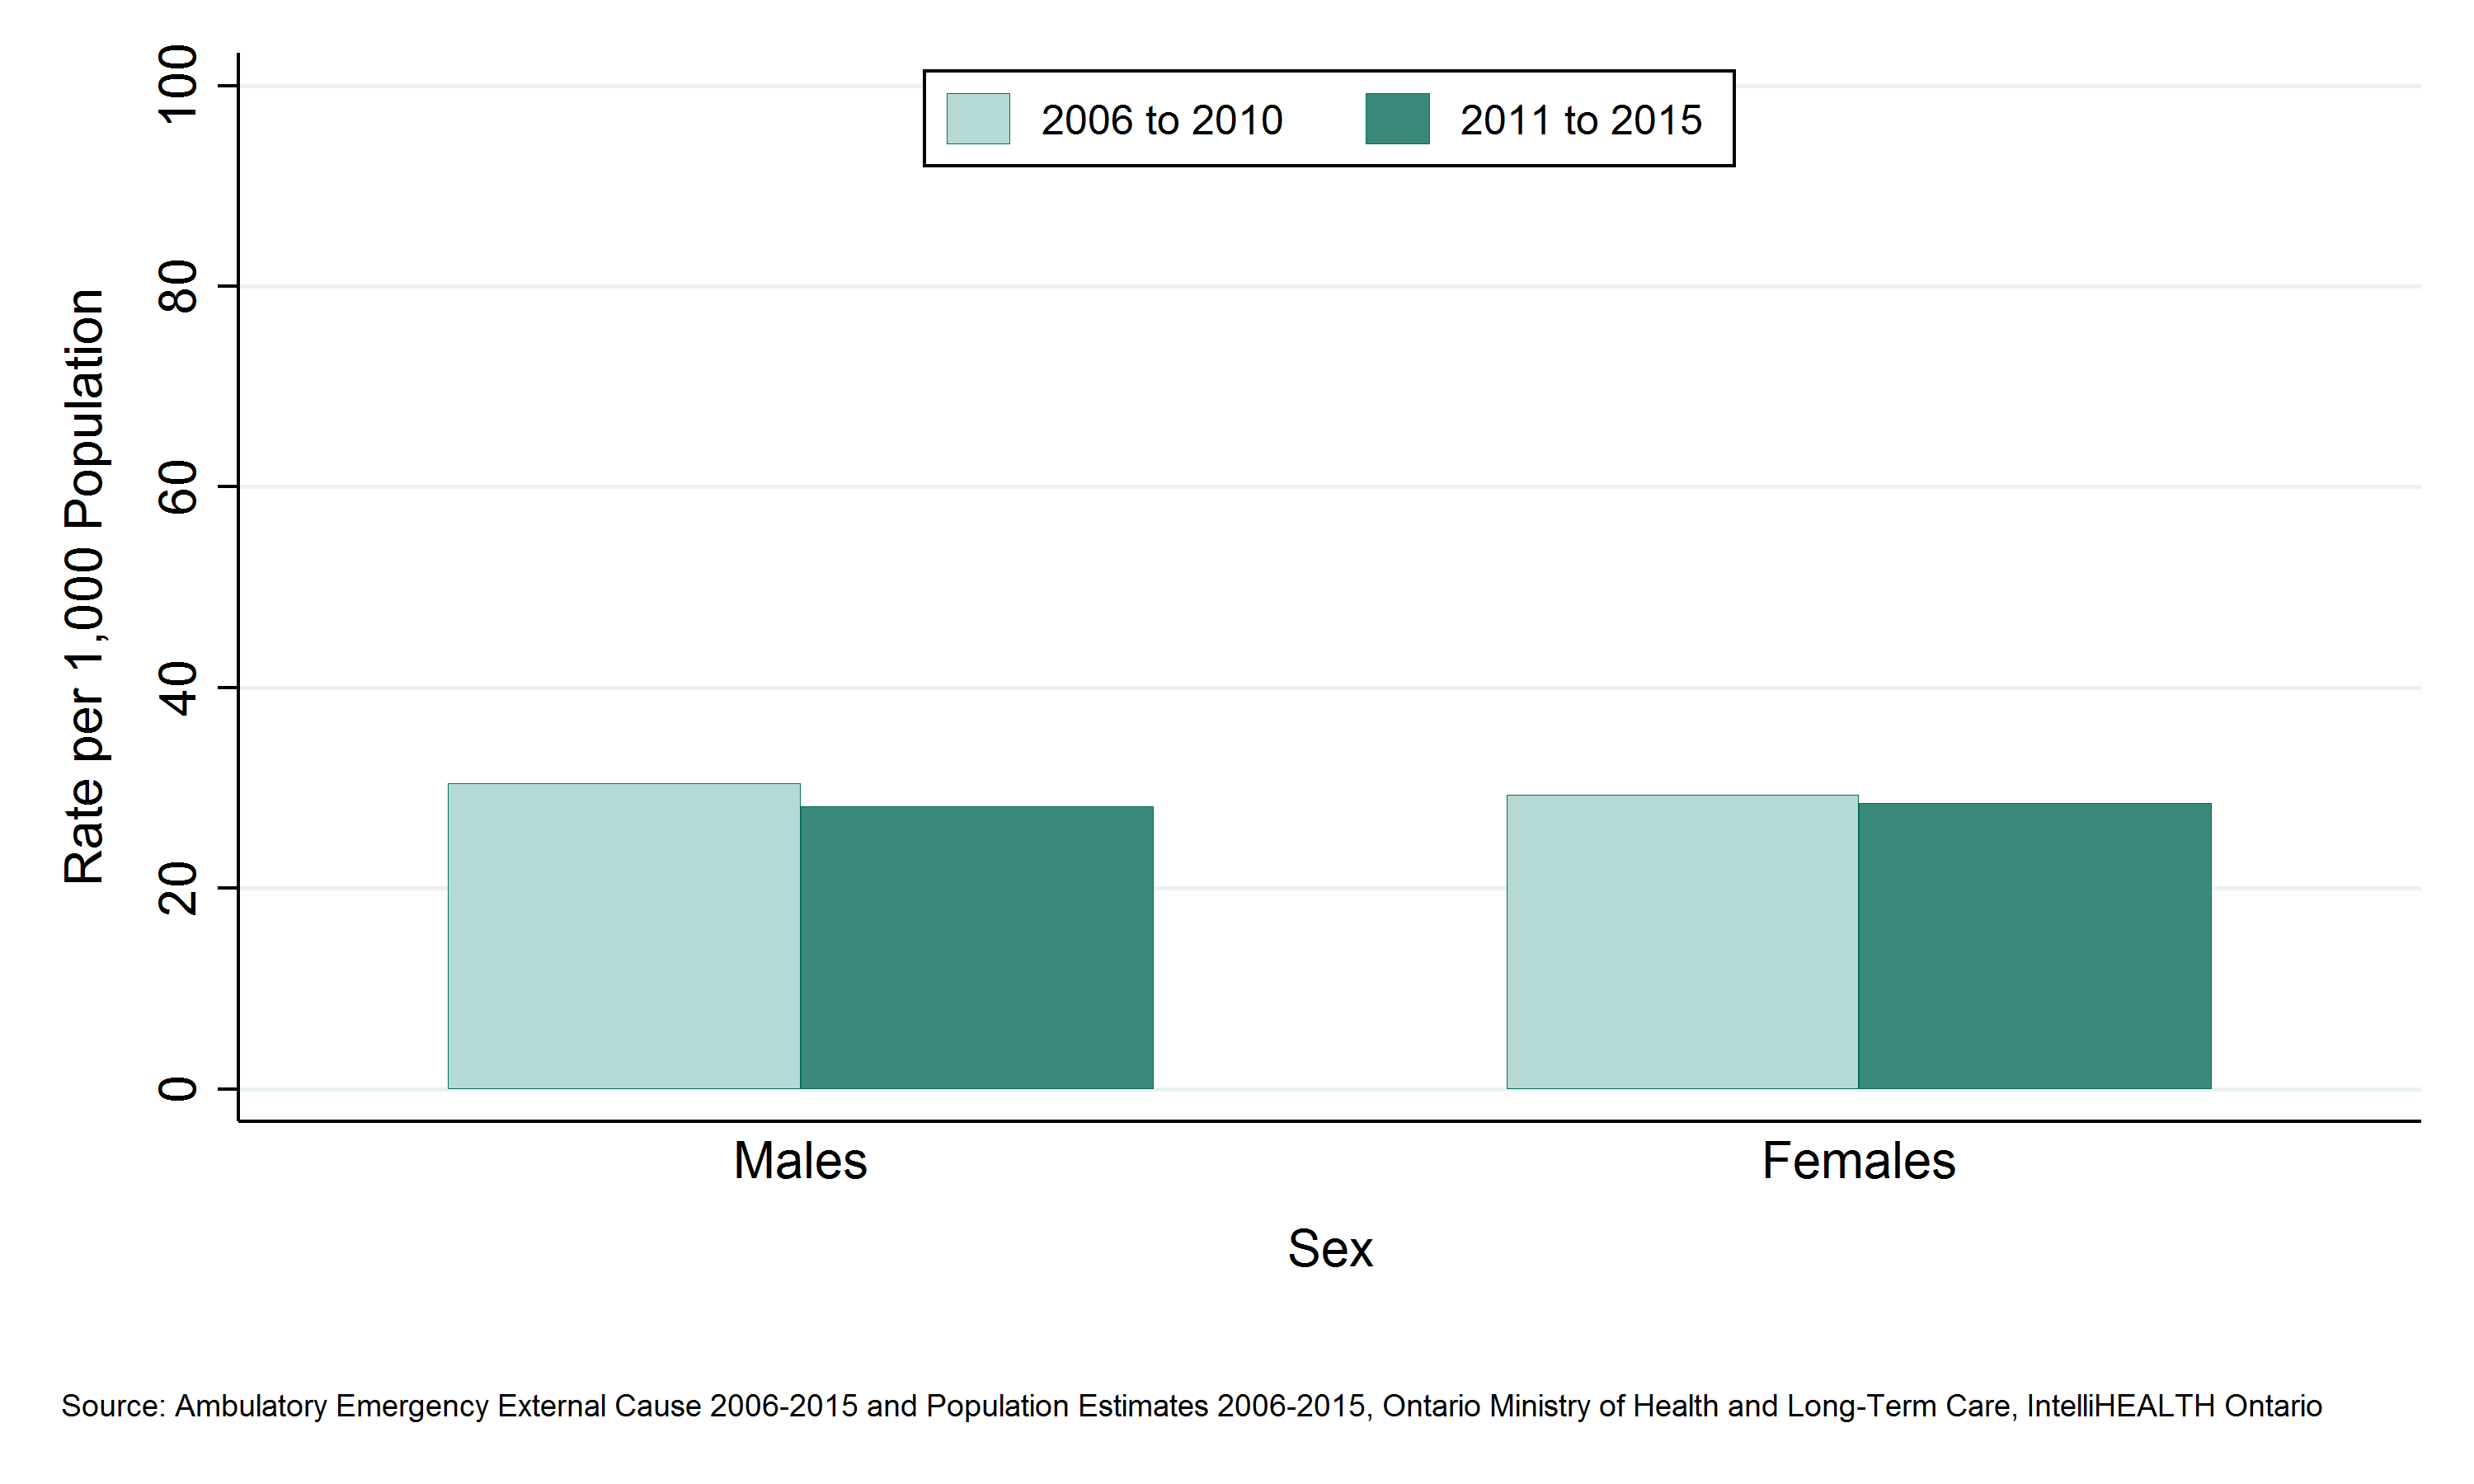
- The rate of ED visits for falls among seniors was 44 per 1,000 males and 66 per 1,000 females in the SDHU area between 2011 and 2015.
- The rate of ED visits for falls among female seniors has been consistently higher than the rate among males.
- Among both males and females in the SDHU area, the rates of ED visits for falls among seniors have remained stable over time between 2006 to 2010 and 2011 to 2015.
Notes:
- Geographic areas and/or time periods in which there is less access to walk-in clinics and other alternatives to the local ED can be expected to have higher rates of injury-related ED visits than they would otherwise.
- Data Source: Ambulatory Emergency External Cause 2006 to 2015 (extracted June 6, 2016) and Population Estimates 2006 to 2015 (extracted October 7, 2016), Ontario Ministry of Health and Long-Term Care, IntelliHEALTH Ontario.
Figure: Annual rate of emergency department visits, falls, ages 65+, by sex, SDHU, 2006 to 2010 and 2011 to 2015
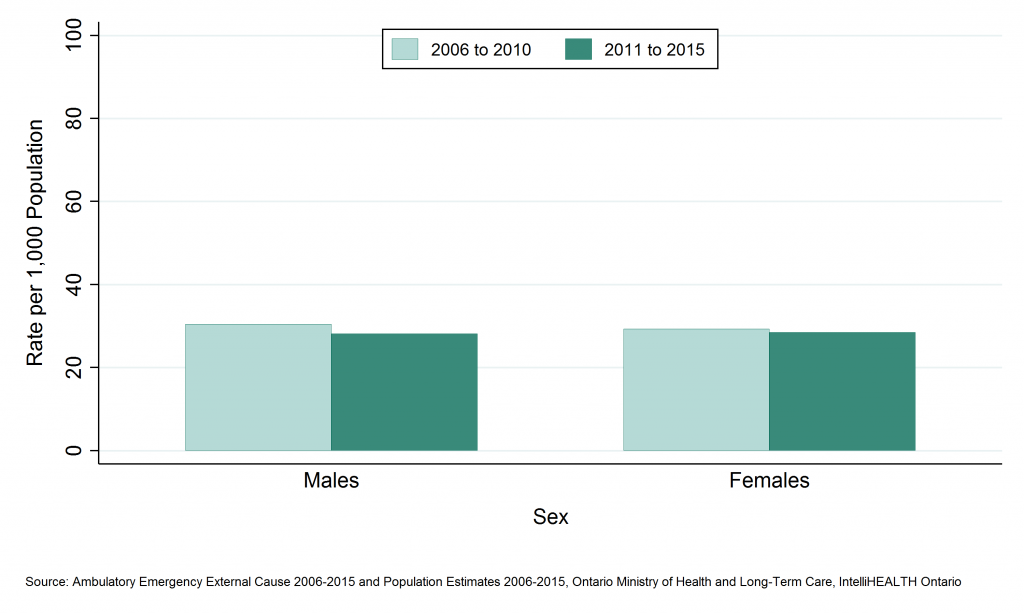
Table: Annual rate of emergency department visits, falls, ages 65+, by sex, SDHU, 2006 to 2010 and 2011 to 2015
| Sex | Rate per 100,000, 2006 to 2010 | Rate per 100,000, 2011 to 2015 |
| Males | 30.5 | 28.2 |
| Females | 29.3 | 28.5 |
Table: Annual number of emergency department visits, falls, ages 65+, by sex, SDHU, 2006 to 2010 and 2011 to 2015
| Sex | Total Counts, 2006 to 2010 | Total Counts, 2011 to 2015 | Average Annual Counts, 2006 to 2010 | Average Annual Counts, 2011 to 2015 |
| Males | 13,027 | 11,695 | 2,605.4 | 2,339.0 |
| Females | 12,329 | 11,655 | 2,465.8 | 2,331.0 |
Emergency department (ED) visits due to falls among seniors (age 65 and over) by age group
Key Findings:
- Among residents of the Sudbury & District Health Unit (SDHU) area, the 80 to 84 age group visited the emergency department (ED) the most for falls among seniors, with 1,790 ED visits between 2011 and 2015, or 358 ED visits per year on average.
- Between 2011 and 2015, the 90 and over age group had the highest ED visits rate for falls among seniors with 174 ED visits per 1,000 population per year.
- Rates of ED visits for falls among seniors increased with age from the 65 to 69 age group to the 90 and over age group.
- In the SDHU area, the ED visits rate for falls among seniors decreased slightly in the 90 and over age group between 2006 to 2010 and 2011 to 2015. Rates for all other age groups have remained stable.
Notes:
- Geographic areas and/or time periods in which there is less access to walk-in clinics and other alternatives to the local ED can be expected to have higher rates of injury-related ED visits than they would otherwise.
- Data Source: Ambulatory Emergency External Cause 2006 to 2015 (extracted June 6, 2016) and Population Estimates 2006 to 2015 (extracted October 7, 2016), Ontario Ministry of Health and Long-Term Care, IntelliHEALTH Ontario.
Figure: Annual rate of emergency department visits, falls, ages 65+, by age group, SDHU, 2006 to 2010 and 2011 to 2015
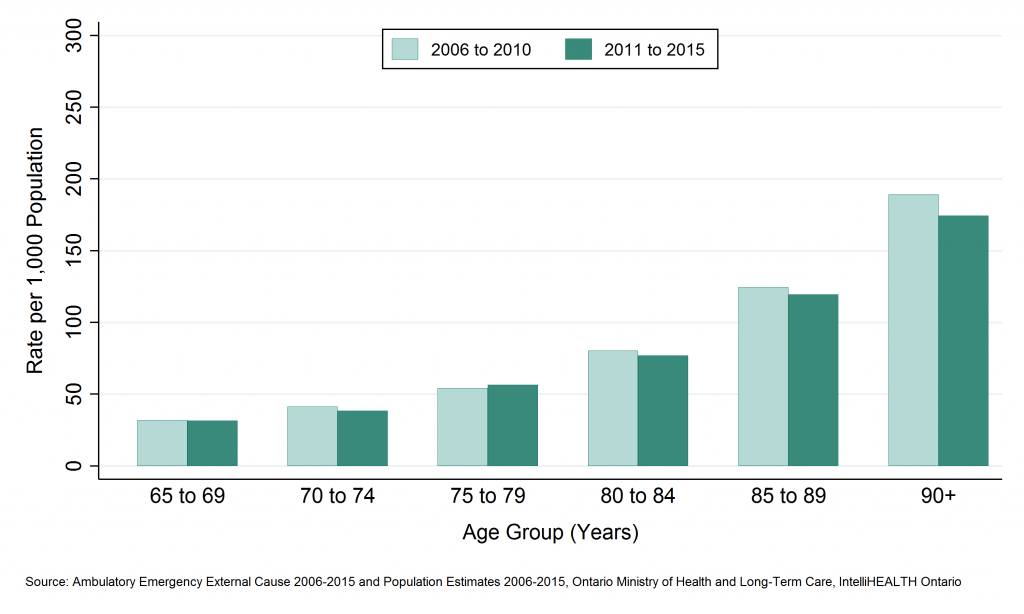
Table: Annual rate of emergency department visits, falls, ages 65+, by age group, SDHU, 2006 to 2010 and 2011 to 2015
| Age Group | Rate per 1000, 2006 to 2010 | Rate per 1000, 2011 to 2015 |
| 65 to 69 | 31.8 | 31.6 |
| 70 to 74 | 41.2 | 38.6 |
| 75 to 79 | 54.0 | 56.6 |
| 80 to 84 | 80.1 | 76.9 |
| 85 to 89 | 124.5 | 119.5 |
| 90+ | 189.1 | 174.4 |
Table: Annual number of emergency department visits, falls, ages 65+, by age group, SDHU, 2006 to 2010 and 2011 to 2015
| Age Group | Total Counts, 2006 to 2010 | Total Counts, 2011 to 2015 | Average Annual Counts, 2006 to 2010 | Average Annual Counts, 2011 to 2015 |
| 65 to 69 | 1,500 | 1,766 | 300.0 | 353.2 |
| 70 to 74 | 1,541 | 1,622 | 308.2 | 324.4 |
| 75 to 79 | 1,674 | 1,763 | 334.8 | 352.6 |
| 80 to 84 | 1,708 | 1,790 | 341.6 | 358.0 |
| 85 to 89 | 1,359 | 1,579 | 271.8 | 315.8 |
| 90+ | 846 | 1,123 | 169.2 | 224.6 |
Deaths due to falls among seniors (age 65 and over) by geographic region
Key Findings:
- There were 135 fall-related deaths among Sudbury & District Health Unit (SDHU) area seniors between 2007 and 2011, and average of 27 per year.
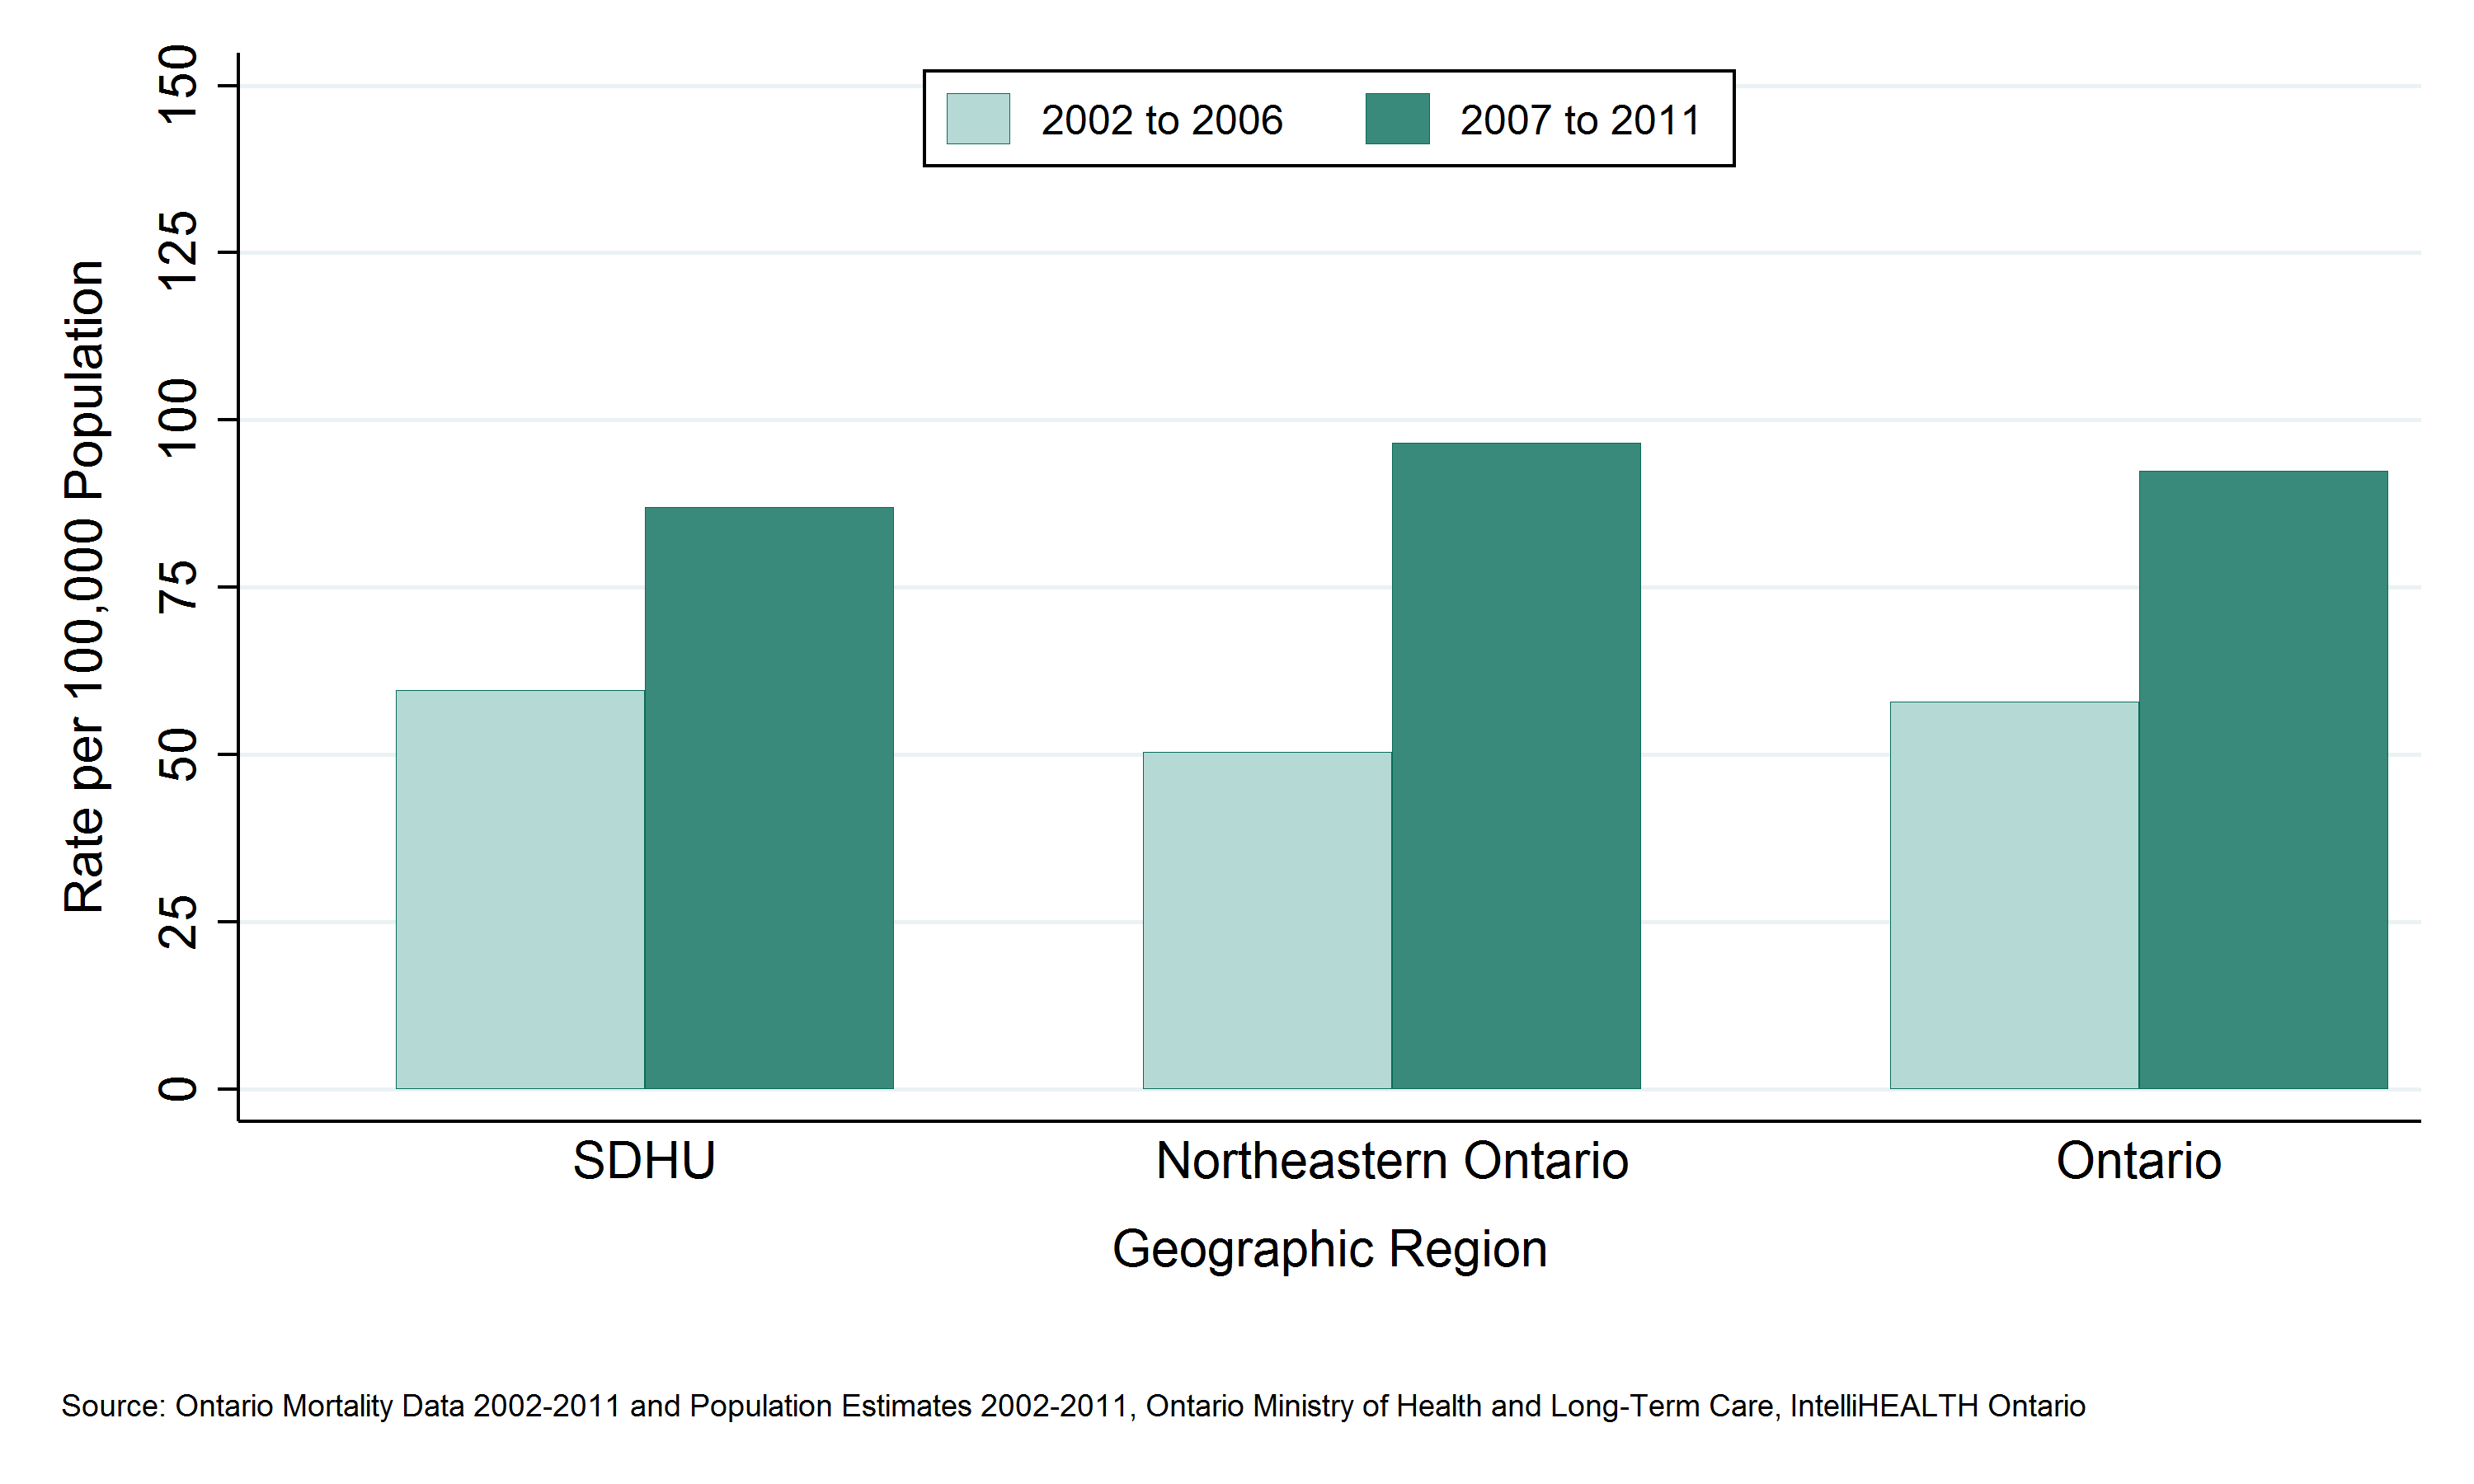
- Between 2006 and 2015, the mortality rate among seniors residing in the SDHU area was 84 deaths per 100,000 seniors per year.
- The mortality rate for falls among seniors in the SDHU area has been similar to the rate in northeastern Ontario and Ontario overall.
- Between 2002 to 2006 and 2007 to 2011, the mortality rate for falls among seniors in the SDHU area increased.
Notes:
- Data Source: Ontario Mortality Data 2002 to 2011 (extracted June 6, 2016) and Population Estimates 2002 to 2011 (extracted October 7, 2016), Ontario Ministry of Health and Long-Term Care, IntelliHEALTH Ontario.
Figure: Annual mortality rate, falls, ages 65+, by geographic region, 2002 to 2006 and 2007 to 2011

Table: Annual mortality rate, falls, ages 65+, by geographic region, 2002 to 2006 and 2007 to 2011
| Geographic Region | Rate per 100,000 2002 to 2006 | Rate per 100,000 2007 to 2011 |
| SDHU | 59.7 | 86.9 |
| Northeast | 50.4 | 96.5 |
| Ontario | 57.8 | 92.4 |
Table: Annual number of deaths, falls, ages 65+, by geographic region, 2002 to 2006 and 2007 to 2011
| Geographic Region | Total Counts 2002 to 2006 | Total Counts 2007 to 2011 | Average Annual Counts, 2002 to 2006 | Average Annual Counts, 2007 to 2011 |
| SDHU | 84 | 135 | 16.8 | 27.0 |
| Northeast | 220 | 464 | 44.0 | 92.8 |
| Ontario | 4,571 | 8,239 | 914.2 | 1,647.8 |
Potential years of life lost (PYLL) due to falls among seniors (age 65 and over) by geographic region
Key Findings:
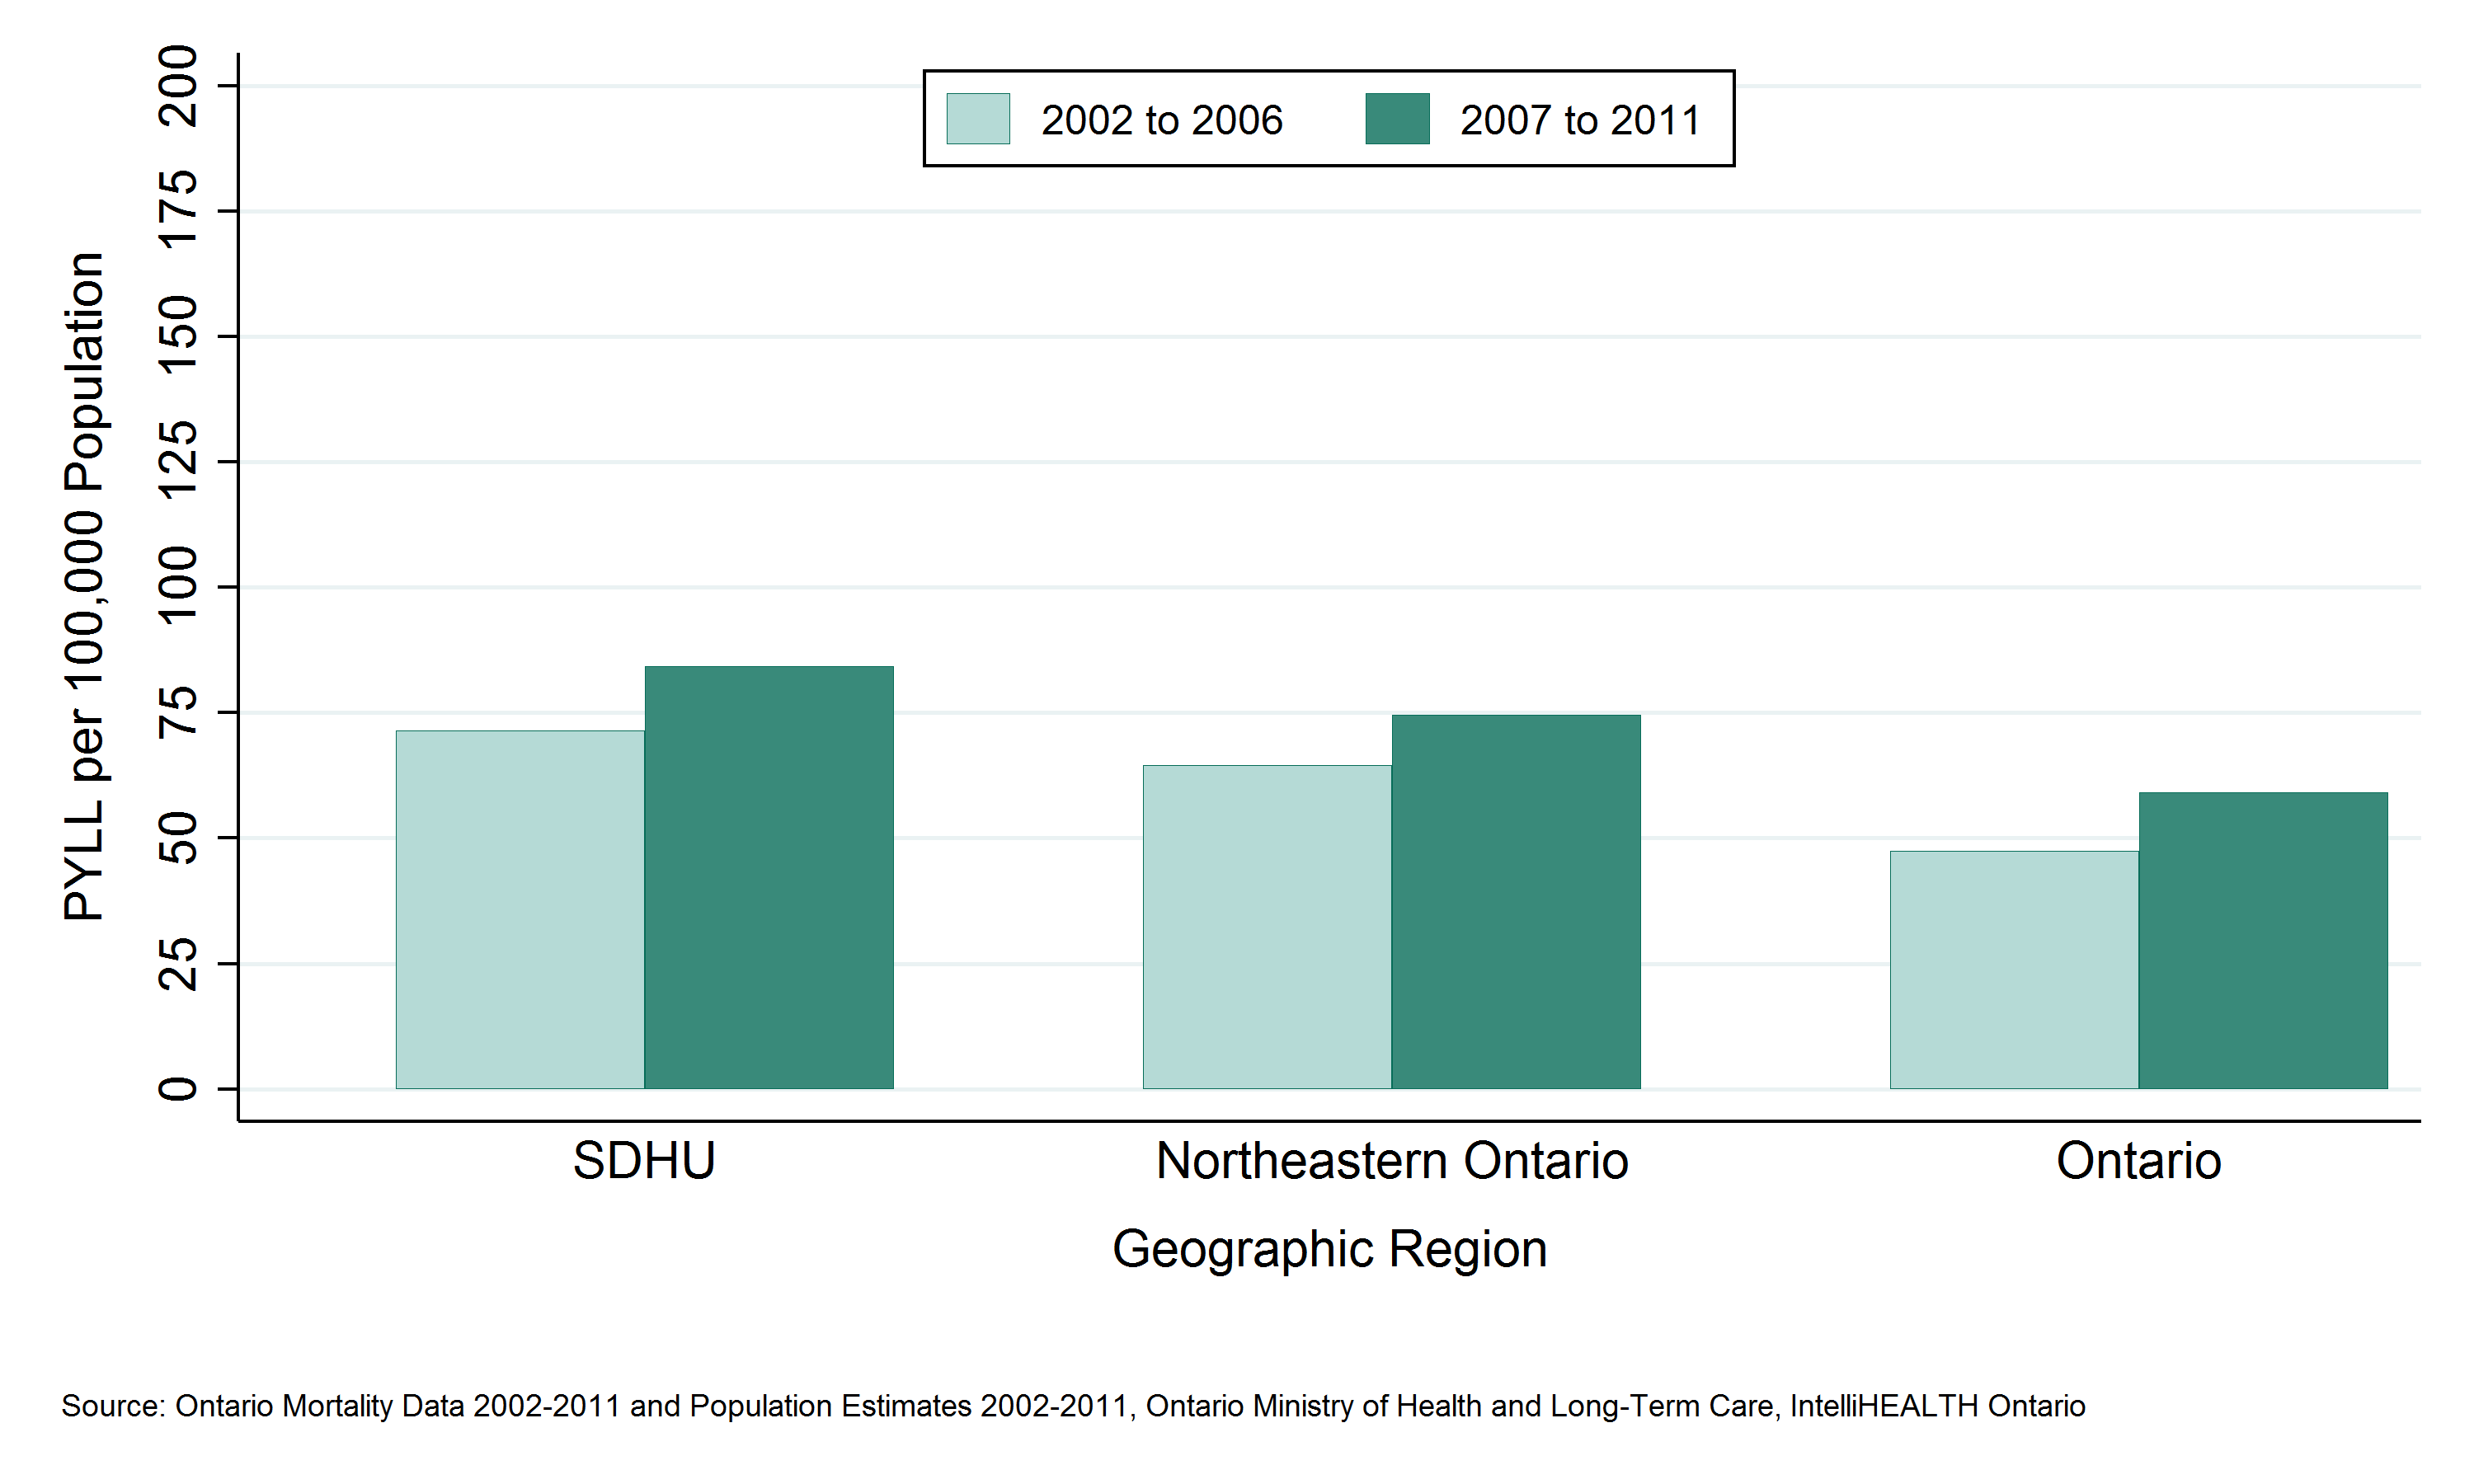
- Between 2006 and 2015, seniors residing in the Sudbury & District Health Unit (SDHU) area lost 99 years of potential life due to deaths from falls before the age of 75, an average of 20 per year.
- The rate of potential years of life lost (PYLL) in the SDHU area due to falls among seniors was 84.9 per 100,000 population per year.
- The rate of PYLL due to falls among seniors in the SDHU area has been slightly higher than the rate in northeastern Ontario, while rates in both areas have generally been higher than the rate in Ontario overall.
- Between 2002 to 2006 and 2007 to 2011, the rate of PYLL due to falls among seniors in the SDHU area increased.
Notes:
- Data Source: Ontario Mortality Data 2002 to 2011 (extracted June 6, 2016) and Population Estimates 2002 to 2011 (extracted October 7, 2016), Ontario Ministry of Health and Long-Term Care, IntelliHEALTH Ontario.
Figure: Annual rate of potential years of life lost (PYLL), falls, ages 65+, by geographic region, 2002 to 2006 and 2007 to 2011

Table: Annual rate of potential years of life lost (PYLL), falls, ages 65+, by geographic region, 2002 to 2006 and 2007 to 2011
| Geographic Region | Rate per 100,000, 2002 to 2006 | Rate per 100,000, 2007 to 2011 |
| SDHU | 71.4 | 84.3 |
| Northeast | 64.6 | 74.6 |
| Ontario | 47.4 | 59.1 |
Table: Annual number of potential years of life lost (PYLL), falls, ages 65+, by geographic region, 2002 to 2006 and 2007 to 2011
| Geographic Region | Total PYLL, 2002 to 2006 | Total PYLL, 2007 to 2011 | Average Annual Counts, 2002 to 2006 | Average Annual Counts, 2007 to 2011 |
| SDHU | 78 | 99 | 15.6 | 19.8 |
| Northeast | 219 | 271 | 43.8 | 54.2 |
| Ontario | 2,798 | 3,834 | 559.6 | 766.8 |
This item was last modified on August 8, 2017