Pedestrian Injuries
Injuries in this section include those to pedestrians injured in collisions with motor vehicles or non-motor vehicles including cyclists, animal riders or animal-drawn vehicles.
Emergency department (ED) visits due to pedestrian injuries by geographic region
Key Findings:
- Among residents of the Sudbury & District Health Unit (SDHU) area, there were 77 emergency department (ED) visits due to pedestrian injuries in 2015.
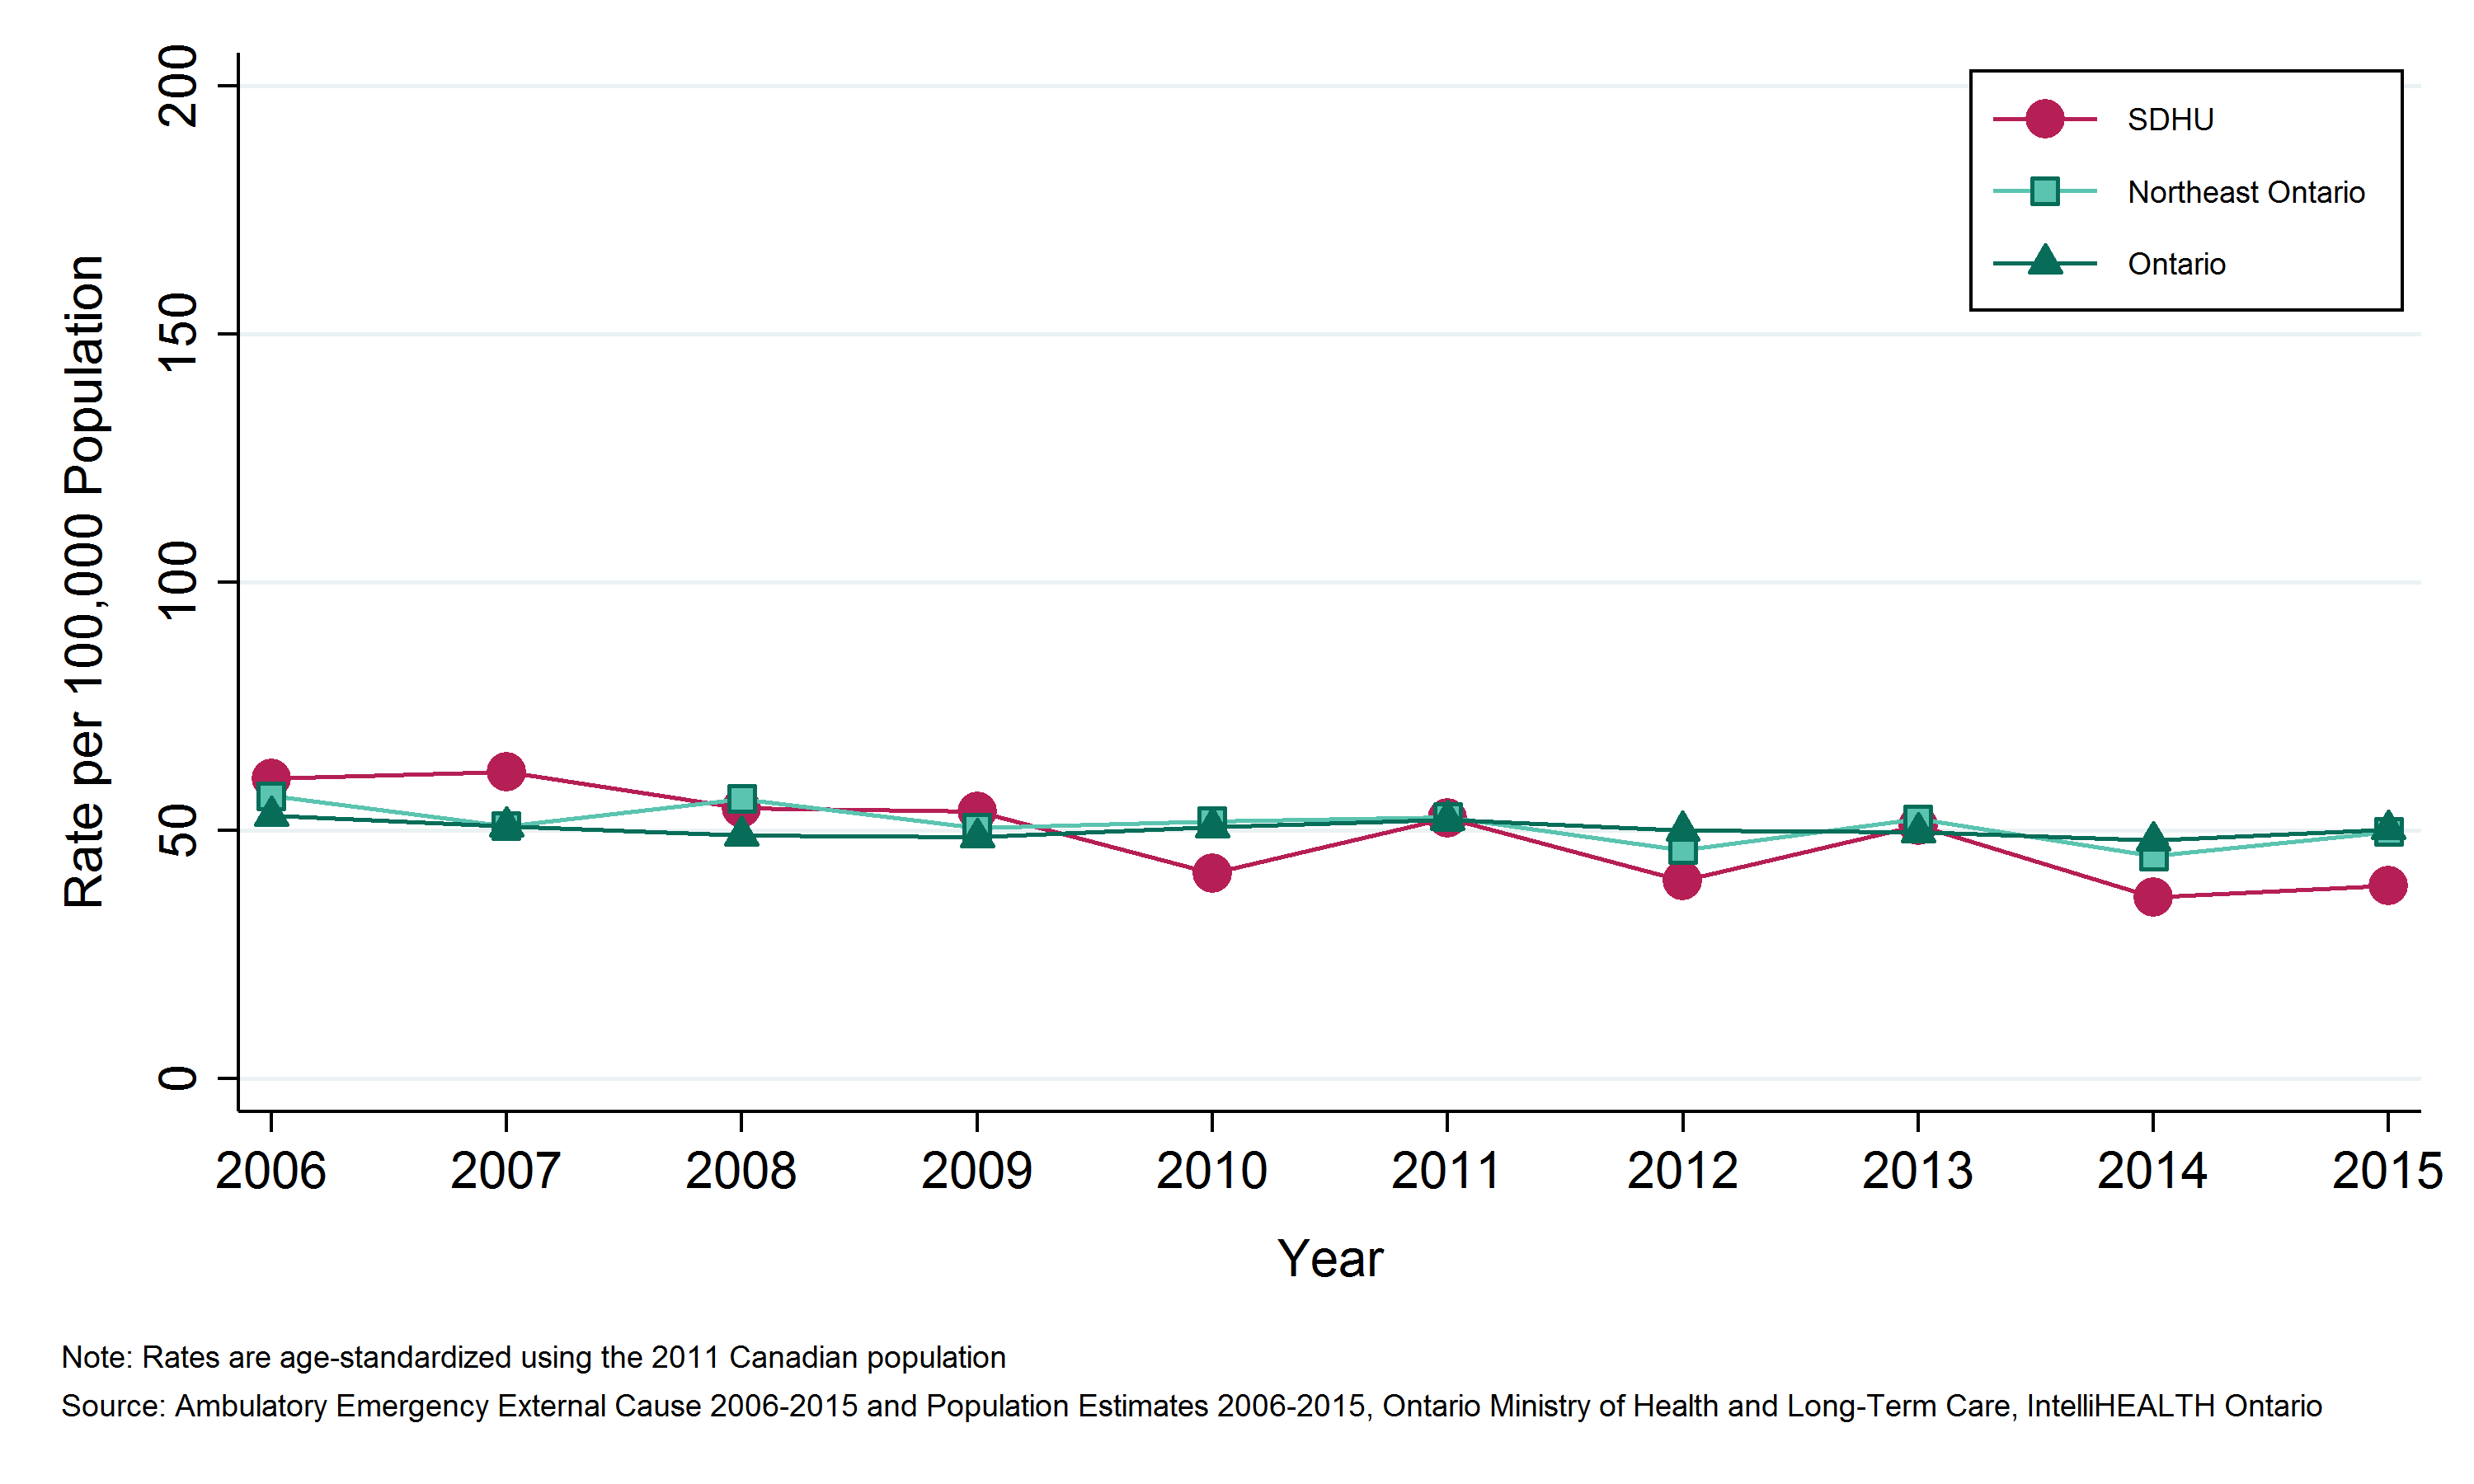
- In 2015, the ED visits rate due to pedestrian injuries in the SDHU area was 39 per 100,000 population per year.
- The rate of ED visits due to pedestrian injuries in the SDHU area has been similar to that of northeastern Ontario and Ontario overall.
- Between 2006 and 2015, the ED visits rate due to pedestrian injuries in the SDHU area decreased.
Notes:
- Geographic areas and/or time periods in which there is less access to walk-in clinics and other alternatives to the local ED can be expected to have higher rates of injury-related ED visits than they would otherwise.
- Rates are age-standardized using the 2011 Canadian population.
- Data Source: Ambulatory Emergency External Cause 2006 to 2015 (extracted June 6, 2016) and Population Estimates 2006 to 2015 (extracted October 7, 2016), Ontario Ministry of Health and Long-Term Care, IntelliHEALTH Ontario.
Figure: Annual age-standardized rate of emergency department visits, pedestrian injuries, by geographic region, 2006 to 2015
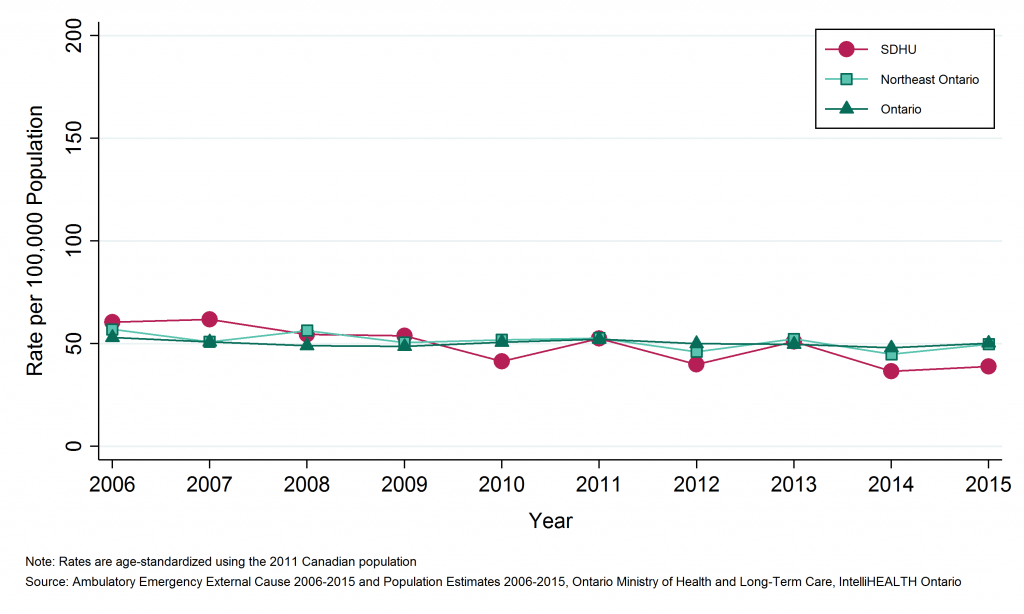
Table: Annual age-standardized rate of emergency department visits, pedestrian injuries, by geographic region, 2006 to 2015
| Geographic Region | 2006 | 2007 | 2008 | 2009 | 2010 | 2011 | 2012 | 2013 | 2014 | 2015 |
| SDHU | 60.5 | 61.7 | 54.4 | 53.9 | 41.3 | 52.6 | 39.9 | 51.0 | 36.6 | 38.9 |
| Northeast | 57.0 | 50.9 | 56.3 | 50.5 | 51.9 | 52.7 | 46.1 | 52.3 | 44.8 | 49.8 |
| Ontario | 53.0 | 50.8 | 49.1 | 48.6 | 50.7 | 52.2 | 50.0 | 49.6 | 48.0 | 50.2 |
Table: Annual number of emergency department visits, pedestrian injuries, by geographic region, 2006 to 2015
| Geographic Region | 2006 | 2007 | 2008 | 2009 | 2010 | 2011 | 2012 | 2013 | 2014 | 2015 |
| SDHU | 122 | 122 | 111 | 108 | 83 | 104 | 80 | 100 | 74 | 77 |
| Northeast | 327 | 288 | 324 | 288 | 297 | 297 | 257 | 290 | 251 | 273 |
| Ontario | 6,759 | 6,554 | 6,379 | 6,357 | 6,708 | 6,977 | 6,757 | 6,768 | 6,609 | 6,971 |
0
Emergency department (ED) visits due to pedestrian injuries by Greater Sudbury and outlying areas
Key Findings:
- Between 2011 and 2015, there were 390 emergency department (ED) visits due to pedestrian injuries among residents of Greater Sudbury and 45 among residents of the SDHU district office areas, an average of 78 and 9 per year, respectively.
- The rate of ED visits due to pedestrian injuries was 47 per 100,000 population per year in Greater Sudbury and 28 per 100,000 population per year in the SDHU district office areas between 2011 and 2015.
- The rate of ED visits due to pedestrian injuries among residents of Greater Sudbury has consistently been higher than that among residents in the SDHU district office areas.
- The rate of ED visits due to pedestrian injuries among residents in both areas decreased between 2006 to 2010 and 2011 to 2015.
Notes:
- Geographic areas and/or time periods in which there is less access to walk-in clinics and other alternatives to the local ED can be expected to have higher rates of injury-related ED visits than they would otherwise.
- Rates are age-standardized using the 2011 Canadian population.
- Data Source: Ambulatory Emergency External Cause 2006 to 2015 (extracted June 6, 2016) and Population Estimates 2006 to 2015 (extracted October 7, 2016), Ontario Ministry of Health and Long-Term Care, IntelliHEALTH Ontario.
Figure: Annual age-standardized rate of emergency department visits, pedestrian injuries, by Greater Sudbury and outlying areas, 2006 to 2010 and 2011 to 2015
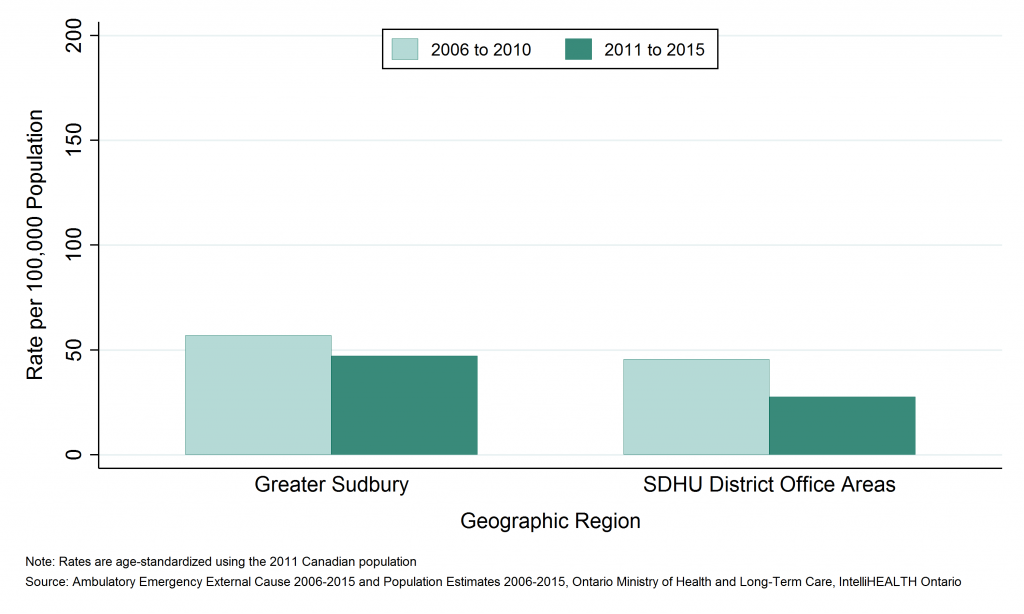
Table: Annual age-standardized rate of emergency department visits, pedestrian injuries, by Greater Sudbury and outlying areas, 2006 to 2010 and 2011 to 2015
| Geographic Region | Rate per 100000 2006 to 2010 | Rate per 100000 2011 to 2015 |
| Greater Sudbury | 56.9 | 47.2 |
| SDHU District Office Areas | 45.6 | 27.6 |
Table: Annual number of emergency department visits, pedestrian injuries, by Greater Sudbury and outlying areas, 2006 to 2010 and 2011 to 2015
| Geographic Region | Total Counts, 2006 to 2010 | Total Counts, 2011 to 2015 | Average Annual Counts, 2006 to 2010 | Average Annual Counts, 2011 to 2015 |
| Greater Sudbury | 474 | 390 | 94.8 | 78.0 |
| SDHU District Office Areas | 72 | 45 | 14.4 | 9.0 |
Emergency department (ED) visits due to pedestrian injuries by sex
Key Findings:
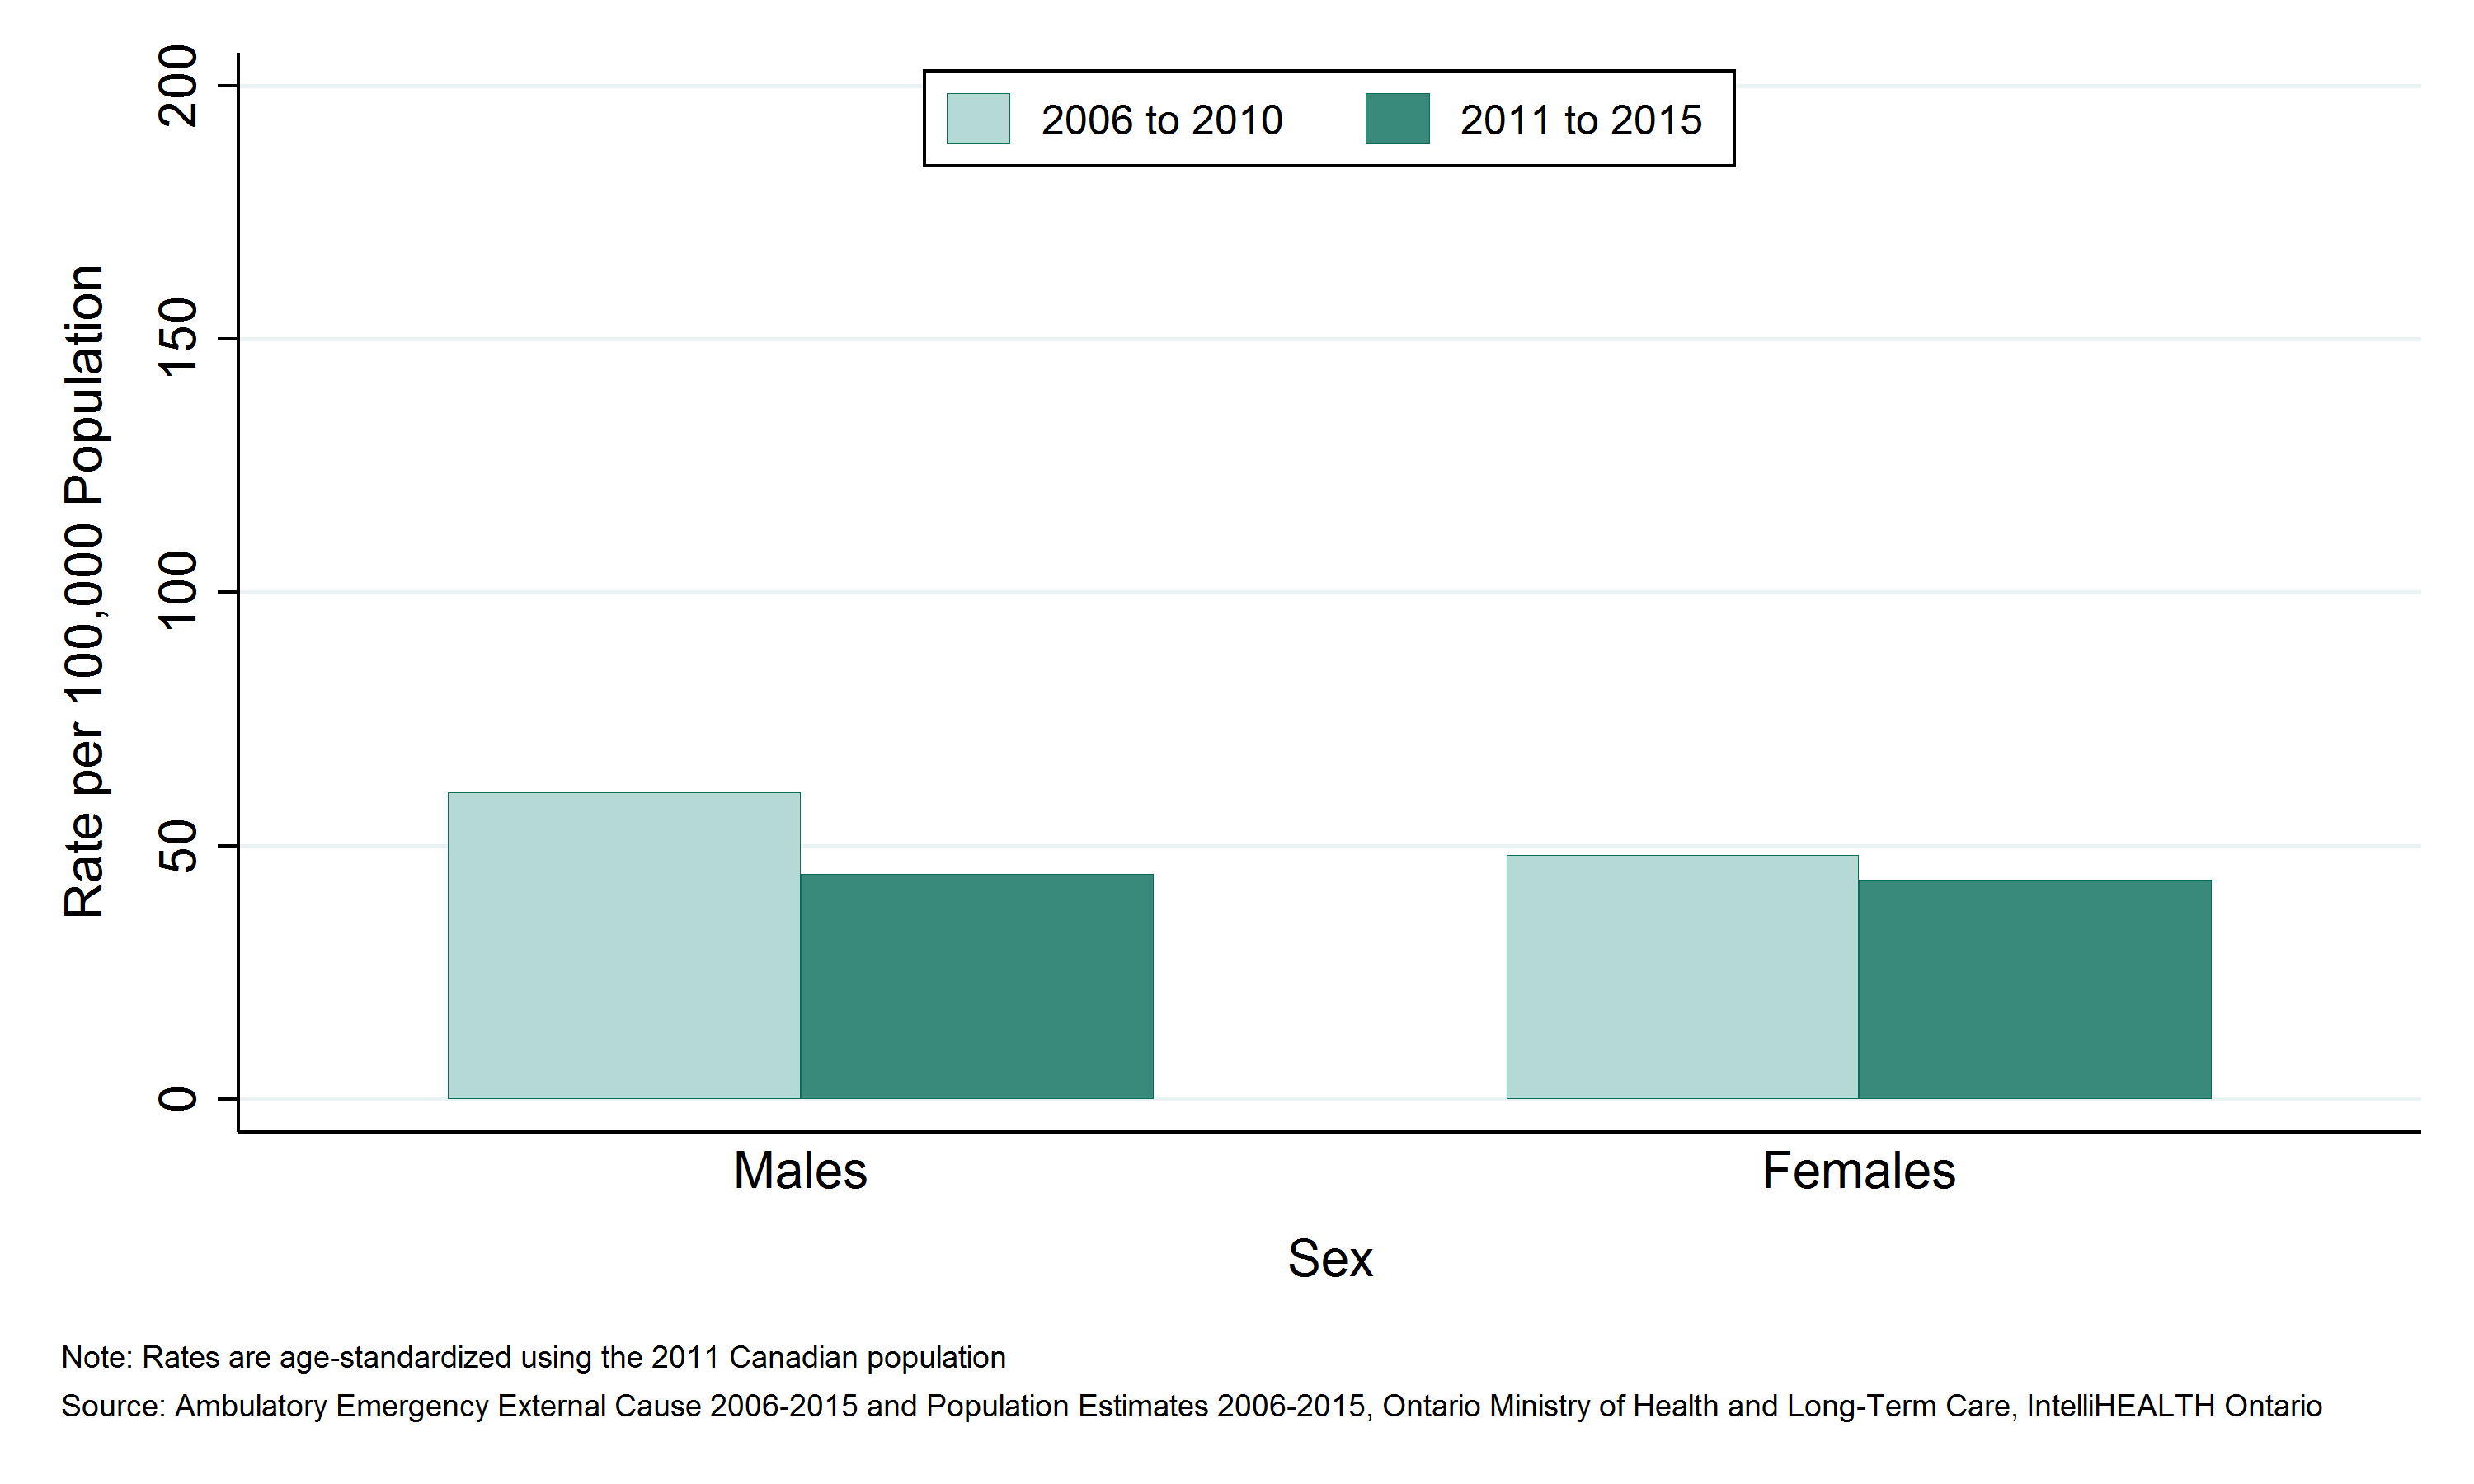
- Between 2011 and 2015, there were 218 emergency department (ED) visits due to pedestrian injuries among males, and 217 among females in the Sudbury & District Health Unit (SDHU) area, an average of 44 and 43 per year, respectively.
- The rate of ED visits due to pedestrian injuries was 44 per 100,000 males per year and 43 per 100,000 females per year in the SDHU area during 2011−2015.
- In 2011 to 2016, there was no difference in the rate of ED visits due to pedestrian injuries between the sexes. In 2006 to 2010, the rate among males was higher than that among females.
- Among both males and females in the SDHU area, the rate of ED visits due to pedestrian injuries decreased over time between 2006 to 2010 and 2011 to 2015. The decrease among males was larger.
Notes:
- Geographic areas and/or time periods in which there is less access to walk-in clinics and other alternatives to the local ED can be expected to have higher rates of injury-related ED visits than they would otherwise.
- Rates are age-standardized using the 2011 Canadian population.
- Data Source: Ambulatory Emergency External Cause 2006 to 2015 (extracted June 6, 2016) and Population Estimates 2006 to 2015 (extracted October 7, 2016), Ontario Ministry of Health and Long-Term Care, IntelliHEALTH Ontario.
Figure: Annual age-standardized rate of emergency department visits, pedestrian injuries, by sex, SDHU, 2006 to 2010 and 2011 to 2015

Table: Annual age-standardized rate of emergency department visits, pedestrian injuries, by sex, SDHU, 2006 to 2010 and 2011 to 2015
| Sex | Rate per 100,000, 2006 to 2010 | Rate per 100,000, 2011 to 2015 |
| Males | 60.5 | 44.5 |
| Females | 48.2 | 43.3 |
Table: Annual number of emergency department visits, pedestrian injuries, by sex, SDHU, 2006 to 2010 and 2011 to 2015
| Sex | Total Counts, 2006 to 2010 | Total Counts, 2011 to 2015 | Average Annual Counts, 2006 to 2010 | Average Annual Counts, 2011 to 2015 |
| Males | 302 | 218 | 60.4 | 43.6 |
| Females | 244 | 217 | 48.8 | 43.4 |
Emergency department (ED) visits due to pedestrian injuries by age group
Key Findings:
- Among residents of the Sudbury & District Health Unit (SDHU) area, the 15 to 24 age group visited the emergency department (ED) due to pedestrian injuries the most, with 127 ED visits between 2011 and 2015, or 25 ED visits per year on average.
- Between 2011 and 2015, the 15 to 24 age group had the highest ED visits rate due to pedestrian injuries with 99 ED visits per 100,000 population per year.
- Rates of ED visits due to pedestrian injuries increase through childhood, peaking in the 15 to 24 year age group, and then decrease with age. Between 2011 and 2015, rates among adults aged 75 years and older were higher than those among adults aged 45 to 74.
- In the SDHU area, the ED visits rate due to pedestrian injuries decreased among most age groups between 2006 to 2010 and 2011 to 2015. The exceptions were ages 25 to 44 and 75 to 84, whose rates remained stable, and ages 85+, in which rates increased.
Notes:
- Geographic areas and/or time periods in which there is less access to walk-in clinics and other alternatives to the local ED can be expected to have higher rates of injury-related ED visits than they would otherwise.
- Data Source: Ambulatory Emergency External Cause 2006 to 2015 (extracted June 6, 2016) and Population Estimates 2006 to 2015 (extracted October 7, 2016), Ontario Ministry of Health and Long-Term Care, IntelliHEALTH Ontario.
Figure: Annual rate of emergency department visits, pedestrian injuries, by age group, SDHU, 2006 to 2010 and 2011 to 2015
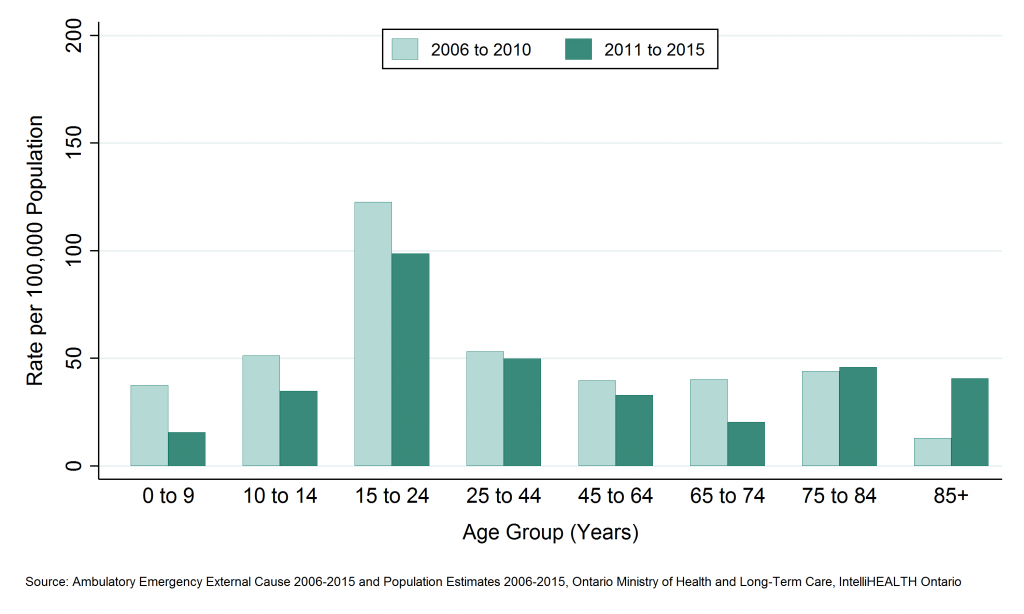
Table: Annual rate of emergency department visits, pedestrian injuries, by age group, SDHU, 2006 to 2010 and 2011 to 2015
| Age Group | Rate per 100000, 2006 to 2010 | Rate per 100000, 2011 to 2015 |
| 0 to 9 | 37.5 | 15.6 |
| 10 to 14 | 51.3 | 34.9 |
| 15 to 24 | 122.6 | 98.6 |
| 25 to 44 | 53.2 | 49.9 |
| 45 to 64 | 39.7 | 32.9 |
| 65 to 74 | 40.2 | 20.4 |
| 75 to 84 | 44.0 | 45.9 |
| 85+ | 13.0 | 40.7 |
Table: Annual number of emergency department visits, pedestrian injuries, by age group, SDHU, 2006 to 2010 and 2011 to 2015
| Age Group | Total Counts, 2006 to 2010 | Total Counts, 2011 to 2015 | Average Annual Counts, 2006 to 2010 | Average Annual Counts, 2011 to 2015 |
| 0 to 9 | 37 | 15 | 7.4 | 3.0 |
| 10 to 14 | 31 | 18 | 6.2 | 3.6 |
| 15 to 24 | 163 | 127 | 32.6 | 25.4 |
| 25 to 44 | 138 | 122 | 27.6 | 24.4 |
| 45 to 64 | 118 | 100 | 23.6 | 20.0 |
| 65 to 74 | 34 | 20 | 6.8 | 4.0 |
| 75 to 84 | 23 | 25 | 4.6 | 5.0 |
| 85+ | 2 | 8 | 0.4 | 1.6 |
Deaths due to pedestrian injuries by geographic region
Key Findings:
- Among residents of the Sudbury & District Health Unit (SDHU) area, there were 12 pedestrian deaths due between 2007 and 2011, an average of 2 per year.
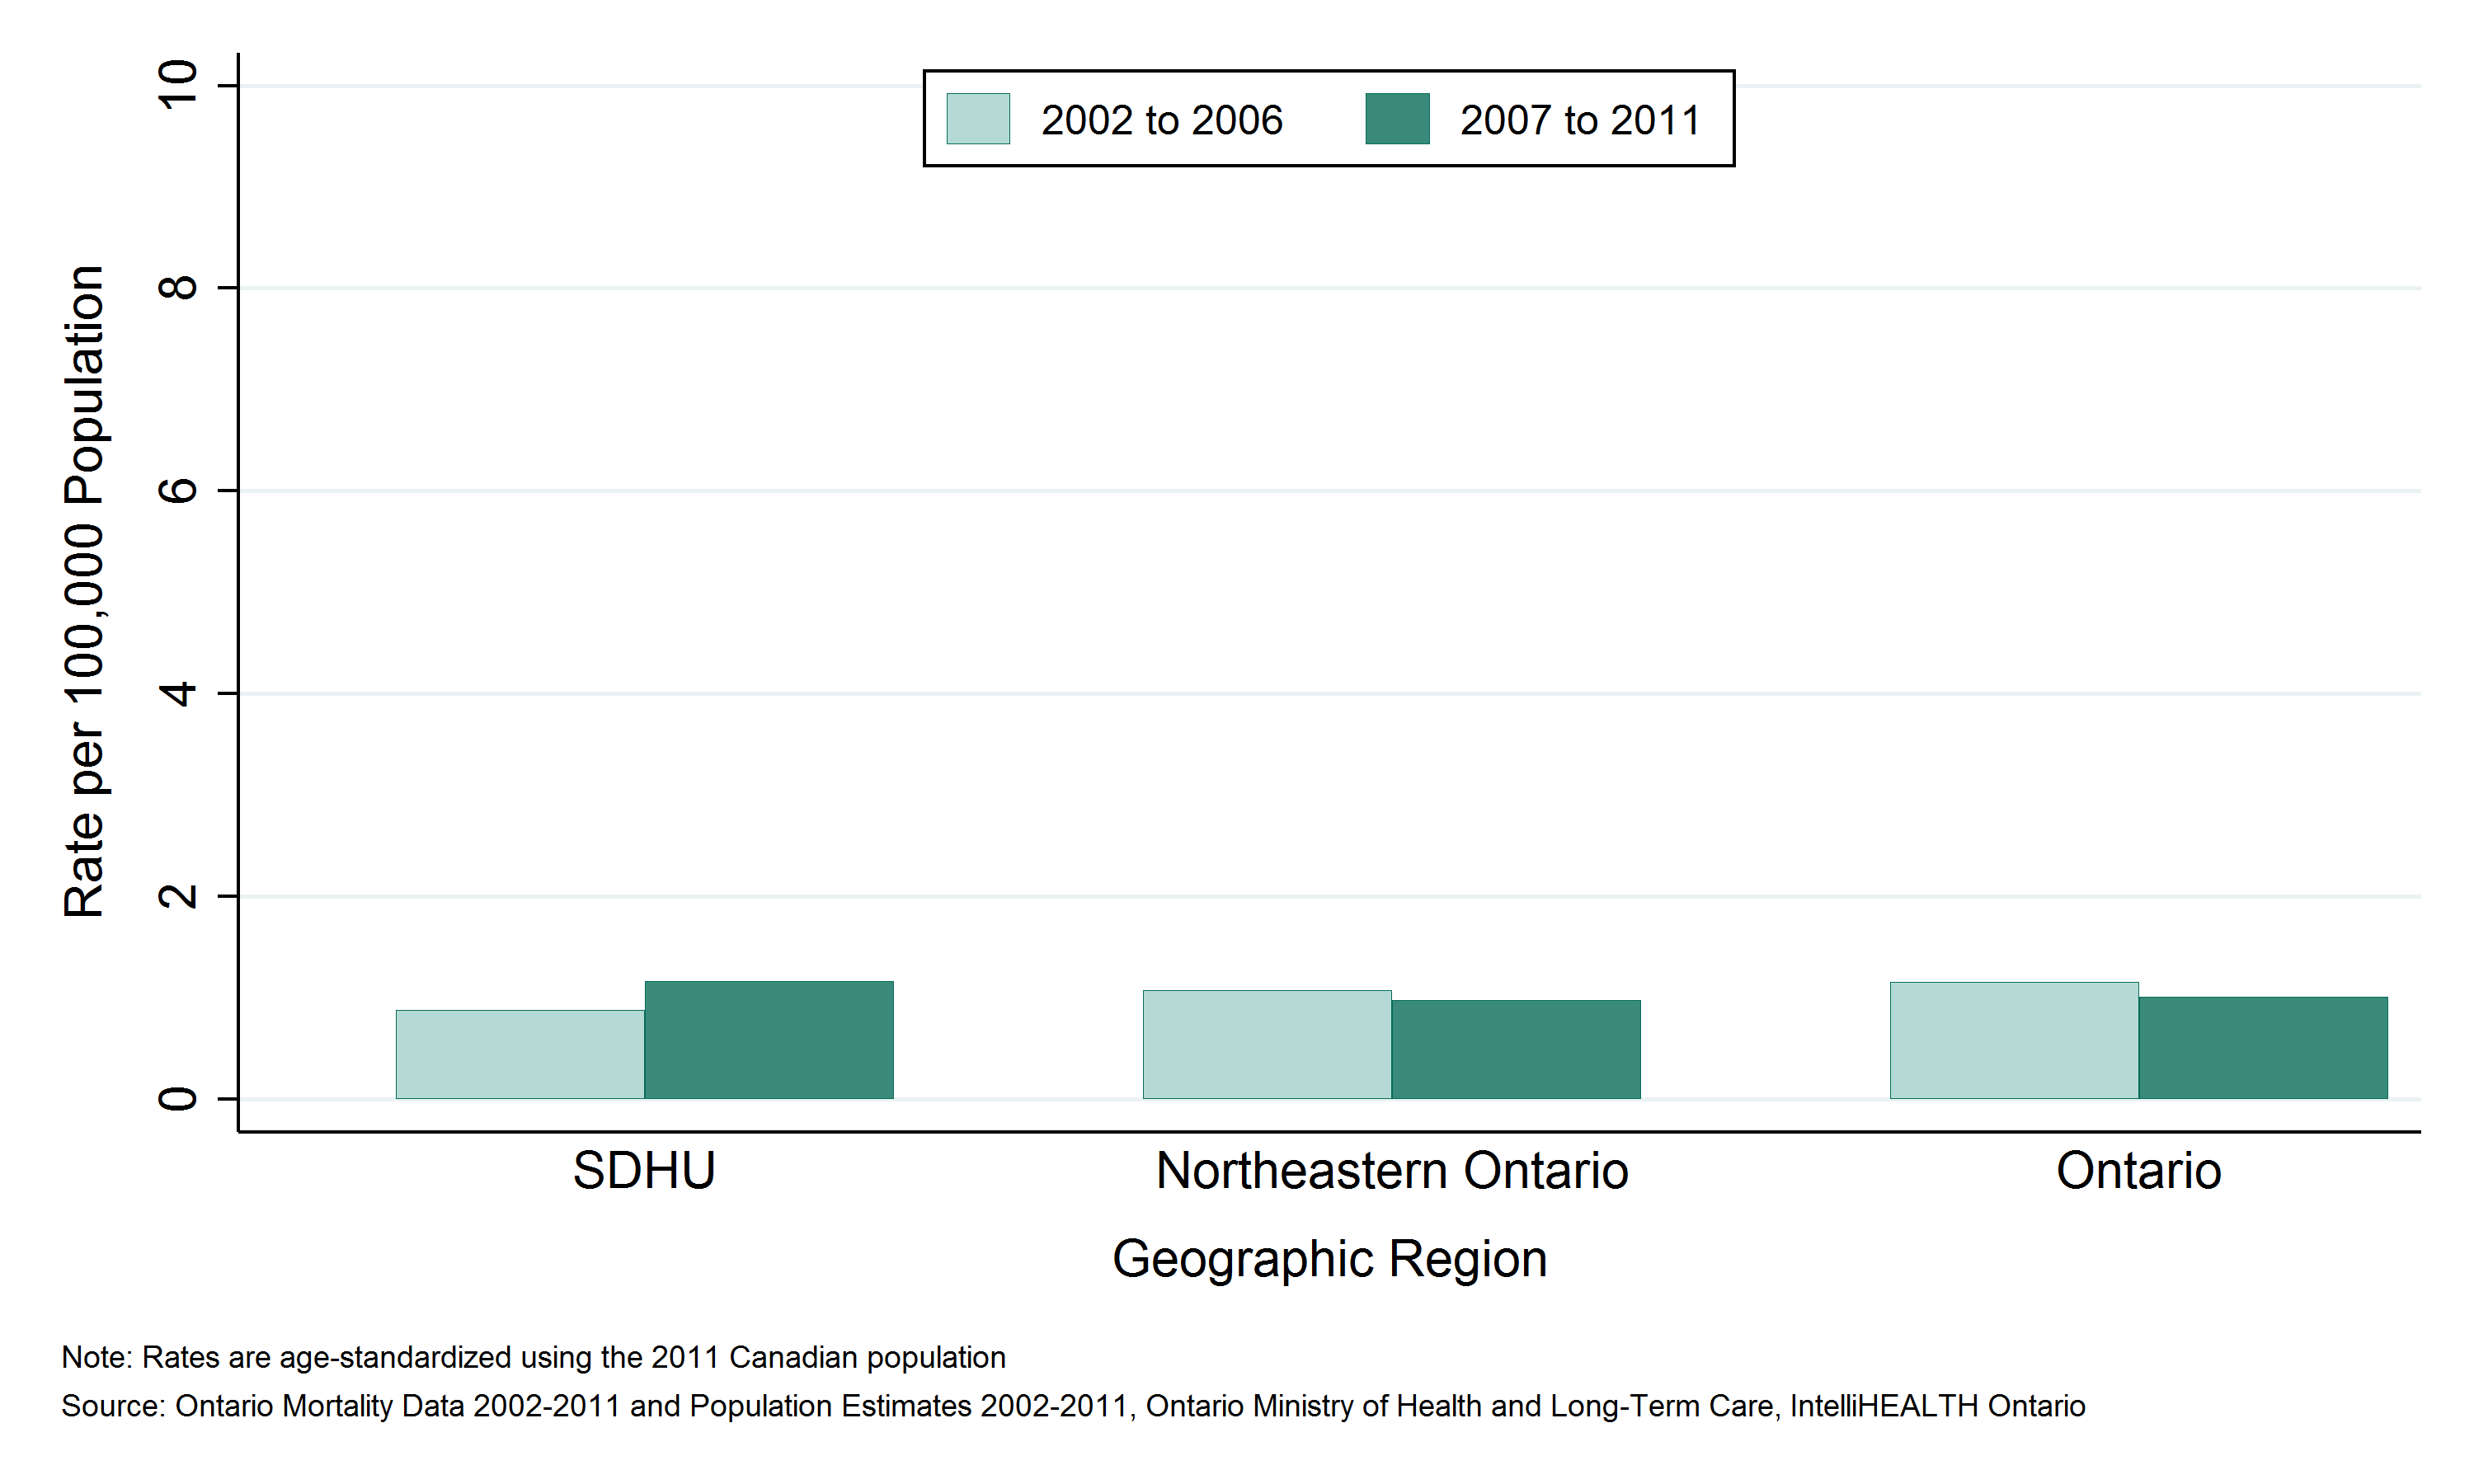
- Between 2006 and 2015, the mortality rate due to pedestrian injuries in the SDHU area was 1 death per 100,000 population per year.
- The mortality rates due to pedestrian injuries in the SDHU area, northeastern Ontario, and Ontario overall have been similar.
- Between 2002 to 2006 and 2007 to 2011, the mortality rate due to pedestrian injuries in the SDHU area remained stable.
Notes:
- Rates are age-standardized using the 2011 Canadian population.
- Data Source: Ontario Mortality Data 2002 to 2011 (extracted June 6, 2016) and Population Estimates 2006 to 2015 (extracted October 7, 2016), Ontario Ministry of Health and Long-Term Care, IntelliHEALTH Ontario.
Figure: Annual age-standardized mortality rate, pedestrian injuries, by geographic region, 2002 to 2006 and 2007 to 2011

Table: Annual age-standardized mortality rate, pedestrian injuries, by geographic region, 2002 to 2006 and 2007 to 2011
| Geographic Region | Rate per 100,000 2002 to 2006 | Rate per 100,000 2007 to 2011 |
| SDHU | 0.9 | 1.2 |
| Northeast | 1.1 | 1.0 |
| Ontario | 1.2 | 1.0 |
Table: Annual number of deaths, pedestrian injuries, by geographic region, 2002 to 2006 and 2007 to 2011
| Geographic Region | Total Counts 2002 to 2006 | Total Counts 2007 to 2011 | Average Annual Counts, 2002 to 2006 | Average Annual Counts, 2007 to 2011 |
| SDHU | 8 | 12 | 1.6 | 2.4 |
| Northeast | 29 | 29 | 5.8 | 5.8 |
| Ontario | 679 | 641 | 135.8 | 128.2 |
Potential years of life lost (PYLL) due to pedestrian injuries by geographic region
Key Findings:
- Between 2006 and 2015, Sudbury & District Health Unit (SDHU) area residents lost 238 years of potential life due to deaths from pedestrian injuries before the age of 75, an average of 48 per year.
- The rate of potential years of life lost (PYLL) in the SDHU area due to pedestrian injuries was 24 PYLL per 100,000 population per year between 2007 and 2011.
- The rate of PYLL due to pedestrian injuries in the SDHU area was similar to that of northeastern Ontario and Ontario overall.
- Between 2002 to 2006 and 2007 to 2011, the rate of PYLL due to pedestrian injuries in the SDHU area was stable.
Notes:
- Rates are age-standardized using the 2011 Canadian population.
- Data Source: Ontario Mortality Data 2002 to 2011 (extracted June 6, 2016) and Population Estimates 2006 to 2015 (extracted October 7, 2016), Ontario Ministry of Health and Long-Term Care, IntelliHEALTH Ontario.
Figure: Annual age-standardized rate of potential years of life lost (PYLL), pedestrian injuries, by geographic region, 2002 to 2006 and 2007 to 2011
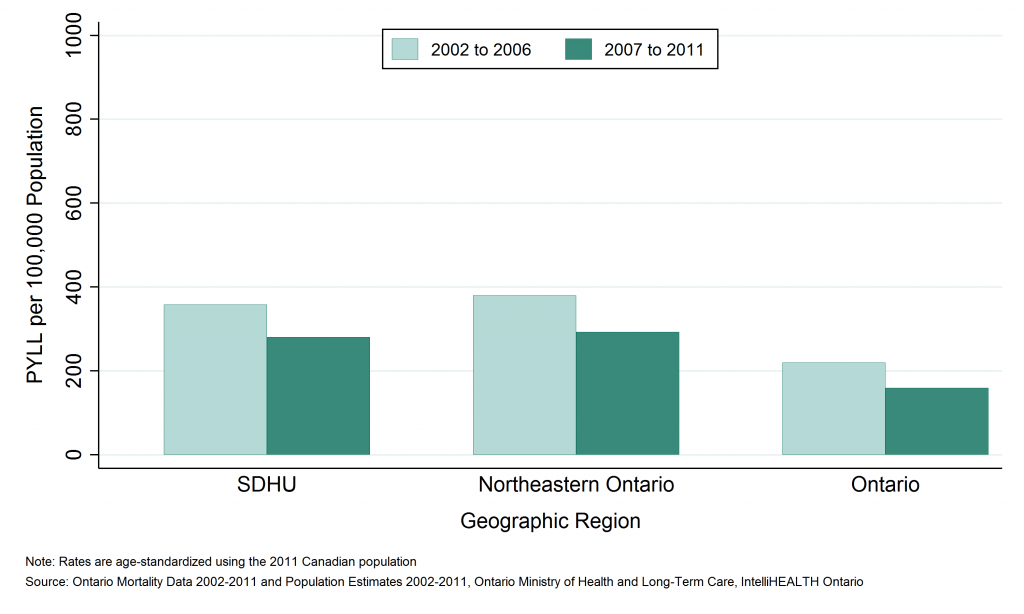
Table: Annual age-standardized rate of potential years of life lost (PYLL), pedestrian injuries, by geographic region, 2002 to 2006 and 2007 to 2011
| Geographic Region | Rate per 100,000, 2002 to 2006 | Rate per 100,000, 2007 to 2011 |
| SDHU | 20.7 | 23.9 |
| Northeast | 38.6 | 27.9 |
| Ontario | 29.8 | 25.8 |
Table: Annual number of potential years of life lost (PYLL), pedestrian injuries, by geographic region, 2002 to 2006 and 2007 to 2011
| Geographic Region | Total PYLL, 2002 to 2006 | Total PYLL, 2007 to 2011 | Average Annual Counts, 2002 to 2006 | Average Annual Counts, 2007 to 2011 |
| SDHU | 189 | 238 | 37.8 | 47.6 |
| Northeast | 1,039 | 773 | 207.8 | 154.6 |
| Ontario | 18,274 | 16,447 | 3,654.8 | 3,289.4 |
This item was last modified on July 25, 2017