Drowning & Submersion
Injuries in this section include those due to accidental drowning and submersion only. Injuries due to assault, intentional self-harm and transport accidents are excluded.
Emergency department (ED) visits due to drowning and submersion by geographic region
Key Findings:
- Among residents of the Sudbury & District Health Unit (SDHU) area, there were 3 emergency department (ED) visits due to drowning and submersion in 2015.
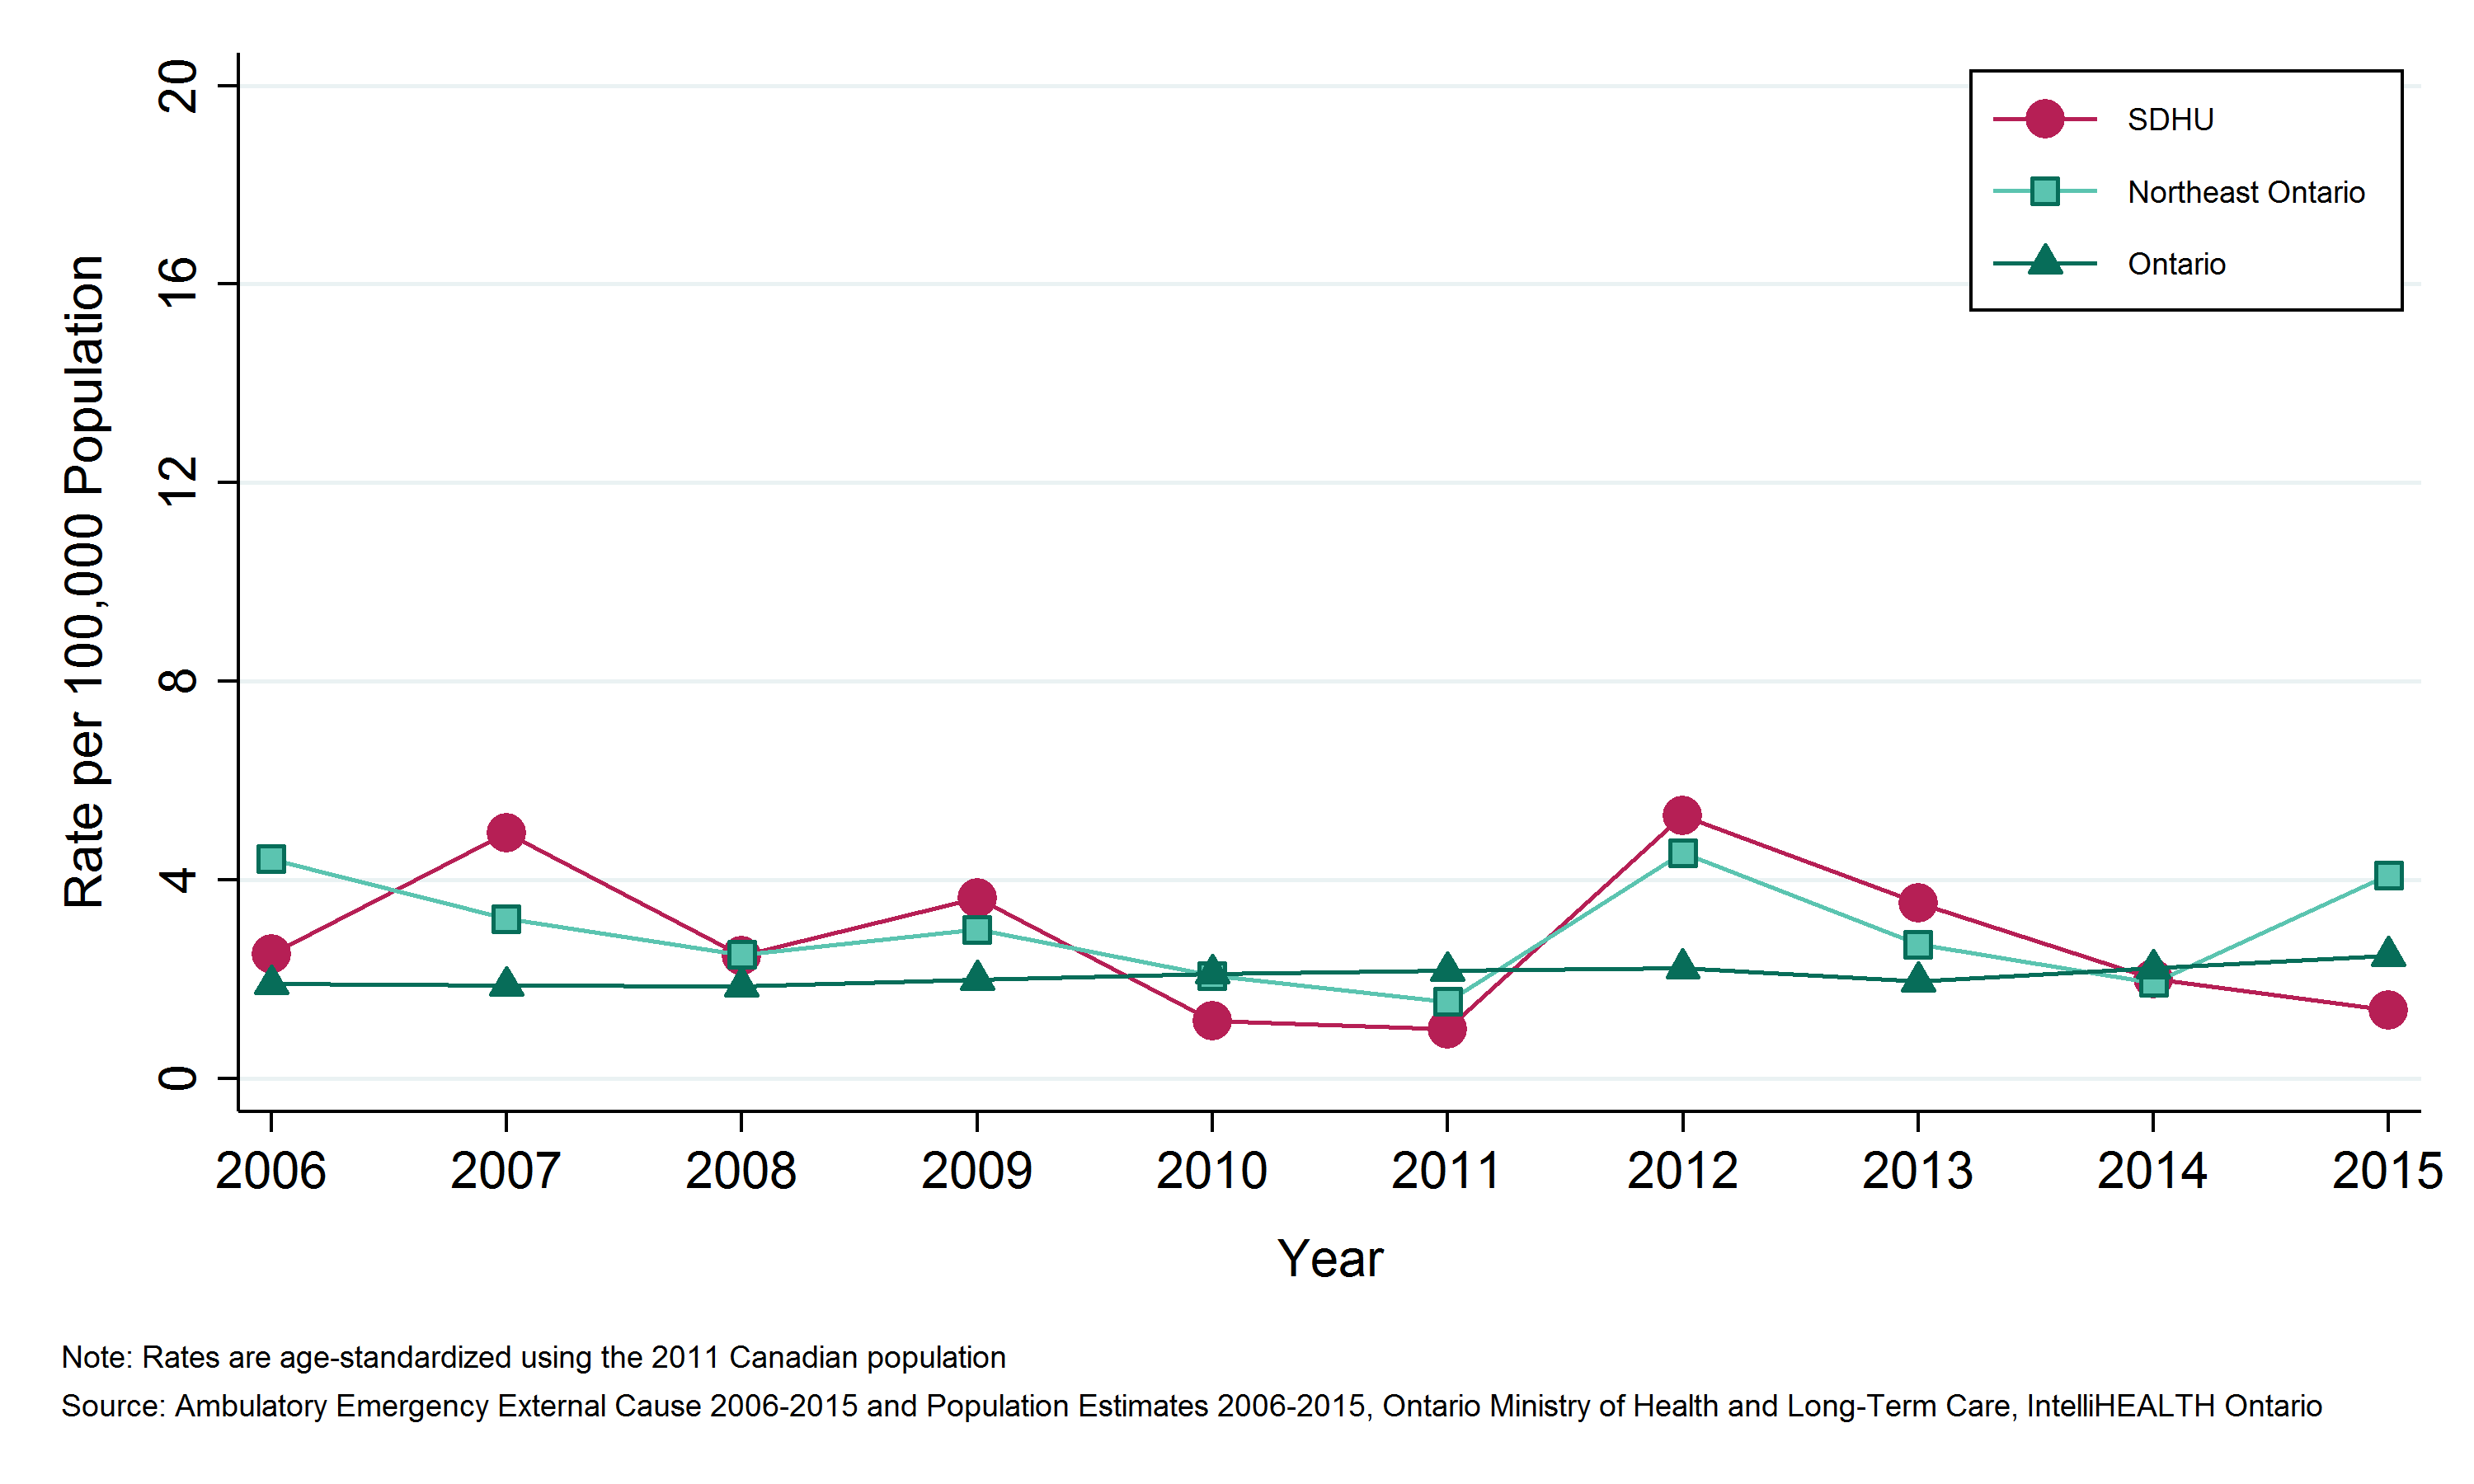
- In 2015, the ED visits rate due to drowning and submersion in the SDHU area was 1 per 100,000 population per year.
- The rate of ED visits due to drowning and submersion in the SDHU area has been similar to that of northeastern Ontario and Ontario overall.
- Between 2006 and 2015, there was no clear trend in the rate of ED visits due to drowning and submersion in the SDHU area.
Notes:
- Geographic areas and/or time periods in which there is less access to walk-in clinics and other alternatives to the local ED can be expected to have higher rates of injury-related ED visits than they would otherwise.
- Rates are age-standardized using the 2011 Canadian population.
- Data Source: Ambulatory Emergency External Cause 2006 to 2015 (extracted June 6, 2016) and Population Estimates 2006 to 2015 (extracted October 7, 2016), Ontario Ministry of Health and Long-Term Care, IntelliHEALTH Ontario.
Figure: Annual age-standardized rate of emergency department visits, drowning and submersion, by geographic region, 2006 to 2015

Table: Annual age-standardized rate of emergency department visits, drowning and submersion, by geographic region, 2006 to 2015
| Geographic Region | 2006 | 2007 | 2008 | 2009 | 2010 | 2011 | 2012 | 2013 | 2014 | 2015 |
| SDHU | 2.5 | 5.0 | 2.5 | 3.6 | 1.2 | 1.0 | 5.3 | 3.5 | 2.0 | 1.4 |
| Northeast | 4.4 | 3.2 | 2.5 | 3.0 | 2.1 | 1.6 | 4.5 | 2.7 | 1.9 | 4.1 |
| Ontario | 1.9 | 1.9 | 1.9 | 2.0 | 2.1 | 2.2 | 2.2 | 2.0 | 2.2 | 2.5 |
Table: Annual number of emergency department visits, drowning and submersion, by geographic region, 2006 to 2015
| Geographic Region | 2006 | 2007 | 2008 | 2009 | 2010 | 2011 | 2012 | 2013 | 2014 | 2015 |
| SDHU | 5 | 10 | 5 | 7 | 2 | 2 | 10 | 7 | 4 | 3 |
| Northeast | 25 | 19 | 14 | 17 | 11 | 8 | 25 | 15 | 10 | 22 |
| Ontario | 242 | 242 | 243 | 259 | 279 | 287 | 297 | 262 | 297 | 333 |
Emergency department (ED) visits due to drowning and submersion by Greater Sudbury and outlying areas
Key Findings:
- Between 2011 and 2015, there were 17 emergency department (ED) visits due to drowning and submersion among residents of Greater Sudbury and 9 among residents of the SDHU district office areas, an average of 3 and 2 per year, respectively.
- The rate of ED visits due to drowning and submersion was 2 per 100,000 population per year in Greater Sudbury and 5 per 100,000 population per year in the SDHU district office areas.
- The rate of ED visits due to drowning and submersion among residents of Greater Sudbury has been similar among residents in the SDHU district office areas.
- The rate of ED visits due to drowning and submersion among residents in Greater Sudbury remained relatively stable while the rate among residents in the SDHU district office areas increased between 2006 to 2010 and 2011 to 2015.
Notes:
- Geographic areas and/or time periods in which there is less access to walk-in clinics and other alternatives to the local ED can be expected to have higher rates of injury-related ED visits than they would otherwise.
- Rates are age-standardized using the 2011 Canadian population.
- Data Source: Ambulatory Emergency External Cause 2006 to 2015 (extracted June 6, 2016) and Population Estimates 2006 to 2015 (extracted October 7, 2016), Ontario Ministry of Health and Long-Term Care, IntelliHEALTH Ontario.
Figure: Annual age-standardized rate of emergency department visits, drowning and submersion, by Greater Sudbury and outlying areas, 2006 to 2010 and 2011 to 2015
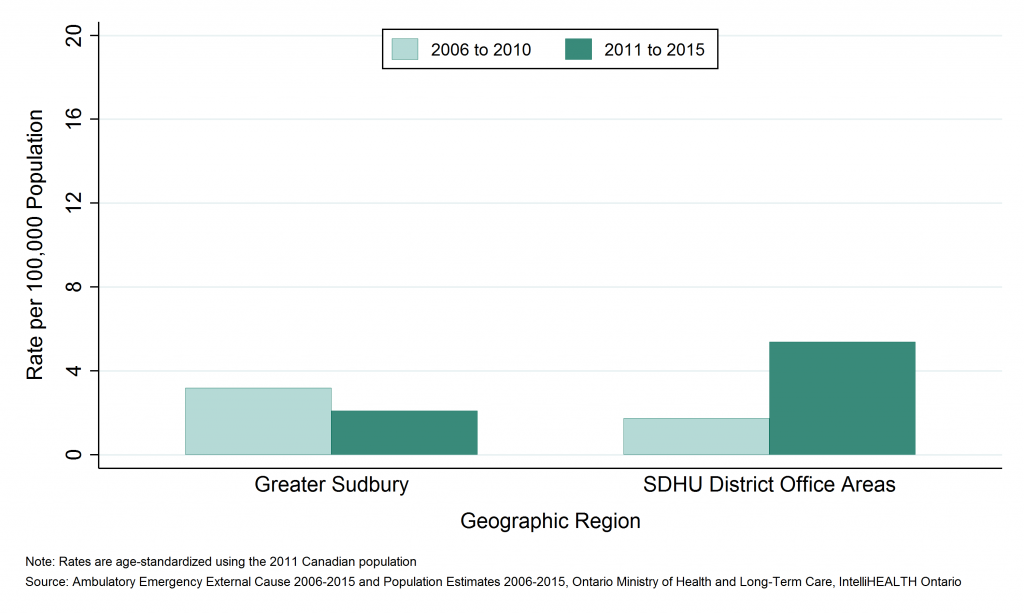
Table: Annual age-standardized rate of emergency department visits, drowning and submersion, by Greater Sudbury and outlying areas, 2006 to 2010 and 2011 to 2015
| Geographic Region | Rate per 100000 2006 to 2010 | Rate per 100000 2011 to 2015 |
| Greater Sudbury | 3.2 | 2.1 |
| SDHU District Office Areas | 1.7 | 5.4 |
Table: Annual number of emergency department visits, drowning and submersion, by Greater Sudbury and outlying areas, 2006 to 2010 and 2011 to 2015
| Geographic Region | Total Counts, 2006 to 2010 | Total Counts, 2011 to 2015 | Average Annual Counts, 2006 to 2010 | Average Annual Counts, 2011 to 2015 |
| Greater Sudbury | 26 | 17 | 5.2 | 3.4 |
| SDHU District Office Areas | 3 | 9 | 0.6 | 1.8 |
Emergency department (ED) visits due to drowning and submersion by sex
Key Findings:
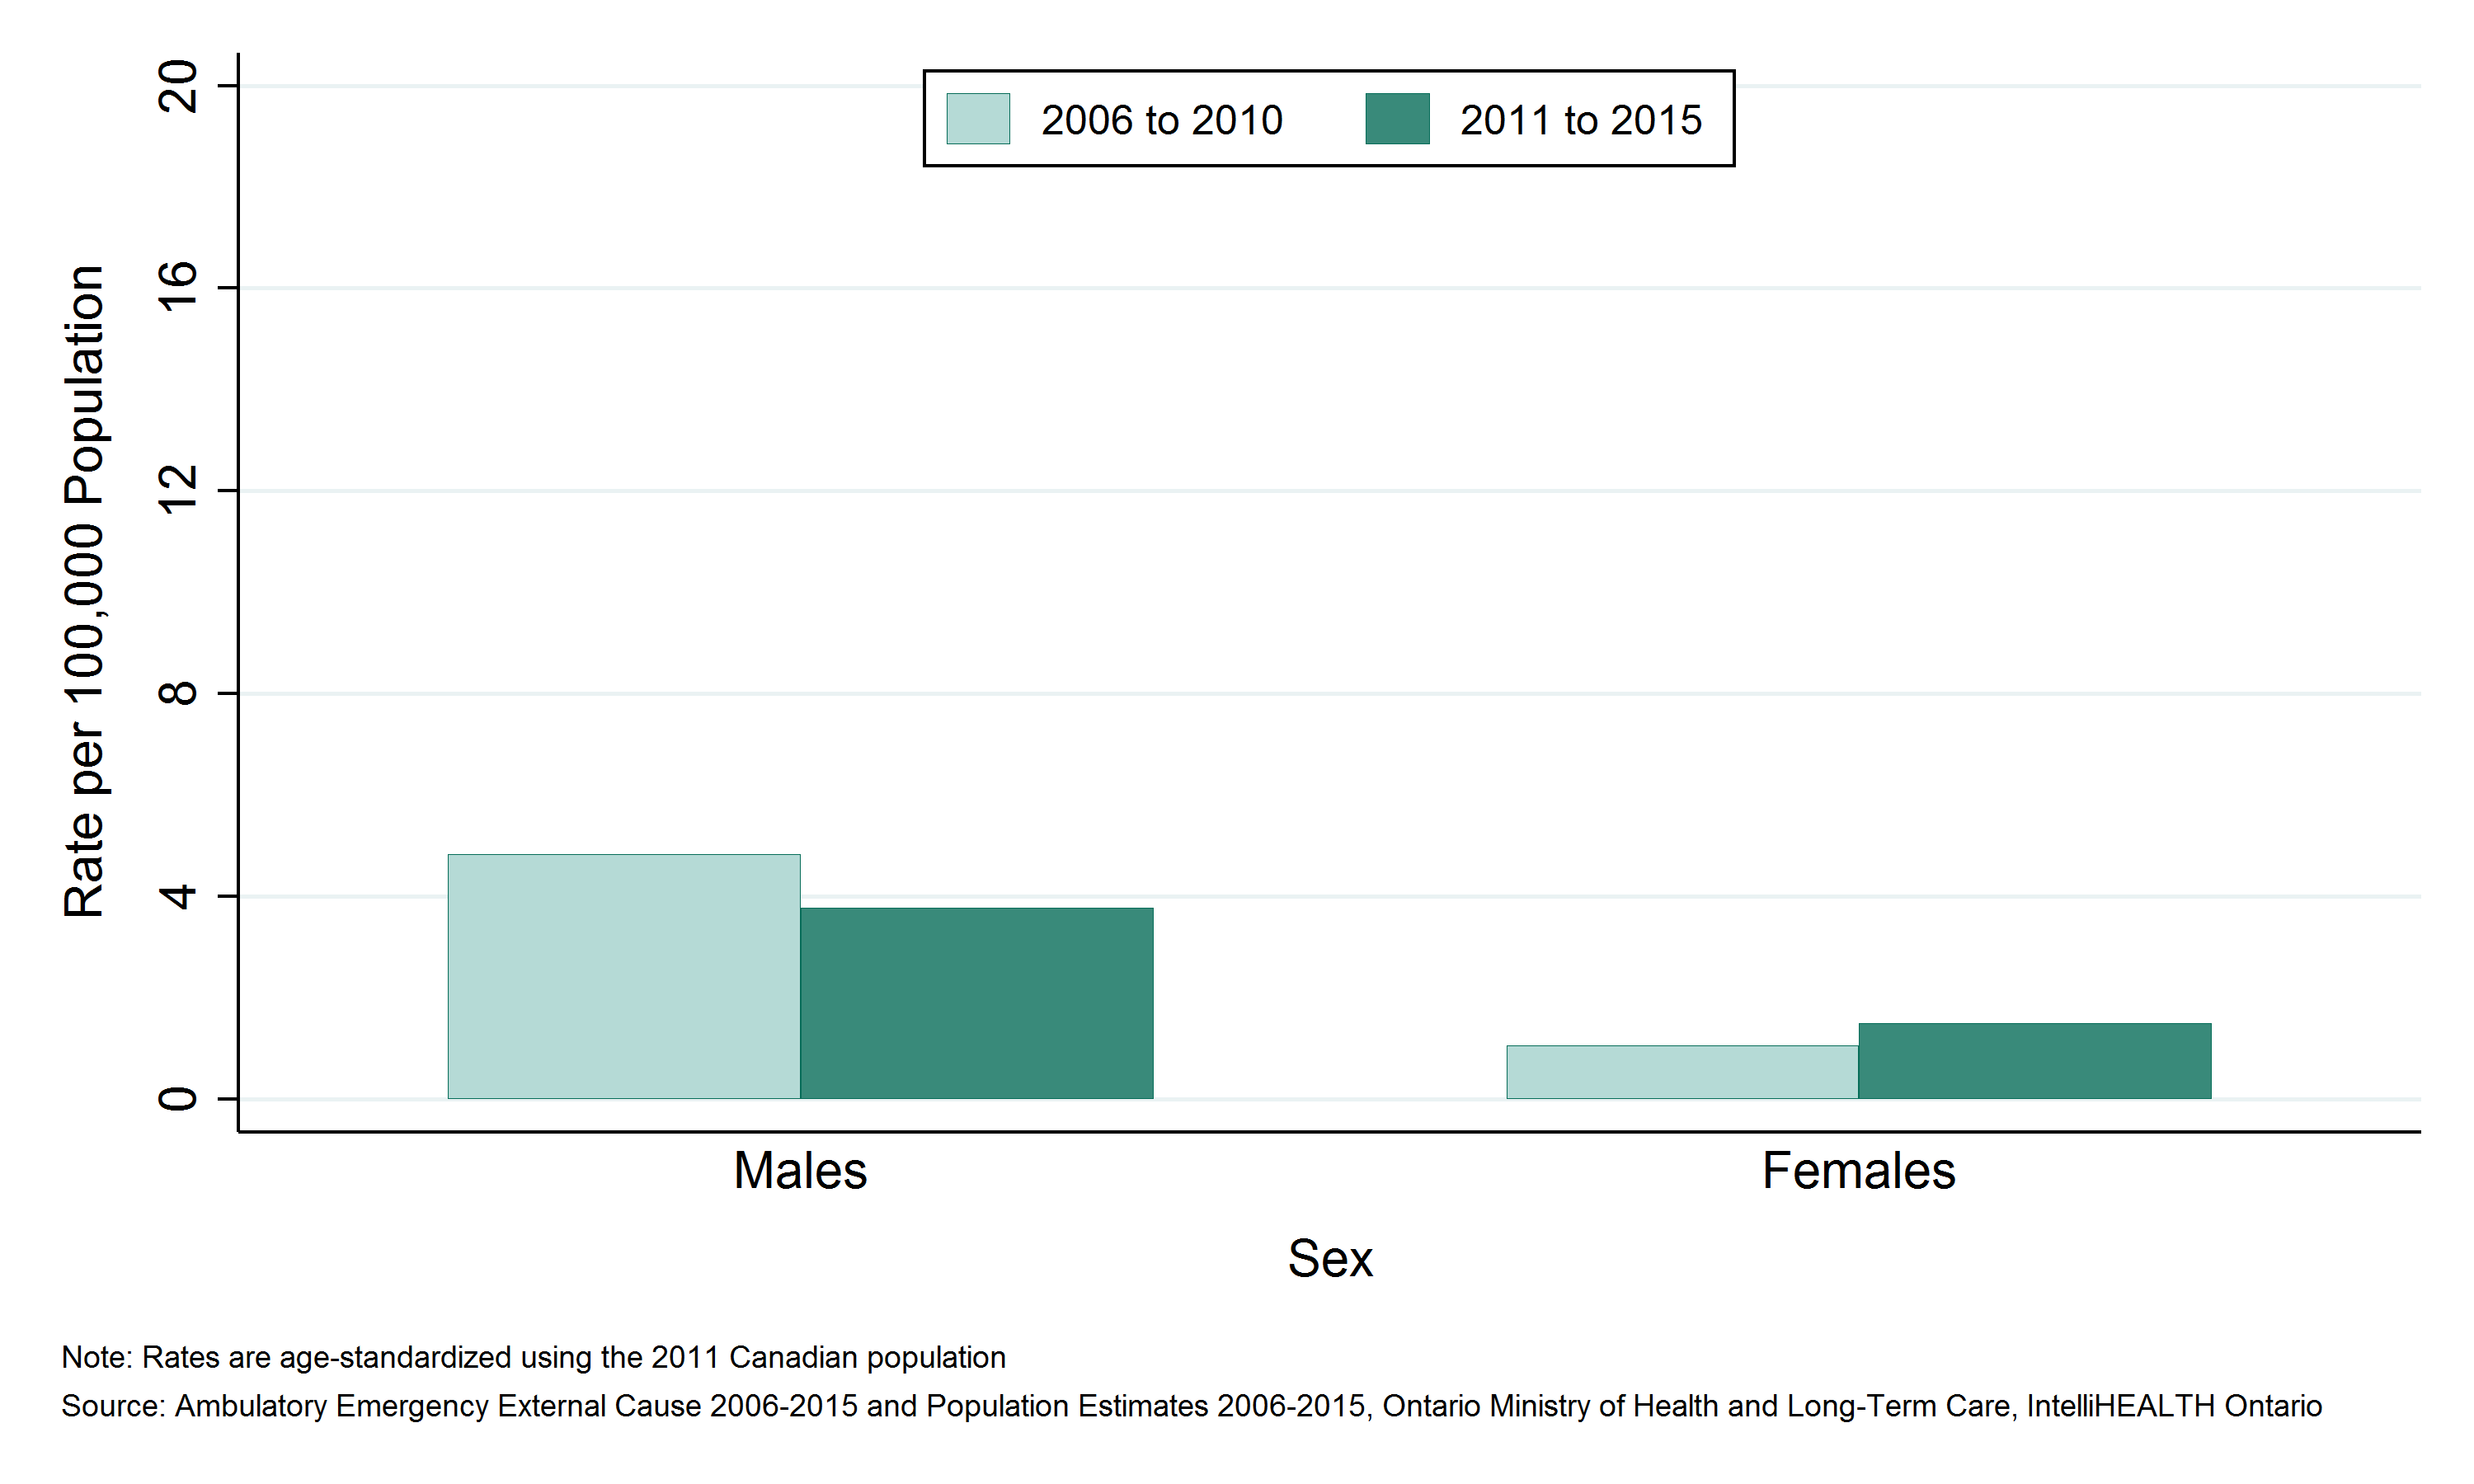
- Between 2011 and 2015, there were 18 emergency department (ED) visits due to drowning and submersion among males, and 8 among females in the Sudbury & District Health Unit (SDHU) area, an average of 4 and 2 per year, respectively.
- The rate of ED visits due to drowning and submersion was 4 per 100,000 males per year and 2 per 100,000 females per year in the SDHU area between 2011 and 2015.
- The ED visits rate due to drowning and submersion among males has consistently been higher than the rate among females.
- Among both males and females in the SDHU area, the rate of ED visits due to drowning and submersion remained stable over time between 2006 to 2010 and 2011 to 2015.
Notes:
- Geographic areas and/or time periods in which there is less access to walk-in clinics and other alternatives to the local ED can be expected to have higher rates of injury-related ED visits than they would otherwise.
- Rates are age-standardized using the 2011 Canadian population.
- Data Source: Ambulatory Emergency External Cause 2006 to 2015 (extracted June 6, 2016) and Population Estimates 2006 to 2015 (extracted October 7, 2016), Ontario Ministry of Health and Long-Term Care, IntelliHEALTH Ontario.
Figure: Annual age-standardized rate of emergency department visits, drowning and submersion, by sex, SDHU, 2006 to 2010 and 2011 to 2015

Table: Annual age-standardized rate of emergency department visits, drowning and submersion, by sex, SDHU, 2006 to 2010 and 2011 to 2015
| Sex | Rate per 100,000, 2006 to 2010 | Rate per 100,000, 2011 to 2015 |
| Males | 4.8 | 3.8 |
| Females | 1.1 | 1.5 |
Table: Annual number of emergency department visits, drowning and submersion, by sex, SDHU, 2006 to 2010 and 2011 to 2015
| Sex | Total Counts, 2006 to 2010 | Total Counts, 2011 to 2015 | Average Annual Counts, 2006 to 2010 | Average Annual Counts, 2011 to 2015 |
| Males | 24 | 18 | 4.8 | 3.6 |
| Females | 5 | 8 | 1.0 | 1.6 |
Emergency department (ED) visits due to drowning and submersion by age group
Key Findings:
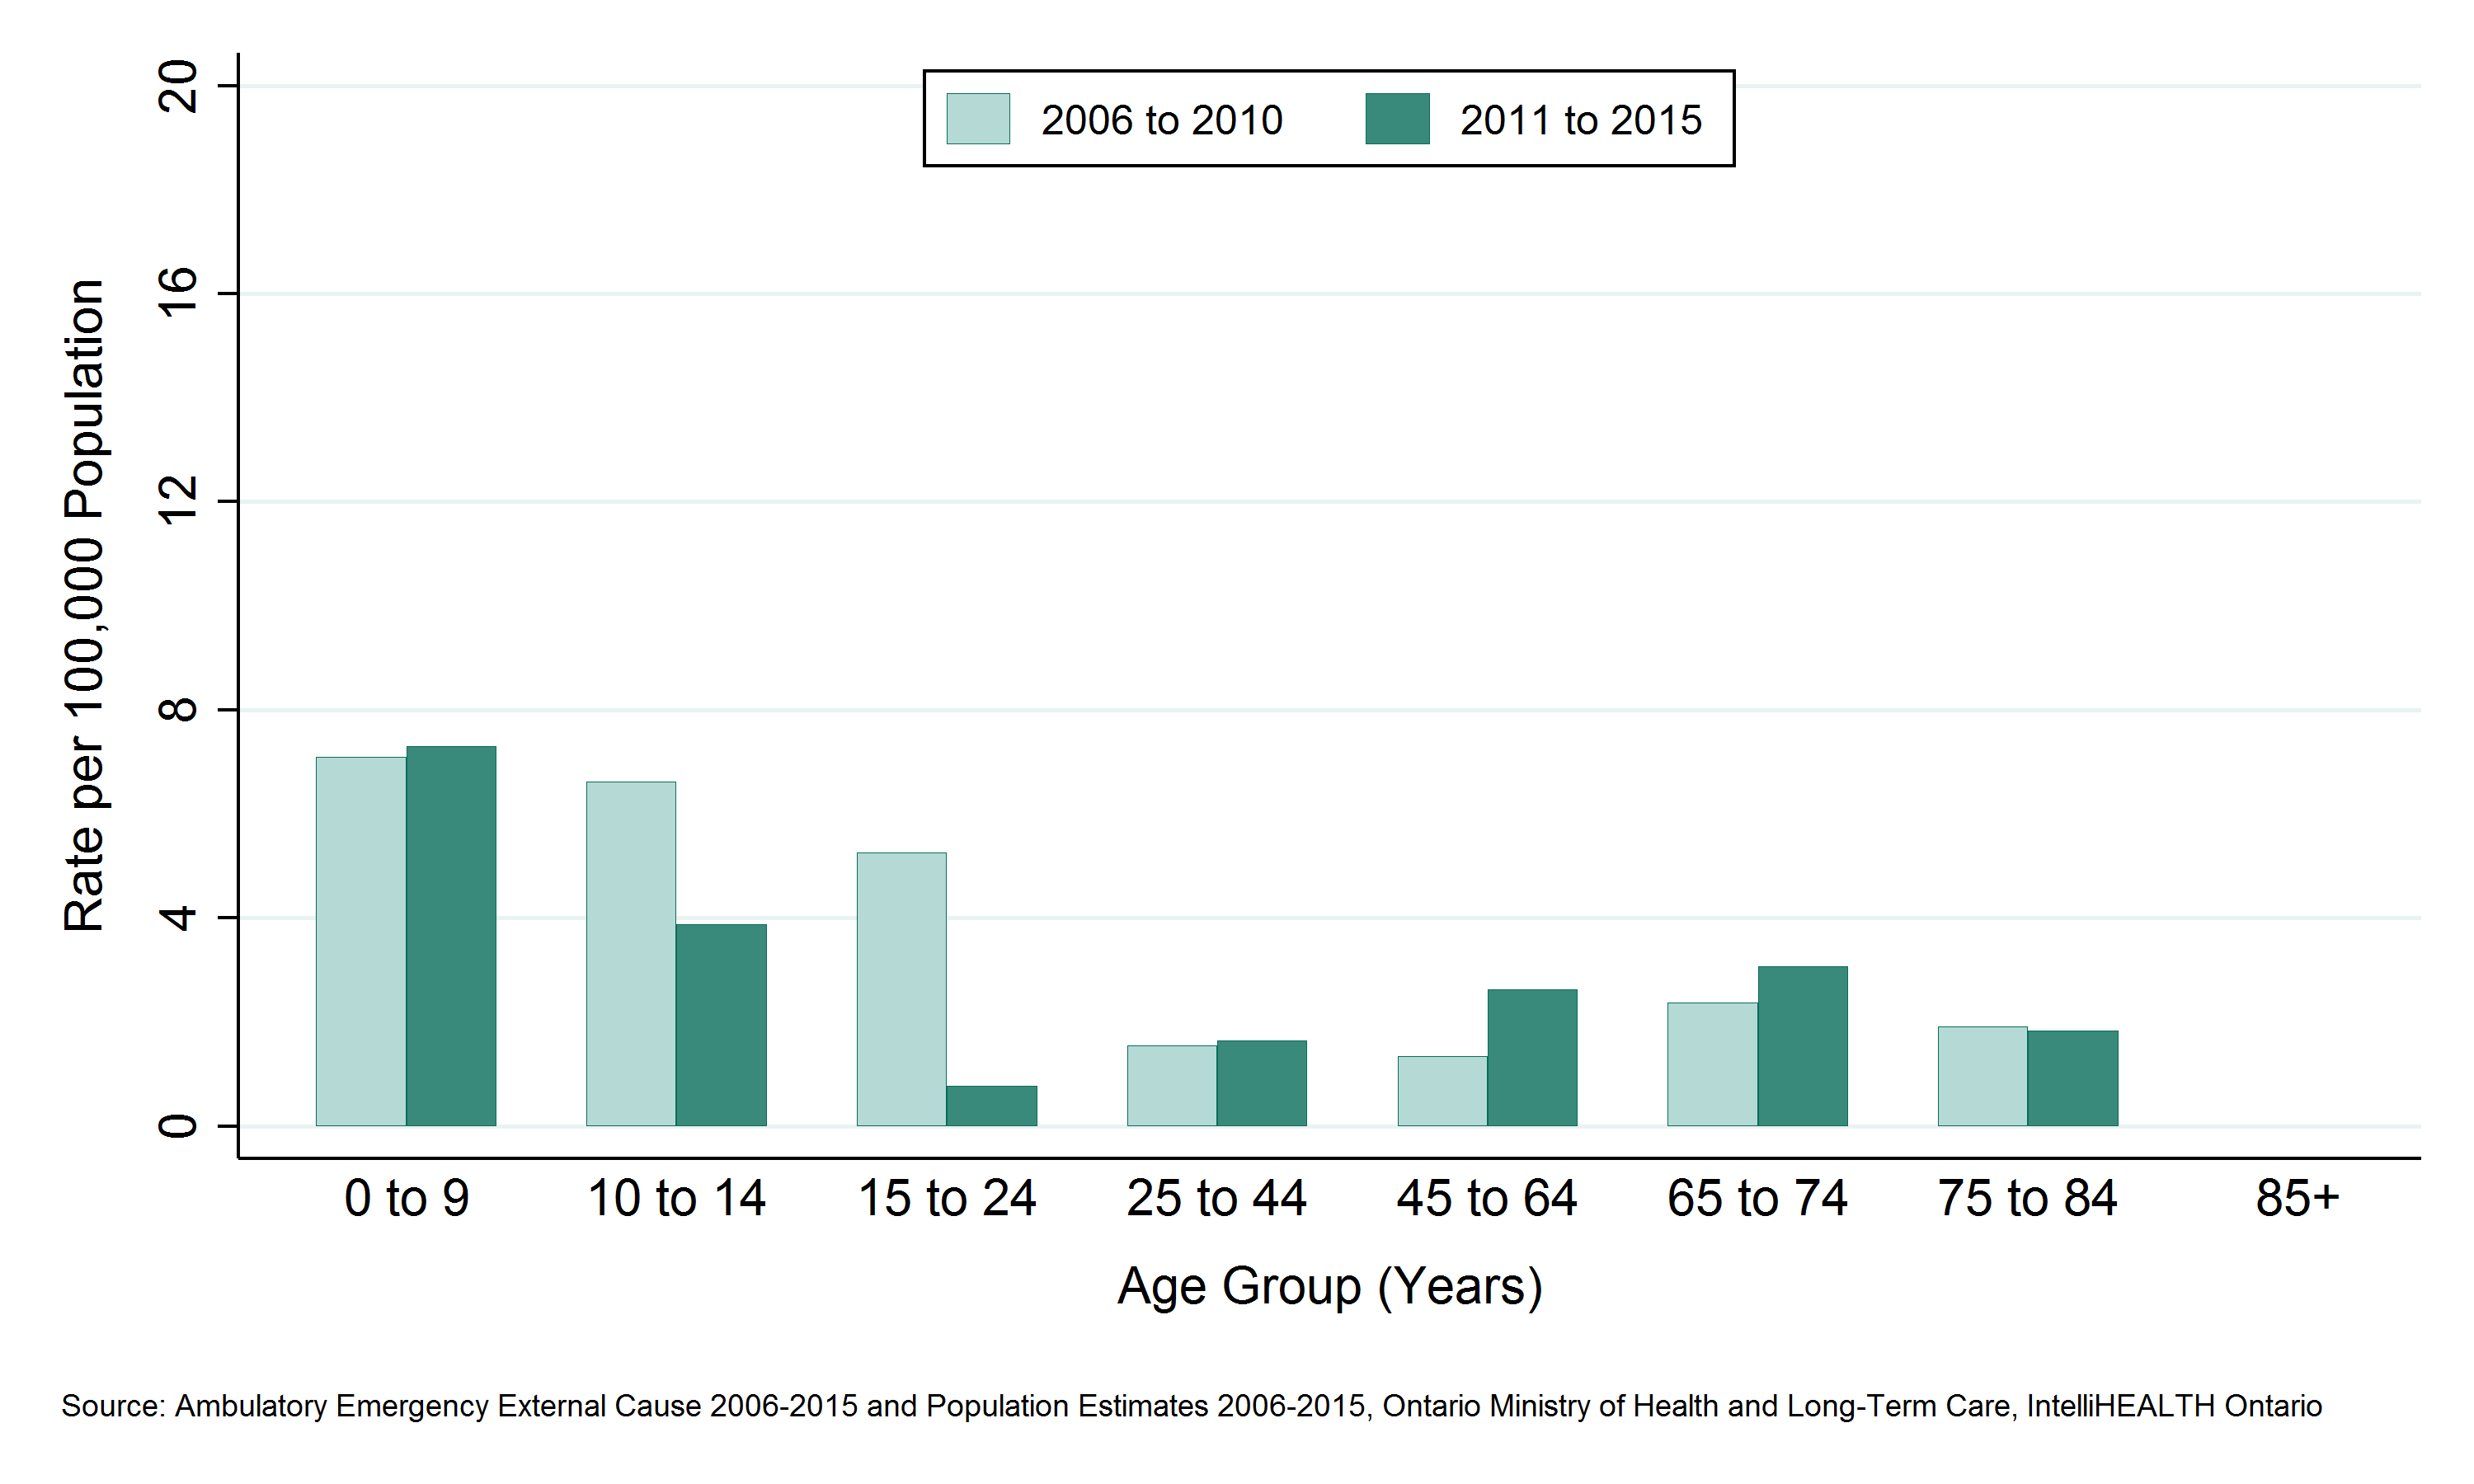
- Among residents of the Sudbury & District Health Unit (SDHU) area, the 45 to 64 age group visited the emergency department (ED) due to drowning and submersion the most, with 8 ED visits between 2011 and 2015, or 2 ED visits per year on average.
- Between 2011 and 2015, the 0 to 9 age group had the highest ED visits rate due to drowning and submersion with 7 ED visits per 100,000 population per year.
- Rates of ED visits due to drowning and submersion are highest in children aged 0 to 9, then decrease in youth and remain lower through adulthood.
- In the SDHU area, the rate ED visits due to drowning and submersion decreased in the 10 to 14 and 15 to 24 year age groups between 2006 to 2010 and 2011 to 2015, increased in the 45 to 64 year age group, and remained stable in other age groups.
Notes:
- Geographic areas and/or time periods in which there is less access to walk-in clinics and other alternatives to the local ED can be expected to have higher rates of injury-related ED visits than they would otherwise.
- Data Source: Ambulatory Emergency External Cause 2006 to 2015 (extracted June 6, 2016) and Population Estimates 2006 to 2015 (extracted October 7, 2016), Ontario Ministry of Health and Long-Term Care, IntelliHEALTH Ontario.
Figure: Annual rate of emergency department visits, drowning and submersion, by age group, SDHU, 2006 to 2010 and 2011 to 2015

Table: Annual rate of emergency department visits, drowning and submersion, by age group, SDHU, 2006 to 2010 and 2011 to 2015
| Age Group | Rate per 100000, 2006 to 2010 | Rate per 100000, 2011 to 2015 |
| 0 to 9 | 7.1 | 7.3 |
| 10 to 14 | 6.6 | 3.9 |
| 15 to 24 | 5.3 | 0.8 |
| 25 to 44 | 1.5 | 1.6 |
| 45 to 64 | 1.3 | 2.6 |
| 65 to 74 | 2.4 | 3.1 |
| 75 to 84 | 1.9 | 1.8 |
| 85+ | 0.0 | 0.0 |
Table: Annual number of emergency department visits, drowning and submersion, by age group, SDHU, 2006 to 2010 and 2011 to 2015
| Age Group | Total Counts, 2006 to 2010 | Total Counts, 2011 to 2015 | Average Annual Counts, 2006 to 2010 | Average Annual Counts, 2011 to 2015 |
| 0 to 9 | 7 | 7 | 1.4 | 1.4 |
| 10 to 14 | 4 | 2 | 0.8 | 0.4 |
| 15 to 24 | 7 | 1 | 1.4 | 0.2 |
| 25 to 44 | 4 | 4 | 0.8 | 0.8 |
| 45 to 64 | 4 | 8 | 0.8 | 1.6 |
| 65 to 74 | 2 | 3 | 0.4 | 0.6 |
| 75 to 84 | 1 | 1 | 0.2 | 0.2 |
| 85+ | 0 | 0 | 0.0 | 0.0 |
Deaths due to drowning and submersion by geographic region
Key Findings:
- Among residents of the Sudbury & District Health Unit (SDHU) area, there were 12 deaths due to drowning and submersion between 2007 and 2011, an average of 2 deaths per year.
- Between 2006 and 2015, the mortality rate due to drowning and submersion in the SDHU area was 1 death per 100,000 population per year.
- The mortality rate due to drowning and submersion in the SDHU area, northeastern Ontario, and Ontario overall have been similar.
- Between 2002 to 2006 and 2007 to 2011, the mortality rate due to drowning and submersion in the SDHU area remained stable.
Notes:
- Rates are age-standardized using the 2011 Canadian population.
- Data Source: Ontario Mortality Data 2002 to 2011 (extracted June 6, 2016) and Population Estimates 2006 to 2015 (extracted October 7, 2016), Ontario Ministry of Health and Long-Term Care, IntelliHEALTH Ontario.
Figure: Annual age-standardized mortality rate, drowning and submersion, by geographic region, 2002 to 2006 and 2007 to 2011
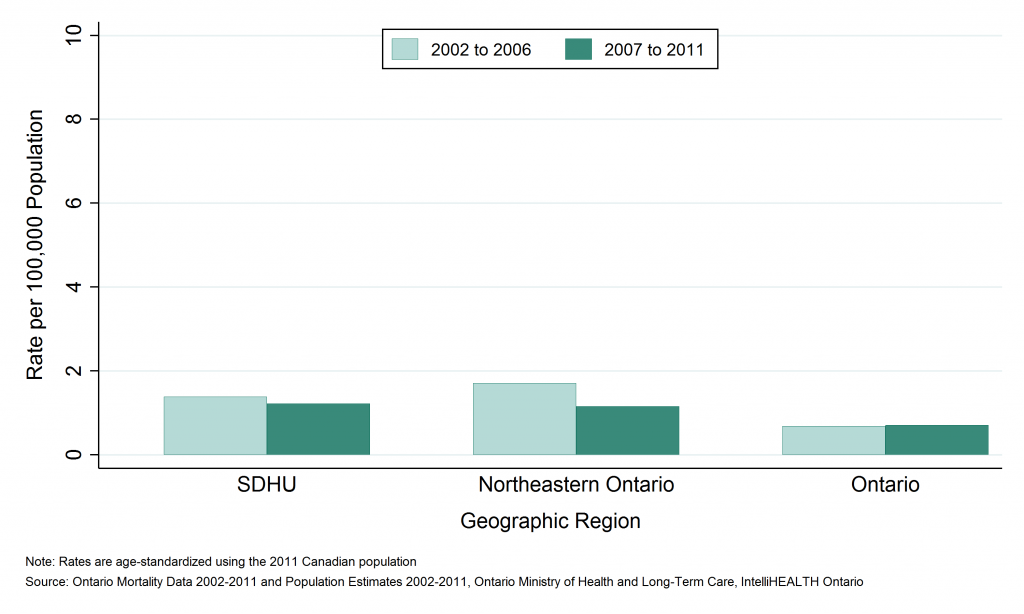
Table: Annual age-standardized mortality rate, drowning and submersion, by geographic region, 2002 to 2006 and 2007 to 2011
| Geographic Region | Rate per 100,000, 2002 to 2006 | Rate per 100,000, 2007 to 2011 |
| SDHU | 55.1 | 51.3 |
| Northeast | 72.2 | 44.0 |
| Ontario | 23.2 | 23.9 |
Table: Annual number of deaths, drowning and submersion, by geographic region, 2002 to 2006 and 2007 to 2011
| Geographic Region | Total Counts 2002 to 2006 | Total Counts 2007 to 2011 | Average Annual Counts, 2002 to 2006 | Average Annual Counts, 2007 to 2011 |
| SDHU | 14 | 12 | 2.8 | 2.4 |
| Northeast | 49 | 33 | 9.8 | 6.6 |
| Ontario | 414 | 456 | 82.8 | 91.2 |
Potential years of life lost (PYLL) due to drowning and submersion by geographic region
Key Findings:
- Between 2006 and 2015, Sudbury & District Health Unit (SDHU) area residents lost 464 years of potential life due to deaths from drowning and submersion before the age of 75, an average of 93 per year.
- The rate of potential years of life lost (PYLL) in the SDHU area due to drowning and submersion was 51 PYLL per 100,000 population per year.
- The rate of PYLL due to drowning and submersion in the SDHU area has was similar to that in northeastern Ontario, with some fluctuations. Rates in both areas have generally been higher than the rate in Ontario overall.
- Between 2002 to 2006 and 2007 to 2011, the rate of PYLL due to drowning and submersion in the SDHU area remained stable.
Notes:
- Rates are age-standardized using the 2011 Canadian population.
- Data Source: Ontario Mortality Data 2002 to 2011 (extracted June 6, 2016) and Population Estimates 2006 to 2015 (extracted October 7, 2016), Ontario Ministry of Health and Long-Term Care, IntelliHEALTH Ontario
Figure: Annual age-standardized rate of potential years of life lost (PYLL), drowning and submersion, by geographic region, 2002 to 2006 and 2007 to 2011
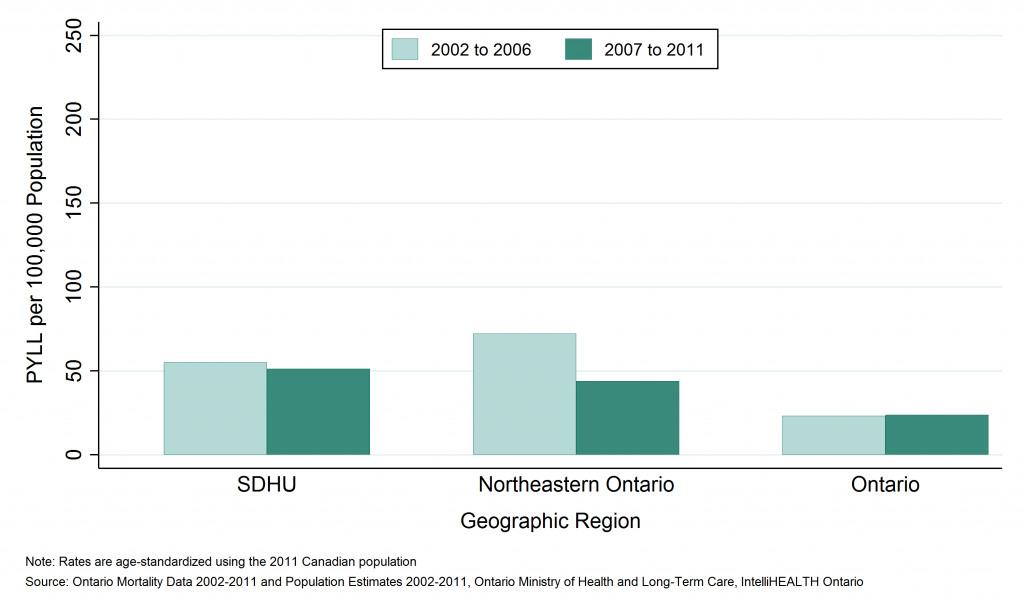
Table: Annual age-standardized rate of potential years of life lost (PYLL), drowning and submersion, by geographic region, 2002 to 2006 and 2007 to 2011
| Geographic Region | Rate per 100,000, 2002 to 2006 | Rate per 100,000, 2007 to 2011 |
| SDHU | 55.1 | 51.3 |
| Northeast | 72.2 | 44.0 |
| Ontario | 23.2 | 23.9 |
Table: Annual number of potential years of life lost (PYLL), drowning and submersion, by geographic region, 2002 to 2006 and 2007 to 2011
| Geographic Region | Total PYLL, 2002 to 2006 | Total PYLL, 2007 to 2011 | Average Annual Counts, 2002 to 2006 | Average Annual Counts, 2007 to 2011 |
| SDHU | 518 | 464 | 103.6 | 92.8 |
| Northeast | 1,930 | 1,130 | 386.0 | 226.0 |
| Ontario | 14,366 | 15,090 | 2,873.2 | 3,018.0 |
This item was last modified on July 25, 2017