Fire & Burns
Injuries in this section include those due to accidental exposure to smoke, fire and flames, or contact with heat or hot objects/substances. Injuries due to assault, intentional self-harm, exposure to excessive natural heat, fire by arson, fires secondary to an explosion, and fires due to transport accidents are excluded.
Emergency department (ED) visits due to fire and burns by geographic region
Key Findings:
- Among the Sudbury & District Health Unit (SDHU) area residents, there were 262 emergency department (ED) visits due to fire and burns in 2015.
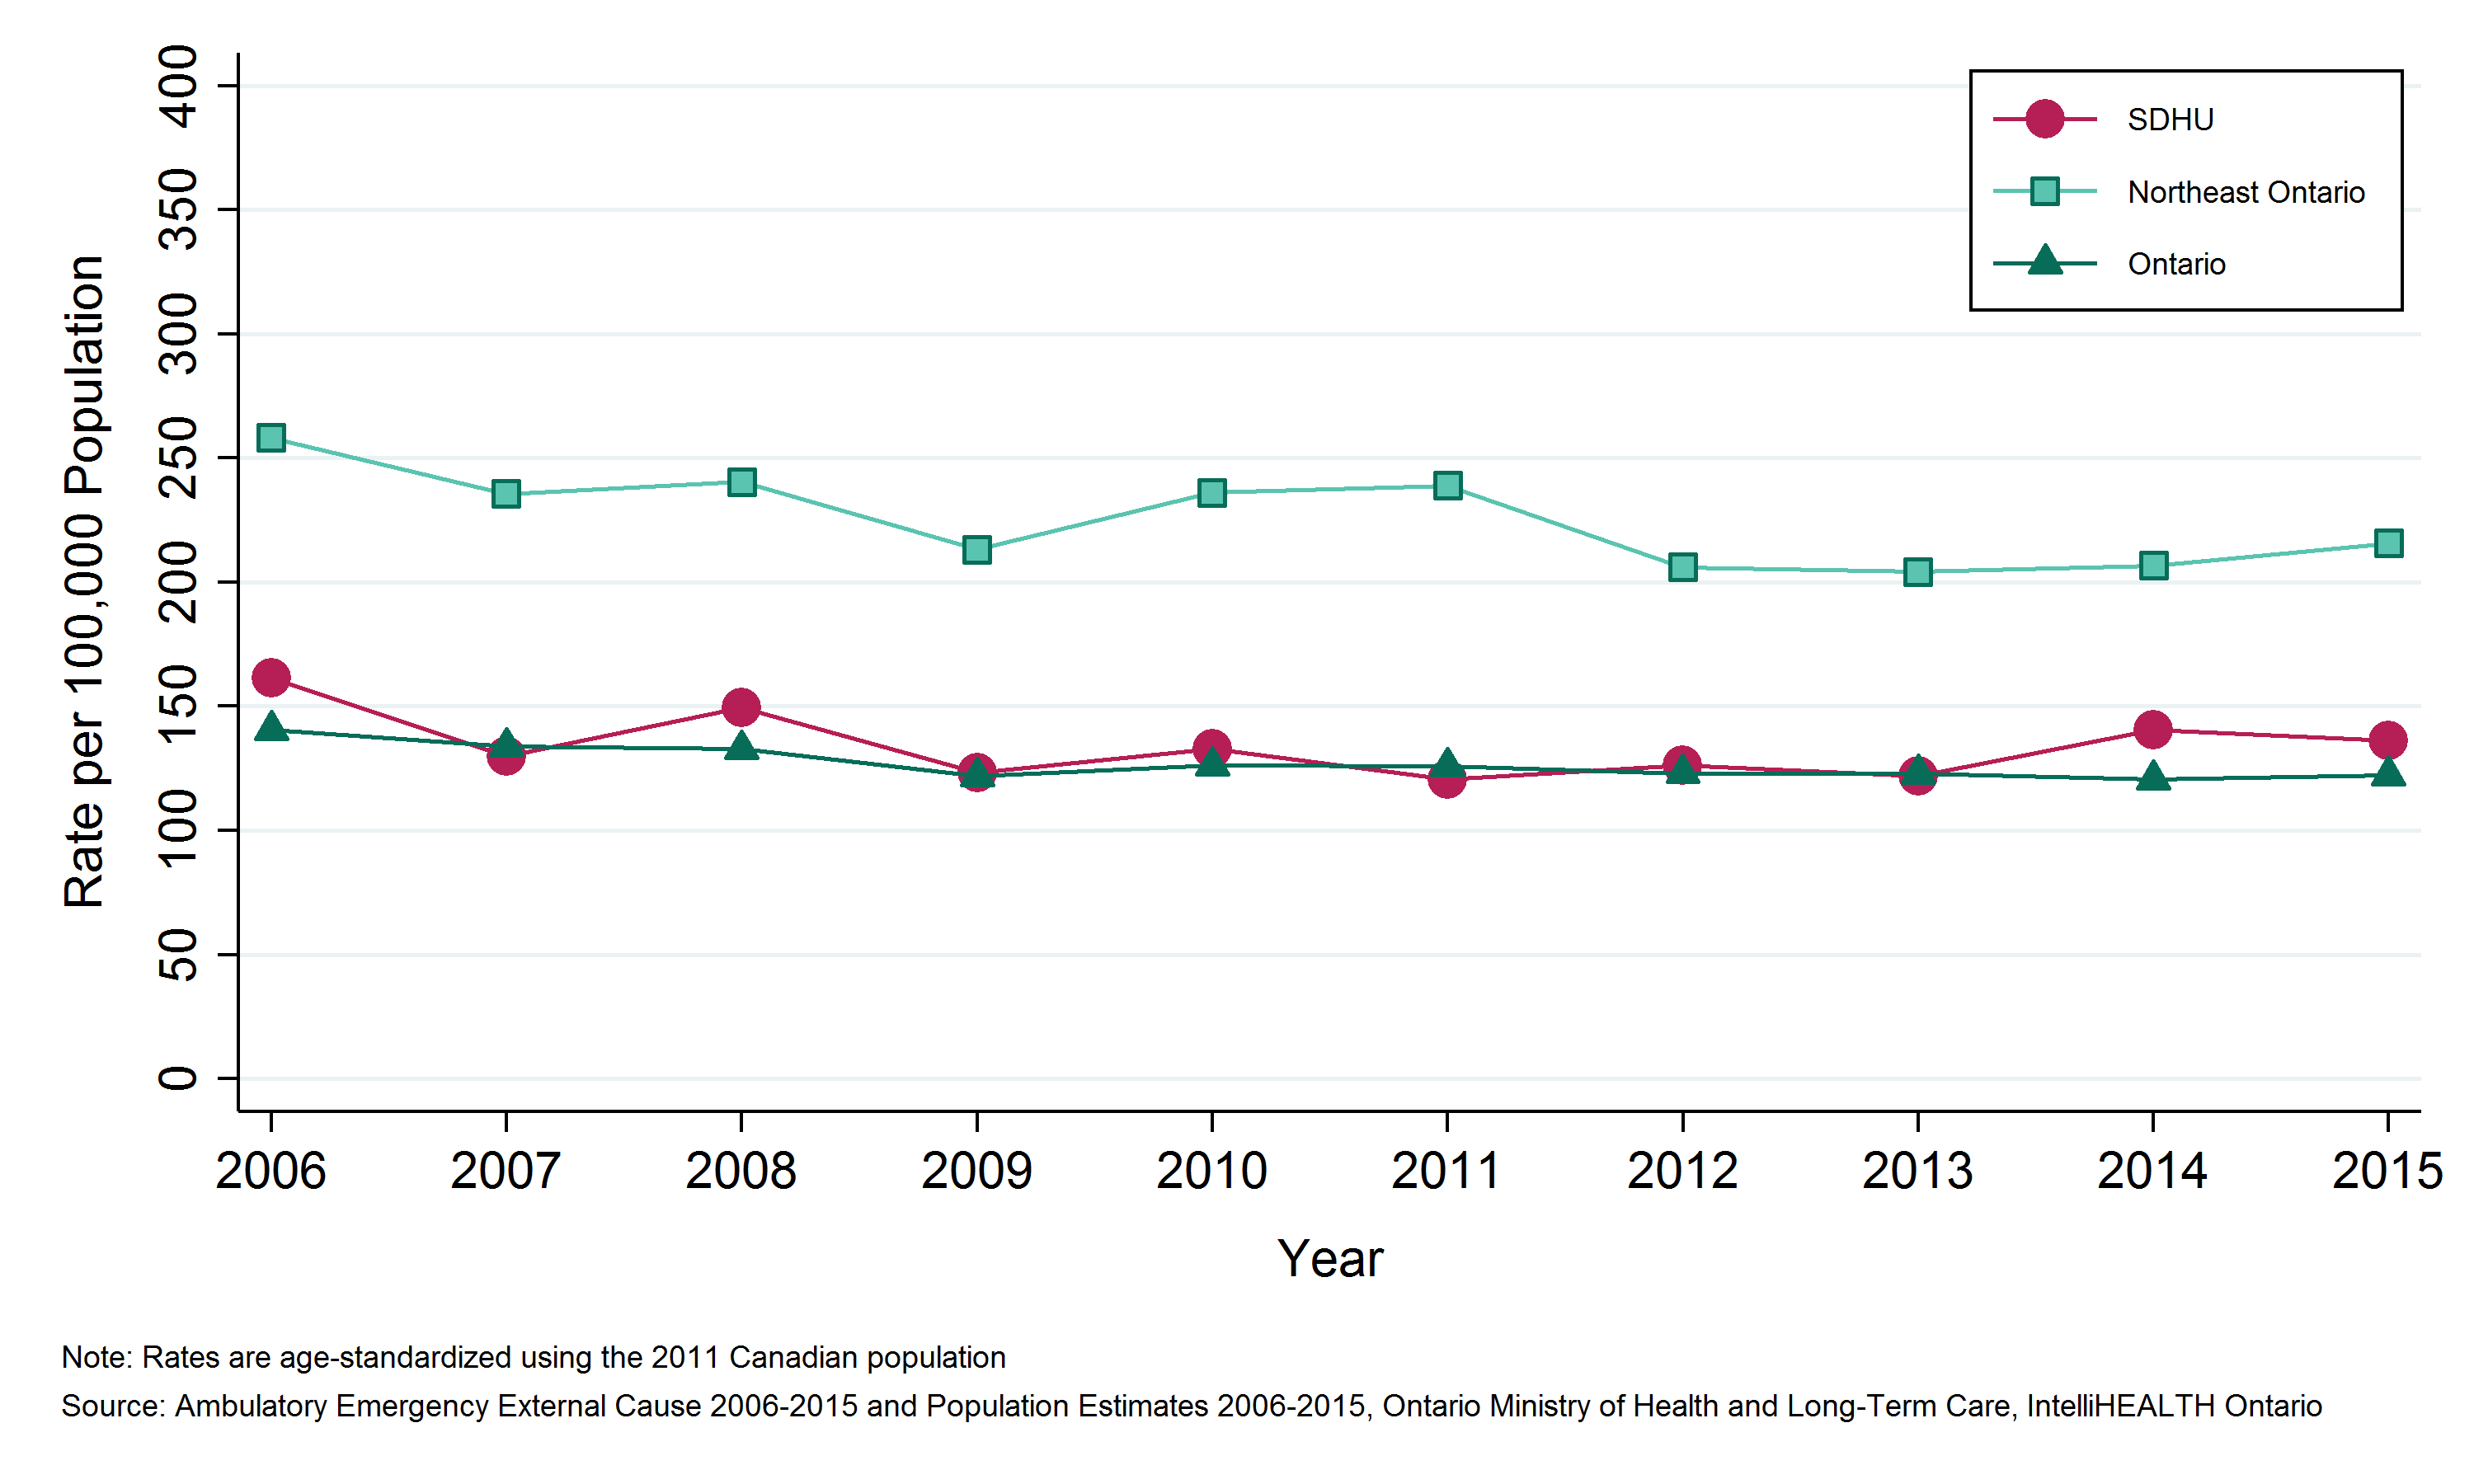
- In 2015, the ED visits rate due to fire and burns in the SDHU area was 136 per 100,000 population per year.
- The rate of ED visits due to fire and burns in the SDHU area has been consistently lower than that of northeastern Ontario, and similar to the rate in Ontario overall.
- Between 2006 and 2015, the ED visits rate due to fire and burns in the SDHU area remained stable.
Notes:
- Geographic areas and/or time periods in which there is less access to walk-in clinics and other alternatives to the local ED can be expected to have higher rates of injury-related ED visits than they would otherwise.
- Rates are age-standardized using the 2011 Canadian population.
- Data Source: Ambulatory Emergency External Cause 2006 to 2015 (extracted June 6, 2016) and Population Estimates 2006 to 2015 (extracted October 7, 2016), Ontario Ministry of Health and Long-Term Care, IntelliHEALTH Ontario.
Figure: Annual age-standardized rate of emergency department visits, fires and burns, by geographic region, 2006 to 2015
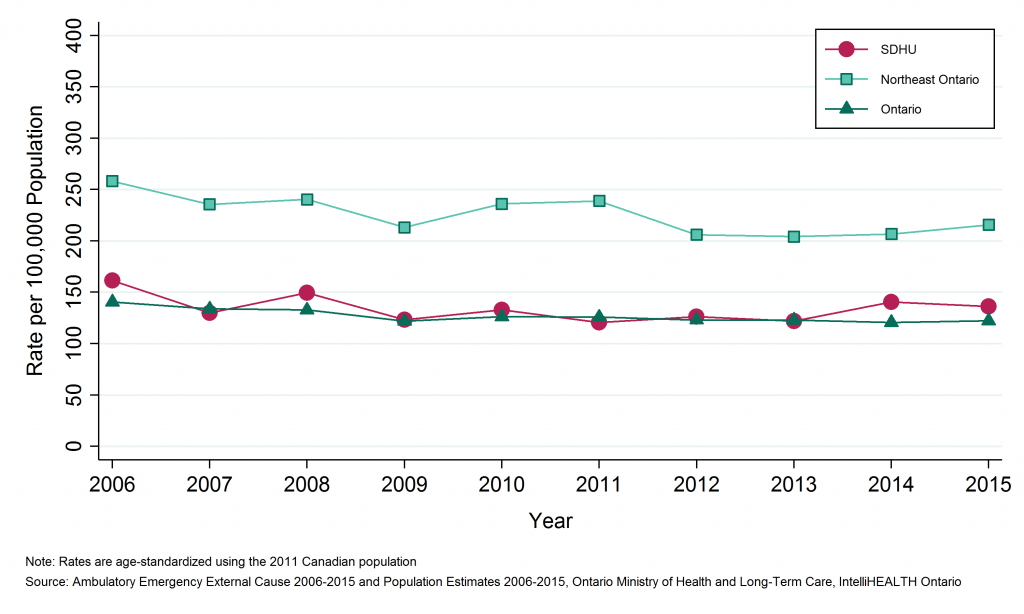
Table: Annual age-standardized rate of emergency department visits, fires and burns, by geographic region, 2006 to 2015
| Geographic Region | 2006 | 2007 | 2008 | 2009 | 2010 | 2011 | 2012 | 2013 | 2014 | 2015 |
| SDHU | 161.3 | 130.1 | 149.5 | 123.4 | 132.9 | 120.7 | 126.3 | 121.9 | 140.4 | 136.2 |
| Northeast | 258.2 | 235.6 | 240.5 | 213.2 | 236.1 | 238.8 | 206.1 | 204.2 | 206.7 | 215.7 |
| Ontario | 140.6 | 133.7 | 132.7 | 121.8 | 126.1 | 125.8 | 123.1 | 123.0 | 120.7 | 122.2 |
Table: Annual number of emergency department visits, fires and burns, by geographic region, 2006 to 2015
| Geographic Region | 2006 | 2007 | 2008 | 2009 | 2010 | 2011 | 2012 | 2013 | 2014 | 2015 |
| SDHU | 319 | 253 | 298 | 244 | 259 | 236 | 247 | 236 | 273 | 262 |
| Northeast | 1,447 | 1,313 | 1,347 | 1,174 | 1,304 | 1,319 | 1,125 | 1,109 | 1,119 | 1,151 |
| Ontario | 18,098 | 17,303 | 17,304 | 15,954 | 16,667 | 16,767 | 16,566 | 16,627 | 16,457 | 16,752 |
Emergency department (ED) visits due to fire and burns by Greater Sudbury and outlying areas
Key Findings:
- Between 2011 and 2015, there were 764 emergency department (ED) visits due to fire and burns among residents of Greater Sudbury and 490 among residents of the SDHU district office areas, an average of 153 and 98 per year, respectively.
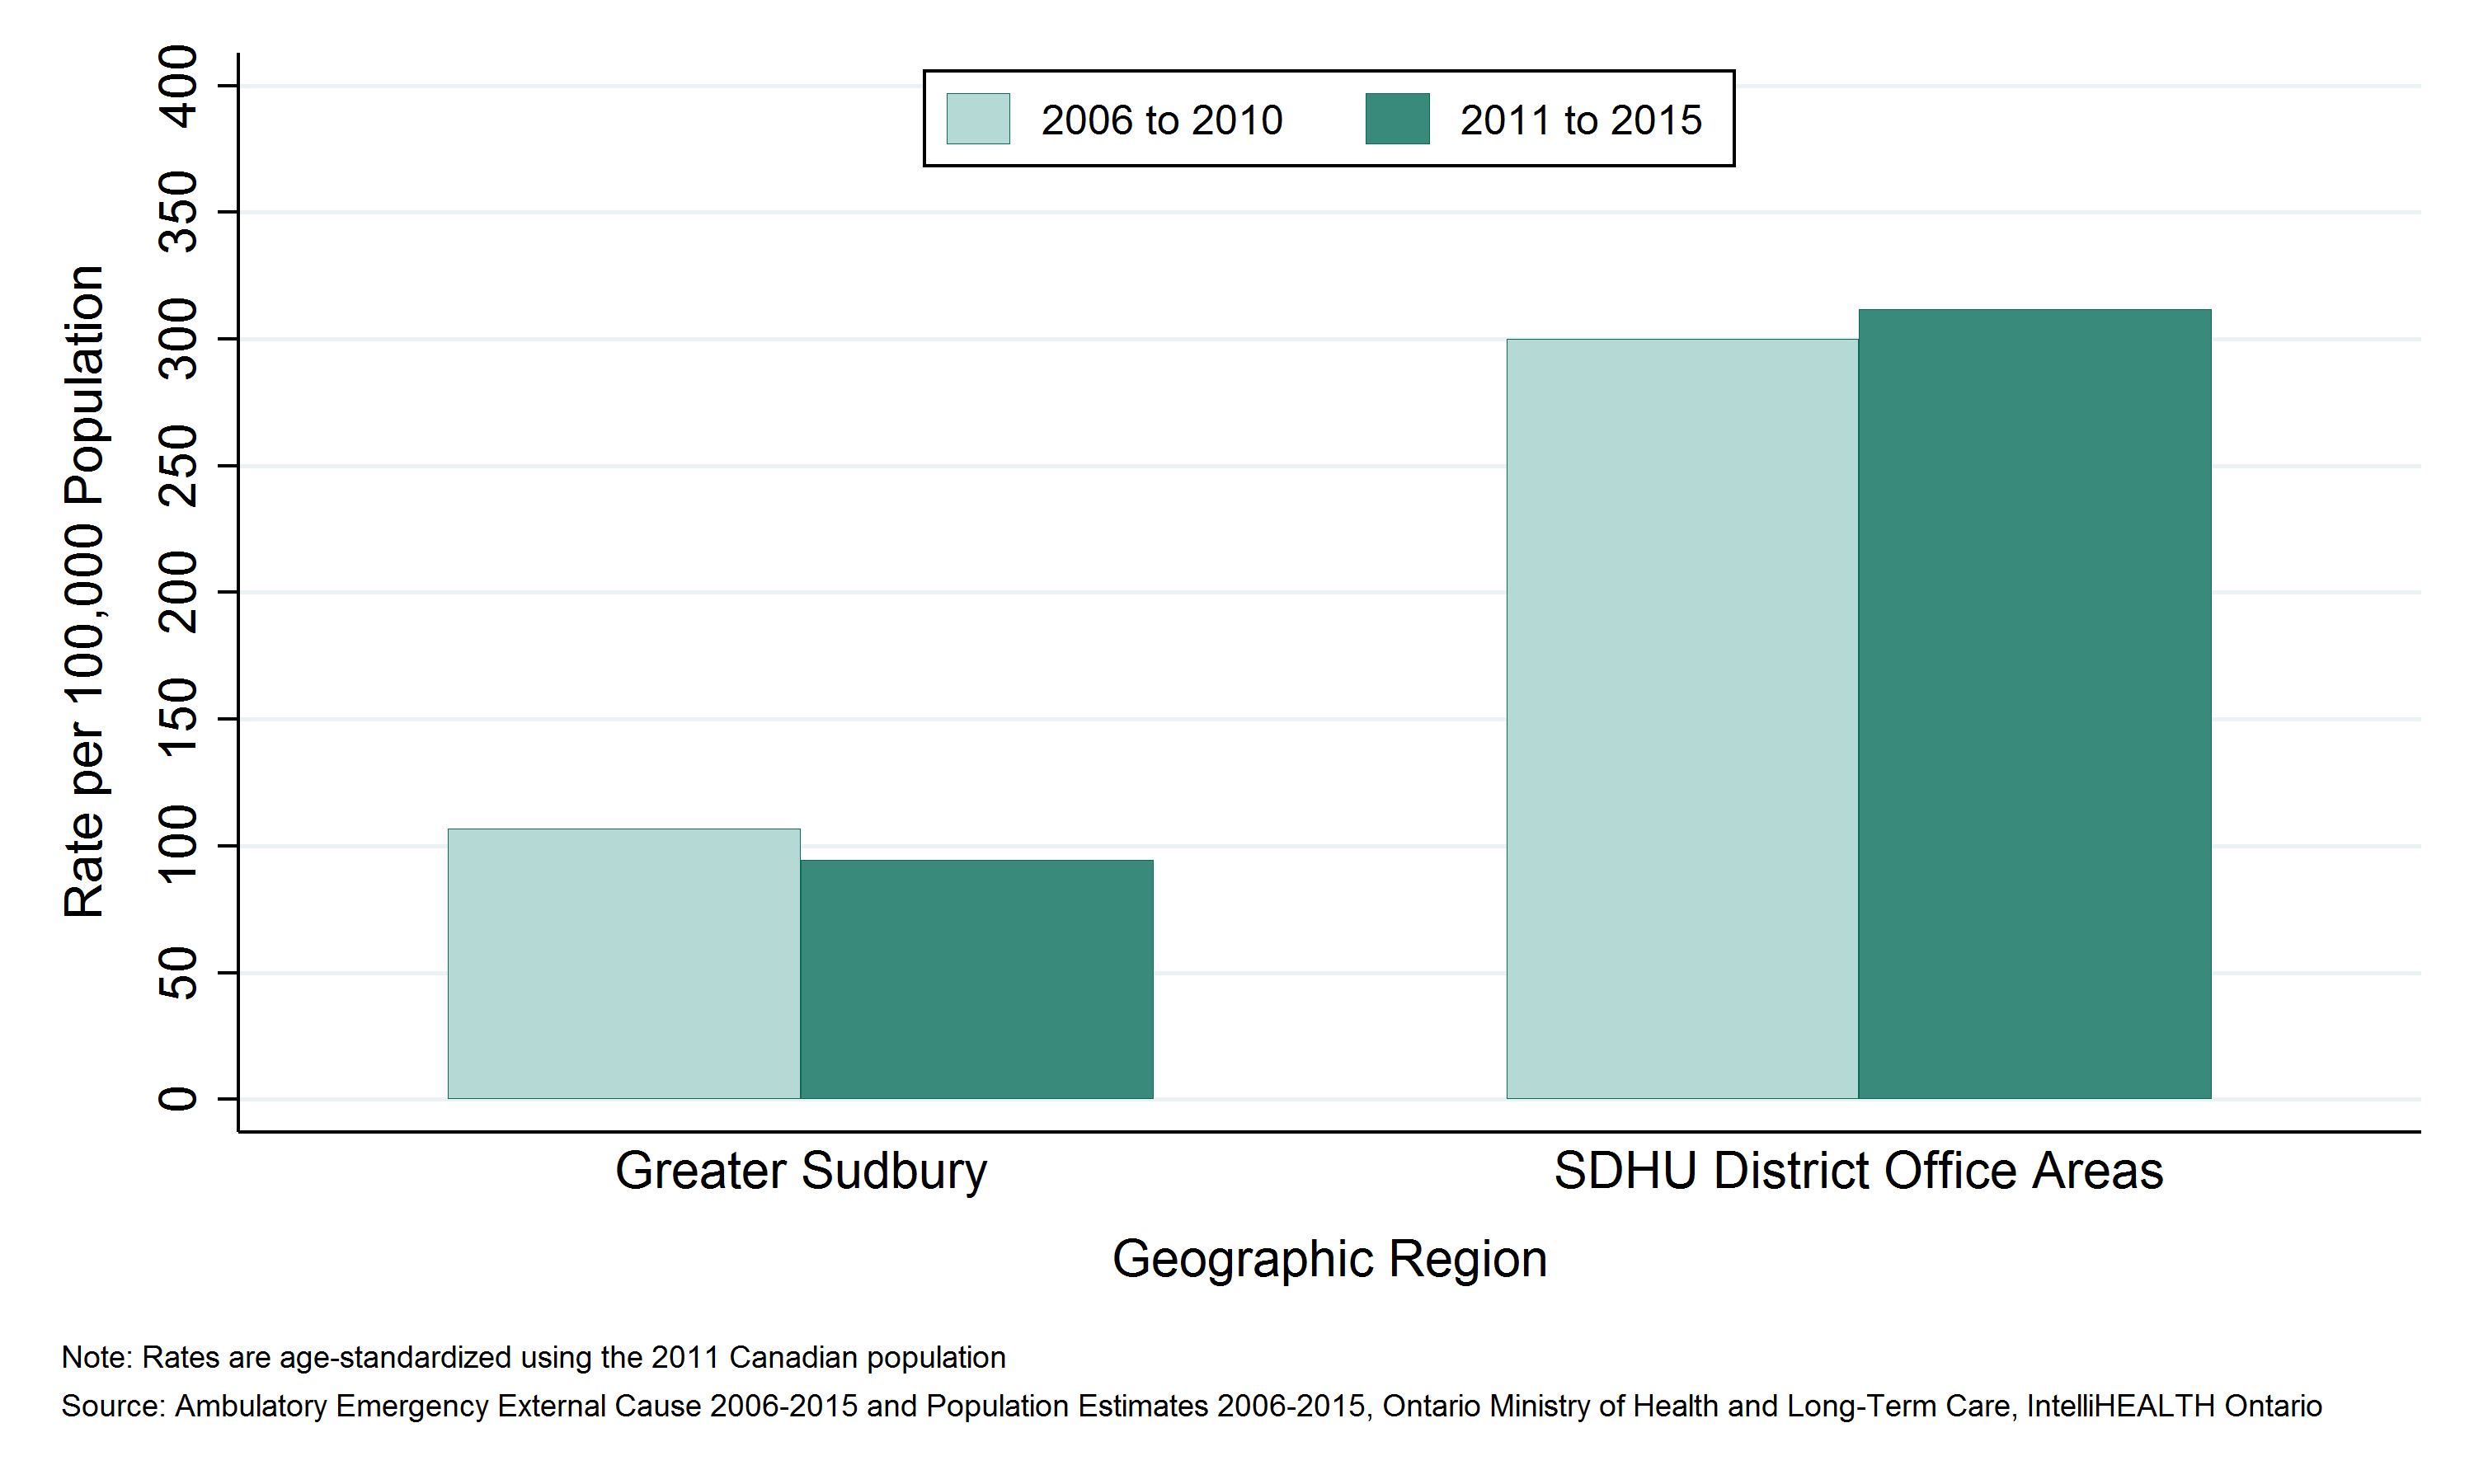
- The rate of ED visits due to fire and burns was 94 per 100,000 population per year in Greater Sudbury and 312 per 100,000 population per year in the SDHU district office areas between 2011 and 2015.
- The rate of ED visits due to fire and burns among residents of Greater Sudbury has been consistently lower than among residents in the SDHU district office areas.
- The rate of ED visits due to fire and burns among residents in both areas remained stable between 2006 to 2010 and 2011 to 2015.
Notes:
- Geographic areas and/or time periods in which there is less access to walk-in clinics and other alternatives to the local ED can be expected to have higher rates of injury-related ED visits than they would otherwise.
- Rates are age-standardized using the 2011 Canadian population.
- Data Source: Ambulatory Emergency External Cause 2006 to 2015 (extracted June 6, 2016) and Population Estimates 2006 to 2015 (extracted October 7, 2016), Ontario Ministry of Health and Long-Term Care, IntelliHEALTH Ontario.
Figure: Annual age-standardized rate of emergency department visits, fires and burns, by Greater Sudbury and outlying areas, 2006 to 2010 and 2011 to 2015

Table: Annual age-standardized rate of emergency department visits, fires and burns, by Greater Sudbury and outlying areas, 2006 to 2010 and 2011 to 2015
| Geographic Region | Rate per 100000 2006 to 2010 | Rate per 100000 2011 to 2015 |
| Greater Sudbury | 106.8 | 94.4 |
| SDHU District Office Areas | 300.1 | 311.6 |
Table: Annual number of emergency department visits, fires and burns, by Greater Sudbury and outlying areas, 2006 to 2010 and 2011 to 2015
| Geographic Region | Total Counts, 2006 to 2010 | Total Counts, 2011 to 2015 | Average Annual Counts, 2006 to 2010 | Average Annual Counts, 2011 to 2015 |
| Greater Sudbury | 875 | 764 | 175.0 | 152.8 |
| SDHU District Office Areas | 498 | 490 | 99.6 | 98.0 |
Emergency department (ED) visits due to fire and burns by sex
Key Findings:
- Between 2011 and 2015, there were 720 emergency department (ED) visits due to fire and burns among males, and 534 among females in the Sudbury & District Health Unit (SDHU) area, an average of 144 and 107 per year, respectively.
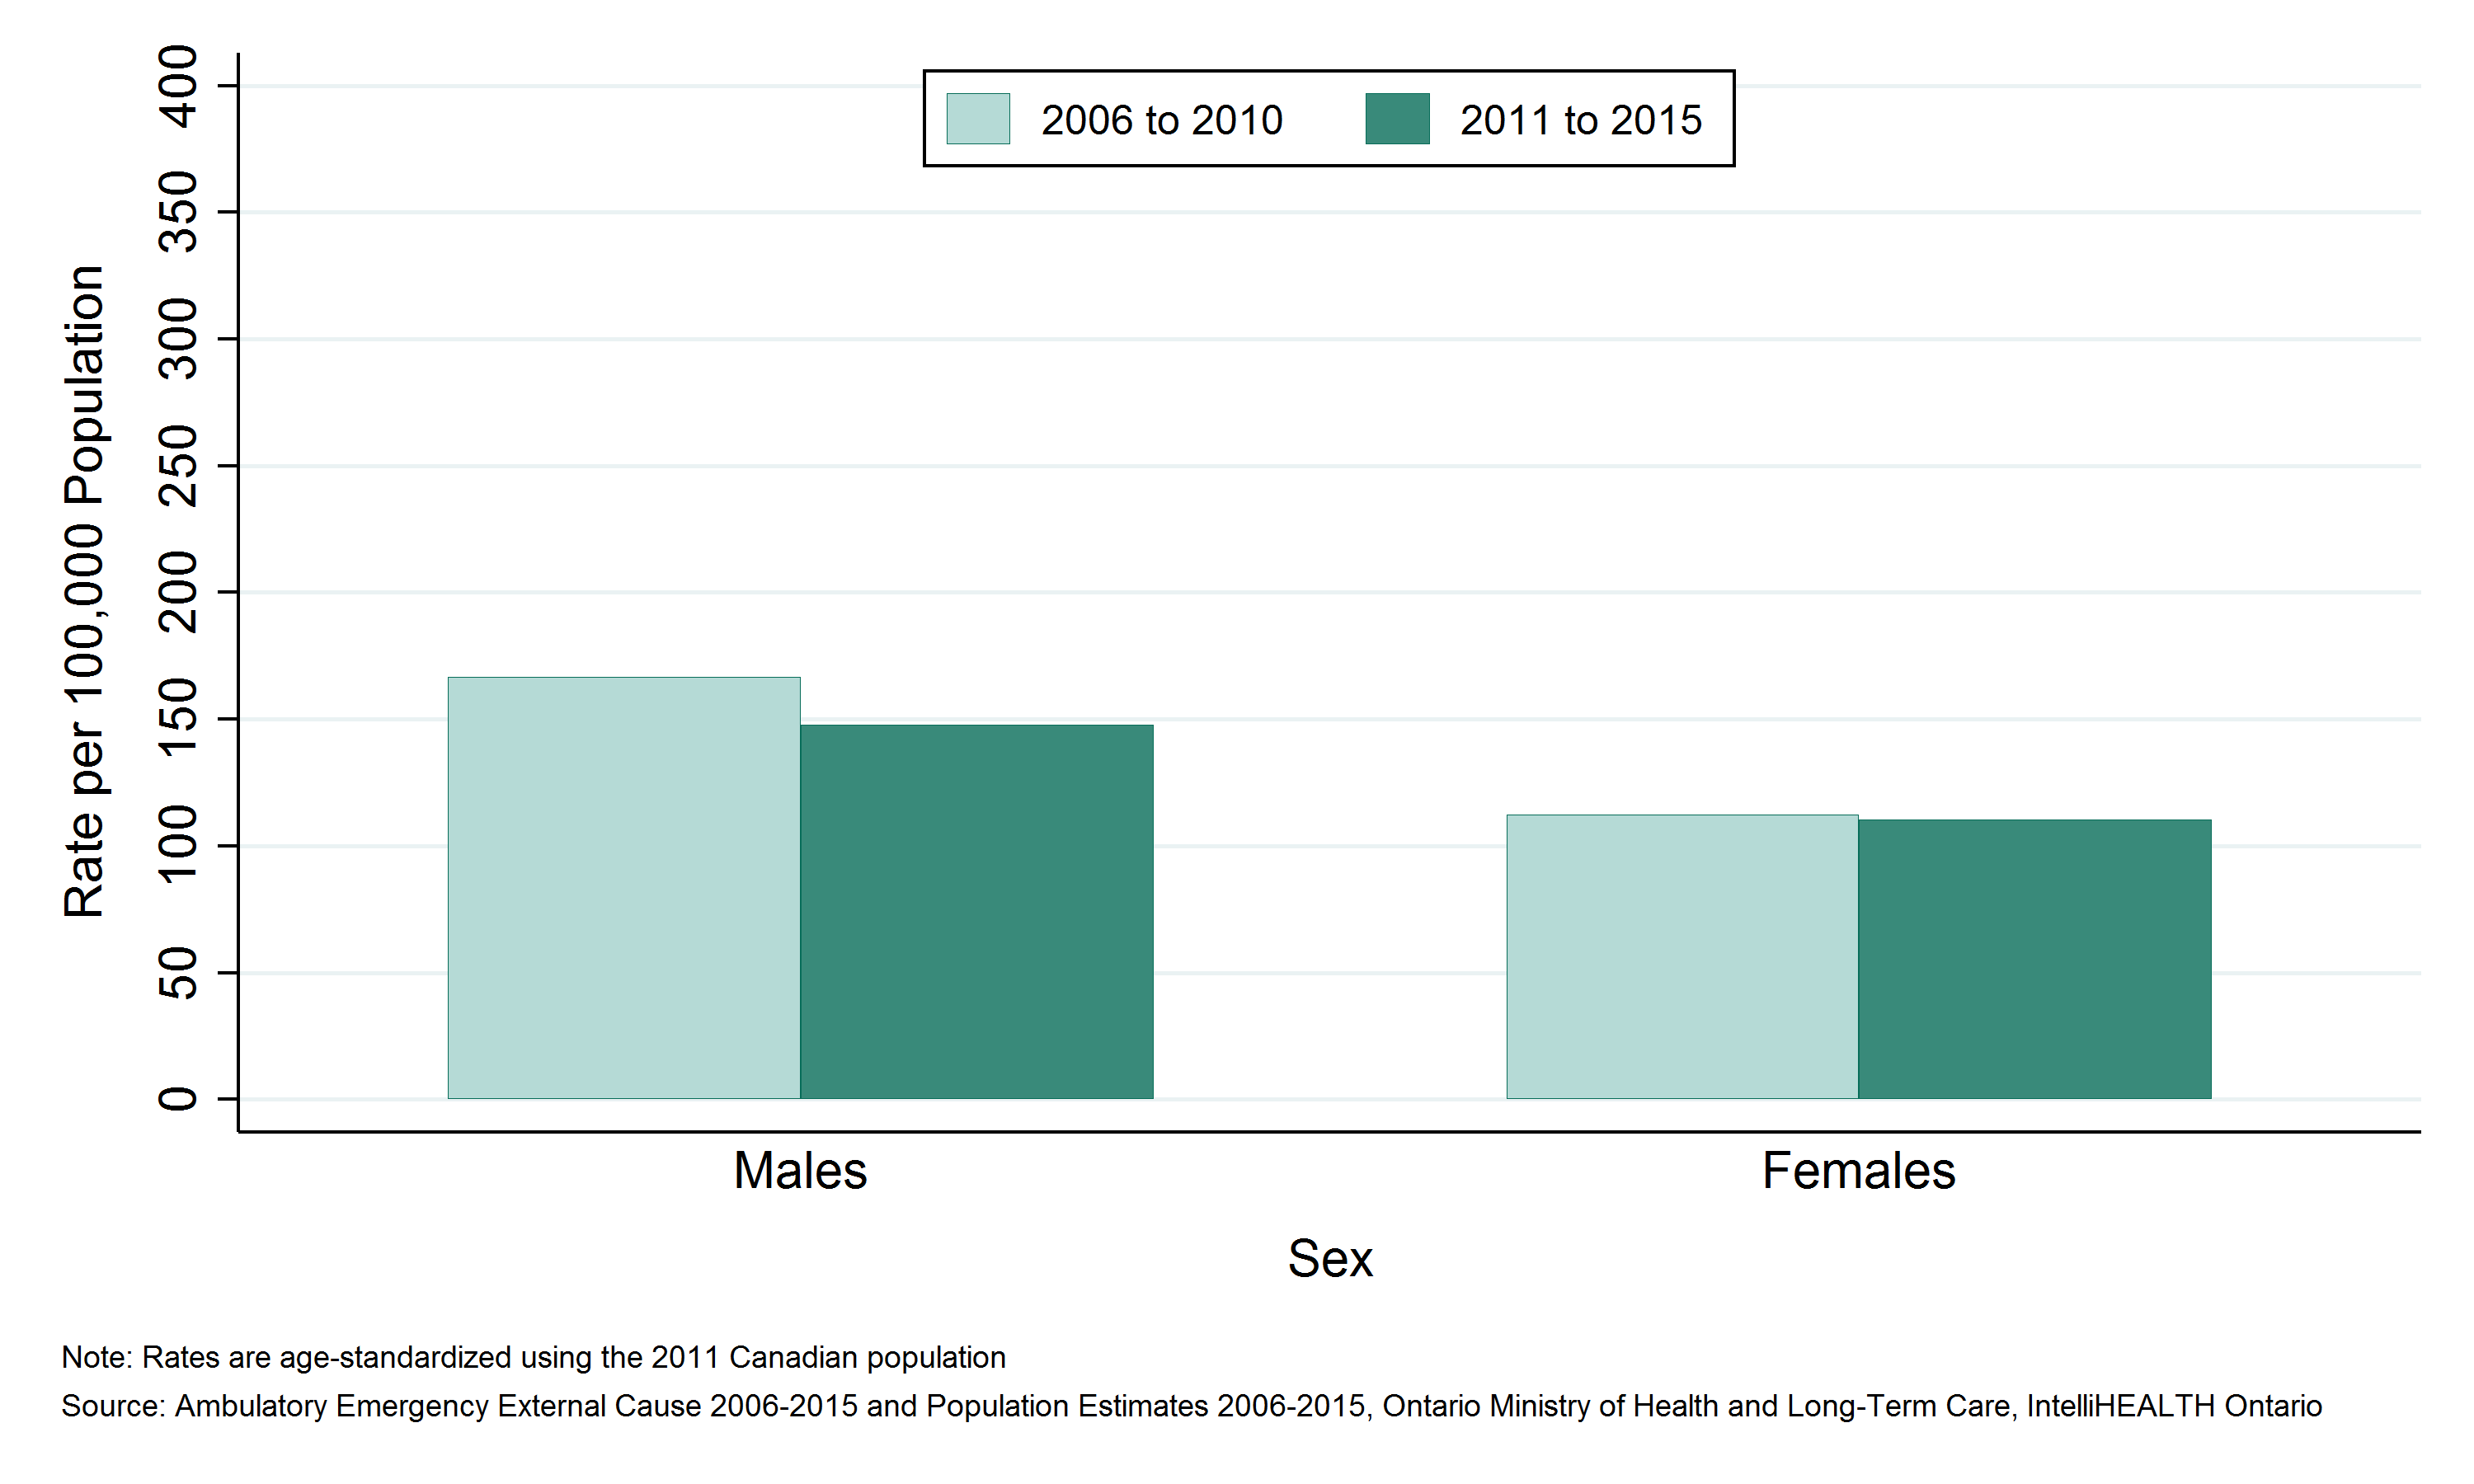
- The rate of ED visits due to fire and burns was 148 per 100,000 males per year and 110 per 100,000 females per year in the SDHU area between 2011 and 2015.
- The ED visits rate due to fire and burns among males has been consistently higher than the rate among females.
- In the SDHU area, the rate of ED visits due to fire and burns decreased slightly among males and remained stable among females over time between 2006 to 2010 and 2011 to 2015.
Notes:
- Geographic areas and/or time periods in which there is less access to walk-in clinics and other alternatives to the local ED can be expected to have higher rates of injury-related ED visits than they would otherwise.
- Rates are age-standardized using the 2011 Canadian population.
- Data Source: Ambulatory Emergency External Cause 2006 to 2015 (extracted June 6, 2016) and Population Estimates 2006 to 2015 (extracted October 7, 2016), Ontario Ministry of Health and Long-Term Care, IntelliHEALTH Ontario.
Figure: Annual age-standardized rate of emergency department visits, fires and burns, by sex, SDHU, 2006 to 2010 and 2011 to 2015

Table: Annual age-standardized rate of emergency department visits, fires and burns, by sex, SDHU, 2006 to 2010 and 2011 to 2015
| Sex | Rate per 100,000, 2006 to 2010 | Rate per 100,000, 2011 to 2015 |
| Males | 166.5 | 147.7 |
| Females | 112.3 | 110.3 |
Table: Annual number of emergency department visits, fires and burns, by sex, SDHU, 2006 to 2010 and 2011 to 2015
| Sex | Total Counts, 2006 to 2010 | Total Counts, 2011 to 2015 | Average Annual Counts, 2006 to 2010 | Average Annual Counts, 2011 to 2015 |
| Males | 820 | 720 | 164.0 | 144.0 |
| Females | 553 | 534 | 110.6 | 106.8 |
Emergency department (ED) visits due to fire and burns by age group
Key Findings:
- Among Sudbury & District Health Unit (SDHU) area residents, the 25 to 44 and 45 to 64 year age groups visited the emergency department (ED) due to fire and burns the most, with 338 and 339 ED visits between 2011 and 2015, respectively, or 68 ED visits per year on average.
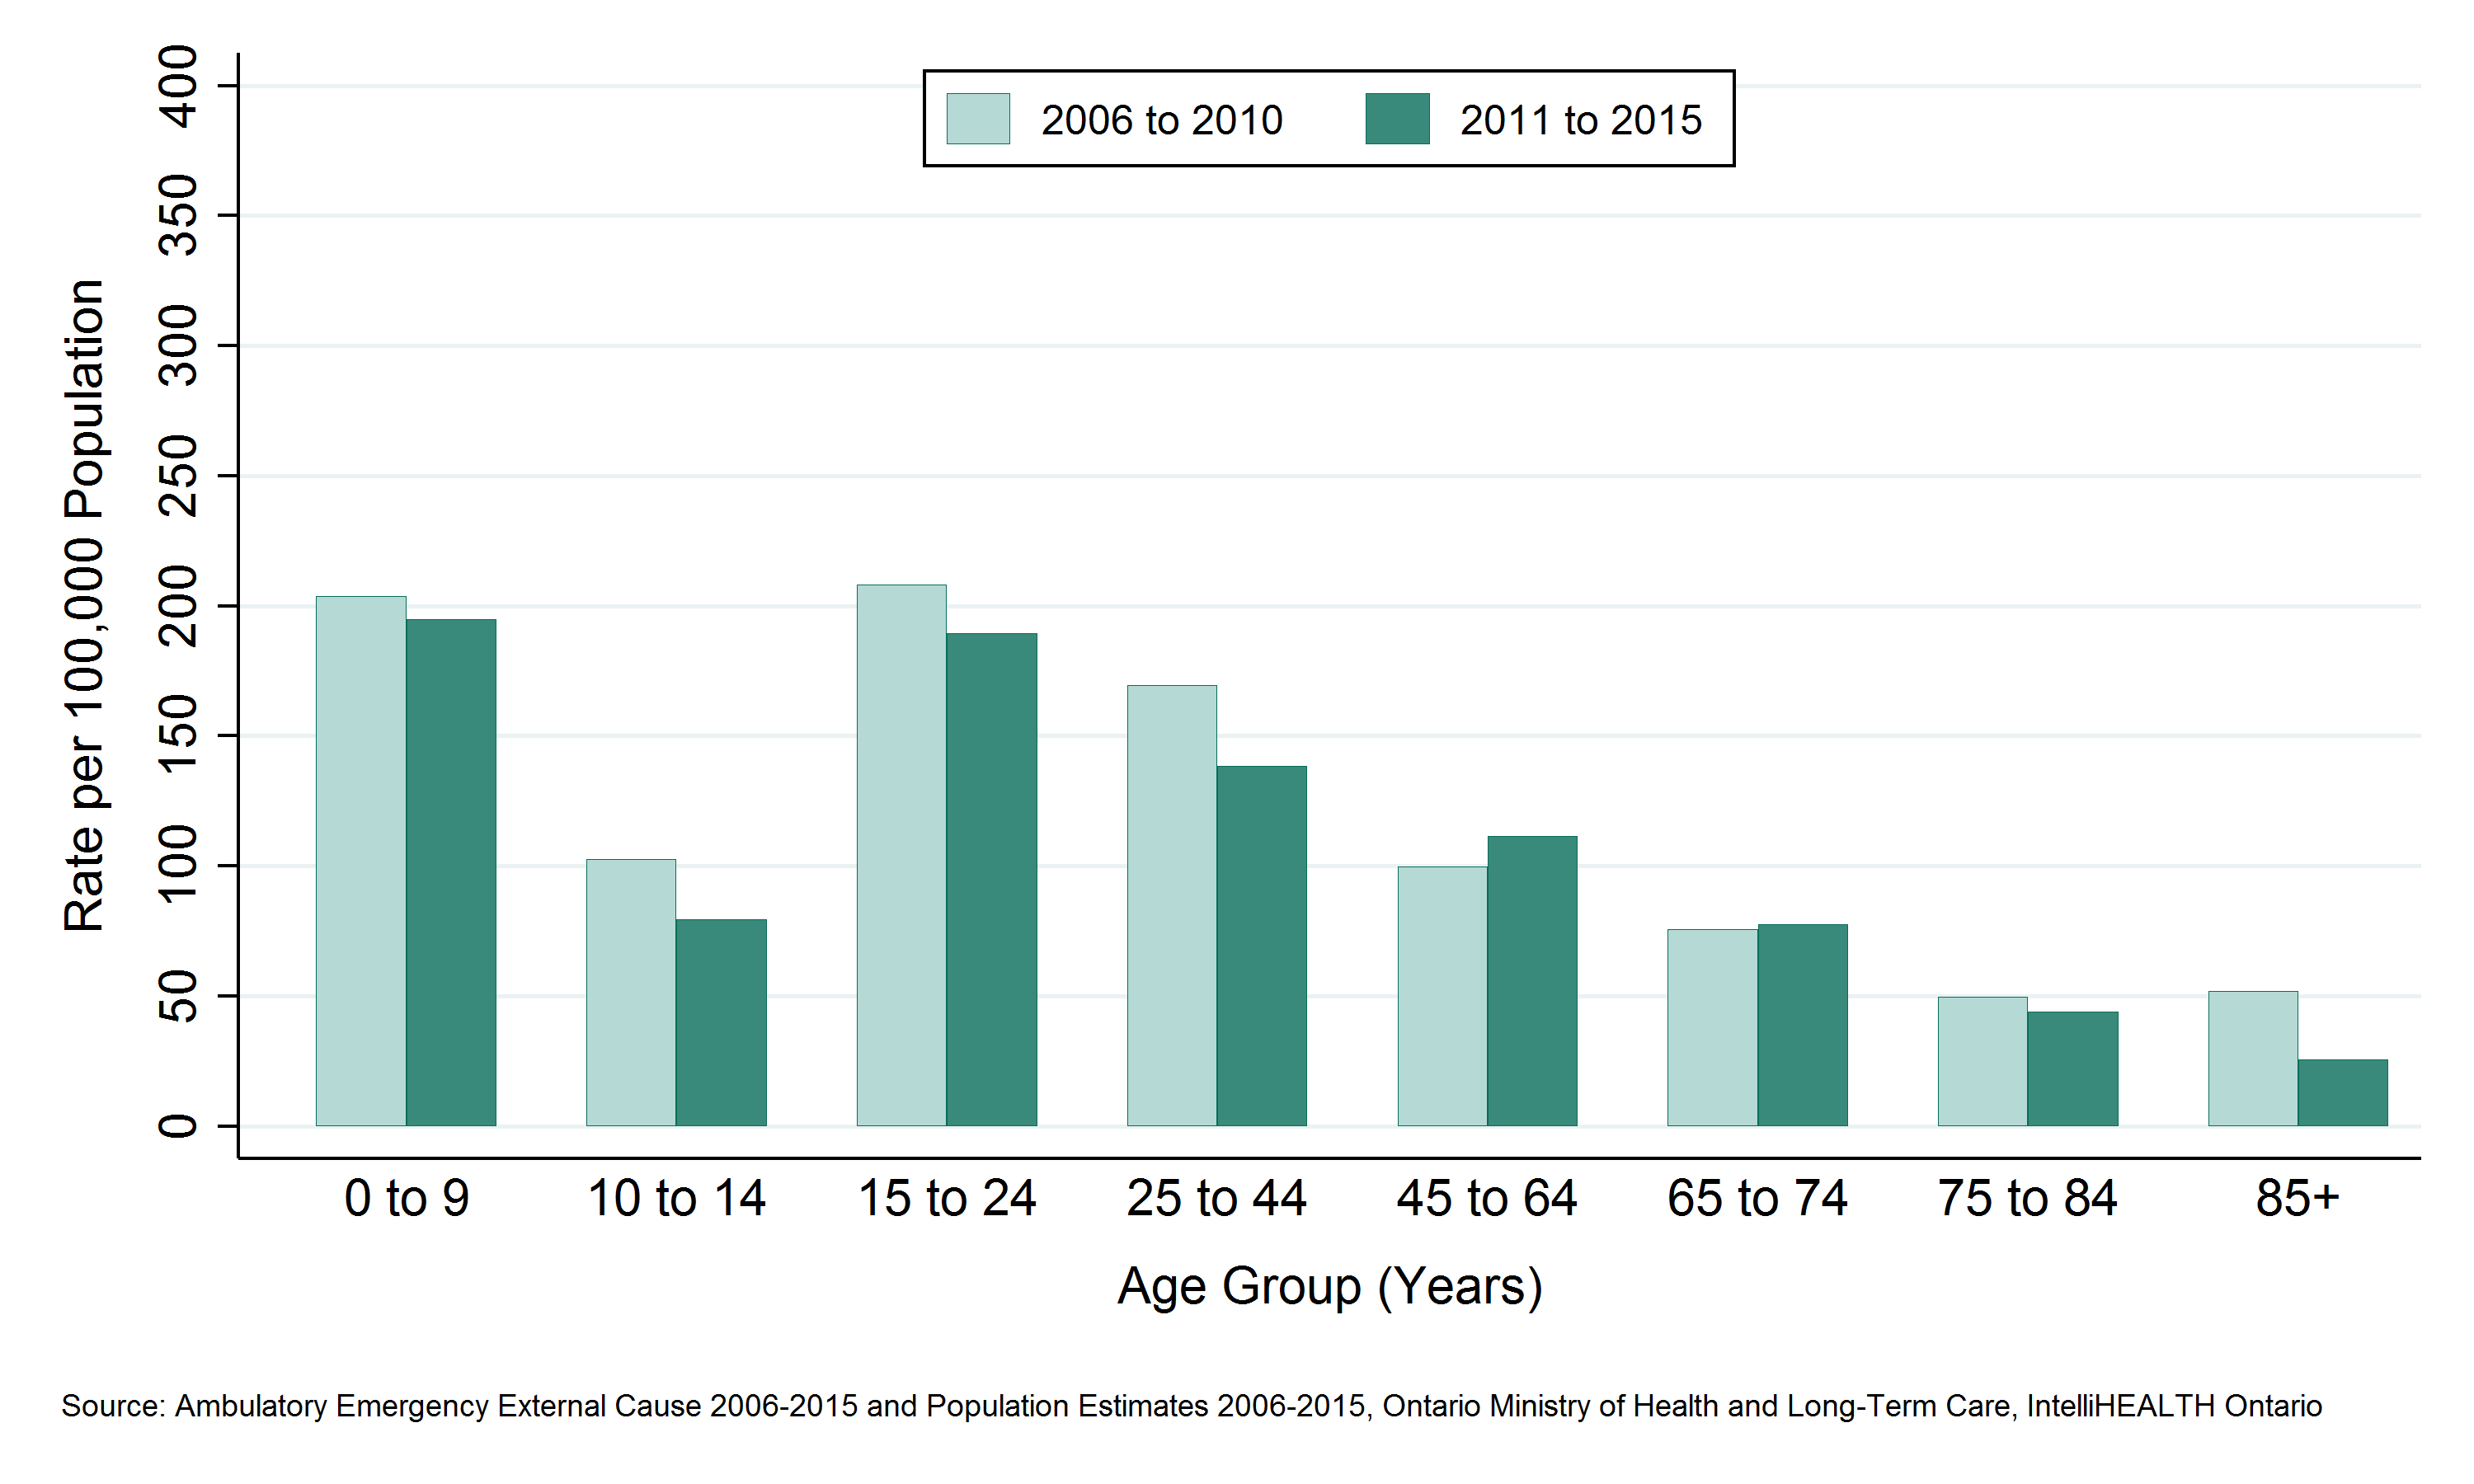
- Between 2011 and 2015, the 0 to 9 age group had the highest ED visits rate due to fire and burns with 194 ED visits per 100,000 population per year.
- Rates of ED visits due to fire and burns are highest among children and youth in the SDHU area, except the 10 to 14 year age group in which rates are lower. Rates then decrease with age throughout adulthood.
- In the SDHU area, the ED visits rate due to fire and burns decreased in the 10 to 14, 25 to 44, and 85 and over age groups, increased in the 45 to 64 age group, and remained stable for all other age groups between 2006 to 2010 and 2011 to 2015.
Notes:
- Geographic areas and/or time periods in which there is less access to walk-in clinics and other alternatives to the local ED can be expected to have higher rates of injury-related ED visits than they would otherwise.
- Data Source: Ambulatory Emergency External Cause 2006 to 2015 (extracted June 6, 2016) and Population Estimates 2006 to 2015 (extracted October 7, 2016), Ontario Ministry of Health and Long-Term Care, IntelliHEALTH Ontario.
Figure: Annual rate of emergency department visits, fires and burns, by age group, SDHU, 2006 to 2010 and 2011 to 2015

Table: Annual rate of emergency department visits, fires and burns, by age group, SDHU, 2006 to 2010 and 2011 to 2015
| Age Group | Rate per 100000, 2006 to 2010 | Rate per 100000, 2011 to 2015 |
| 0 to 9 | 203.8 | 194.9 |
| 10 to 14 | 102.6 | 79.5 |
| 15 to 24 | 208.3 | 189.5 |
| 25 to 44 | 169.4 | 138.3 |
| 45 to 64 | 99.6 | 111.6 |
| 65 to 74 | 75.7 | 77.6 |
| 75 to 84 | 49.7 | 44.1 |
| 85+ | 52.0 | 25.4 |
Table: Annual number of emergency department visits, fires and burns, by age group, SDHU, 2006 to 2010 and 2011 to 2015
| Age Group | Total Counts, 2006 to 2010 | Total Counts, 2011 to 2015 | Average Annual Counts, 2006 to 2010 | Average Annual Counts, 2011 to 2015 |
| 0 to 9 | 201 | 187 | 40.2 | 37.4 |
| 10 to 14 | 62 | 41 | 12.4 | 8.2 |
| 15 to 24 | 277 | 244 | 55.4 | 48.8 |
| 25 to 44 | 439 | 338 | 87.8 | 67.6 |
| 45 to 64 | 296 | 339 | 59.2 | 67.8 |
| 65 to 74 | 64 | 76 | 12.8 | 15.2 |
| 75 to 84 | 26 | 24 | 5.2 | 4.8 |
| 85+ | 8 | 5 | 1.6 | 1.0 |
Deaths due to fire and burns by geographic region
Key Findings:
- Among residents of the Sudbury & District Health Unit (SDHU) area, there was 9 deaths due to fire and burns between 2007 and 2011, an average of 2 per year.
- Between 2006 and 2015, the mortality rate due to fire and burns in the SDHU area was 1 deaths per 100,000 population per year.
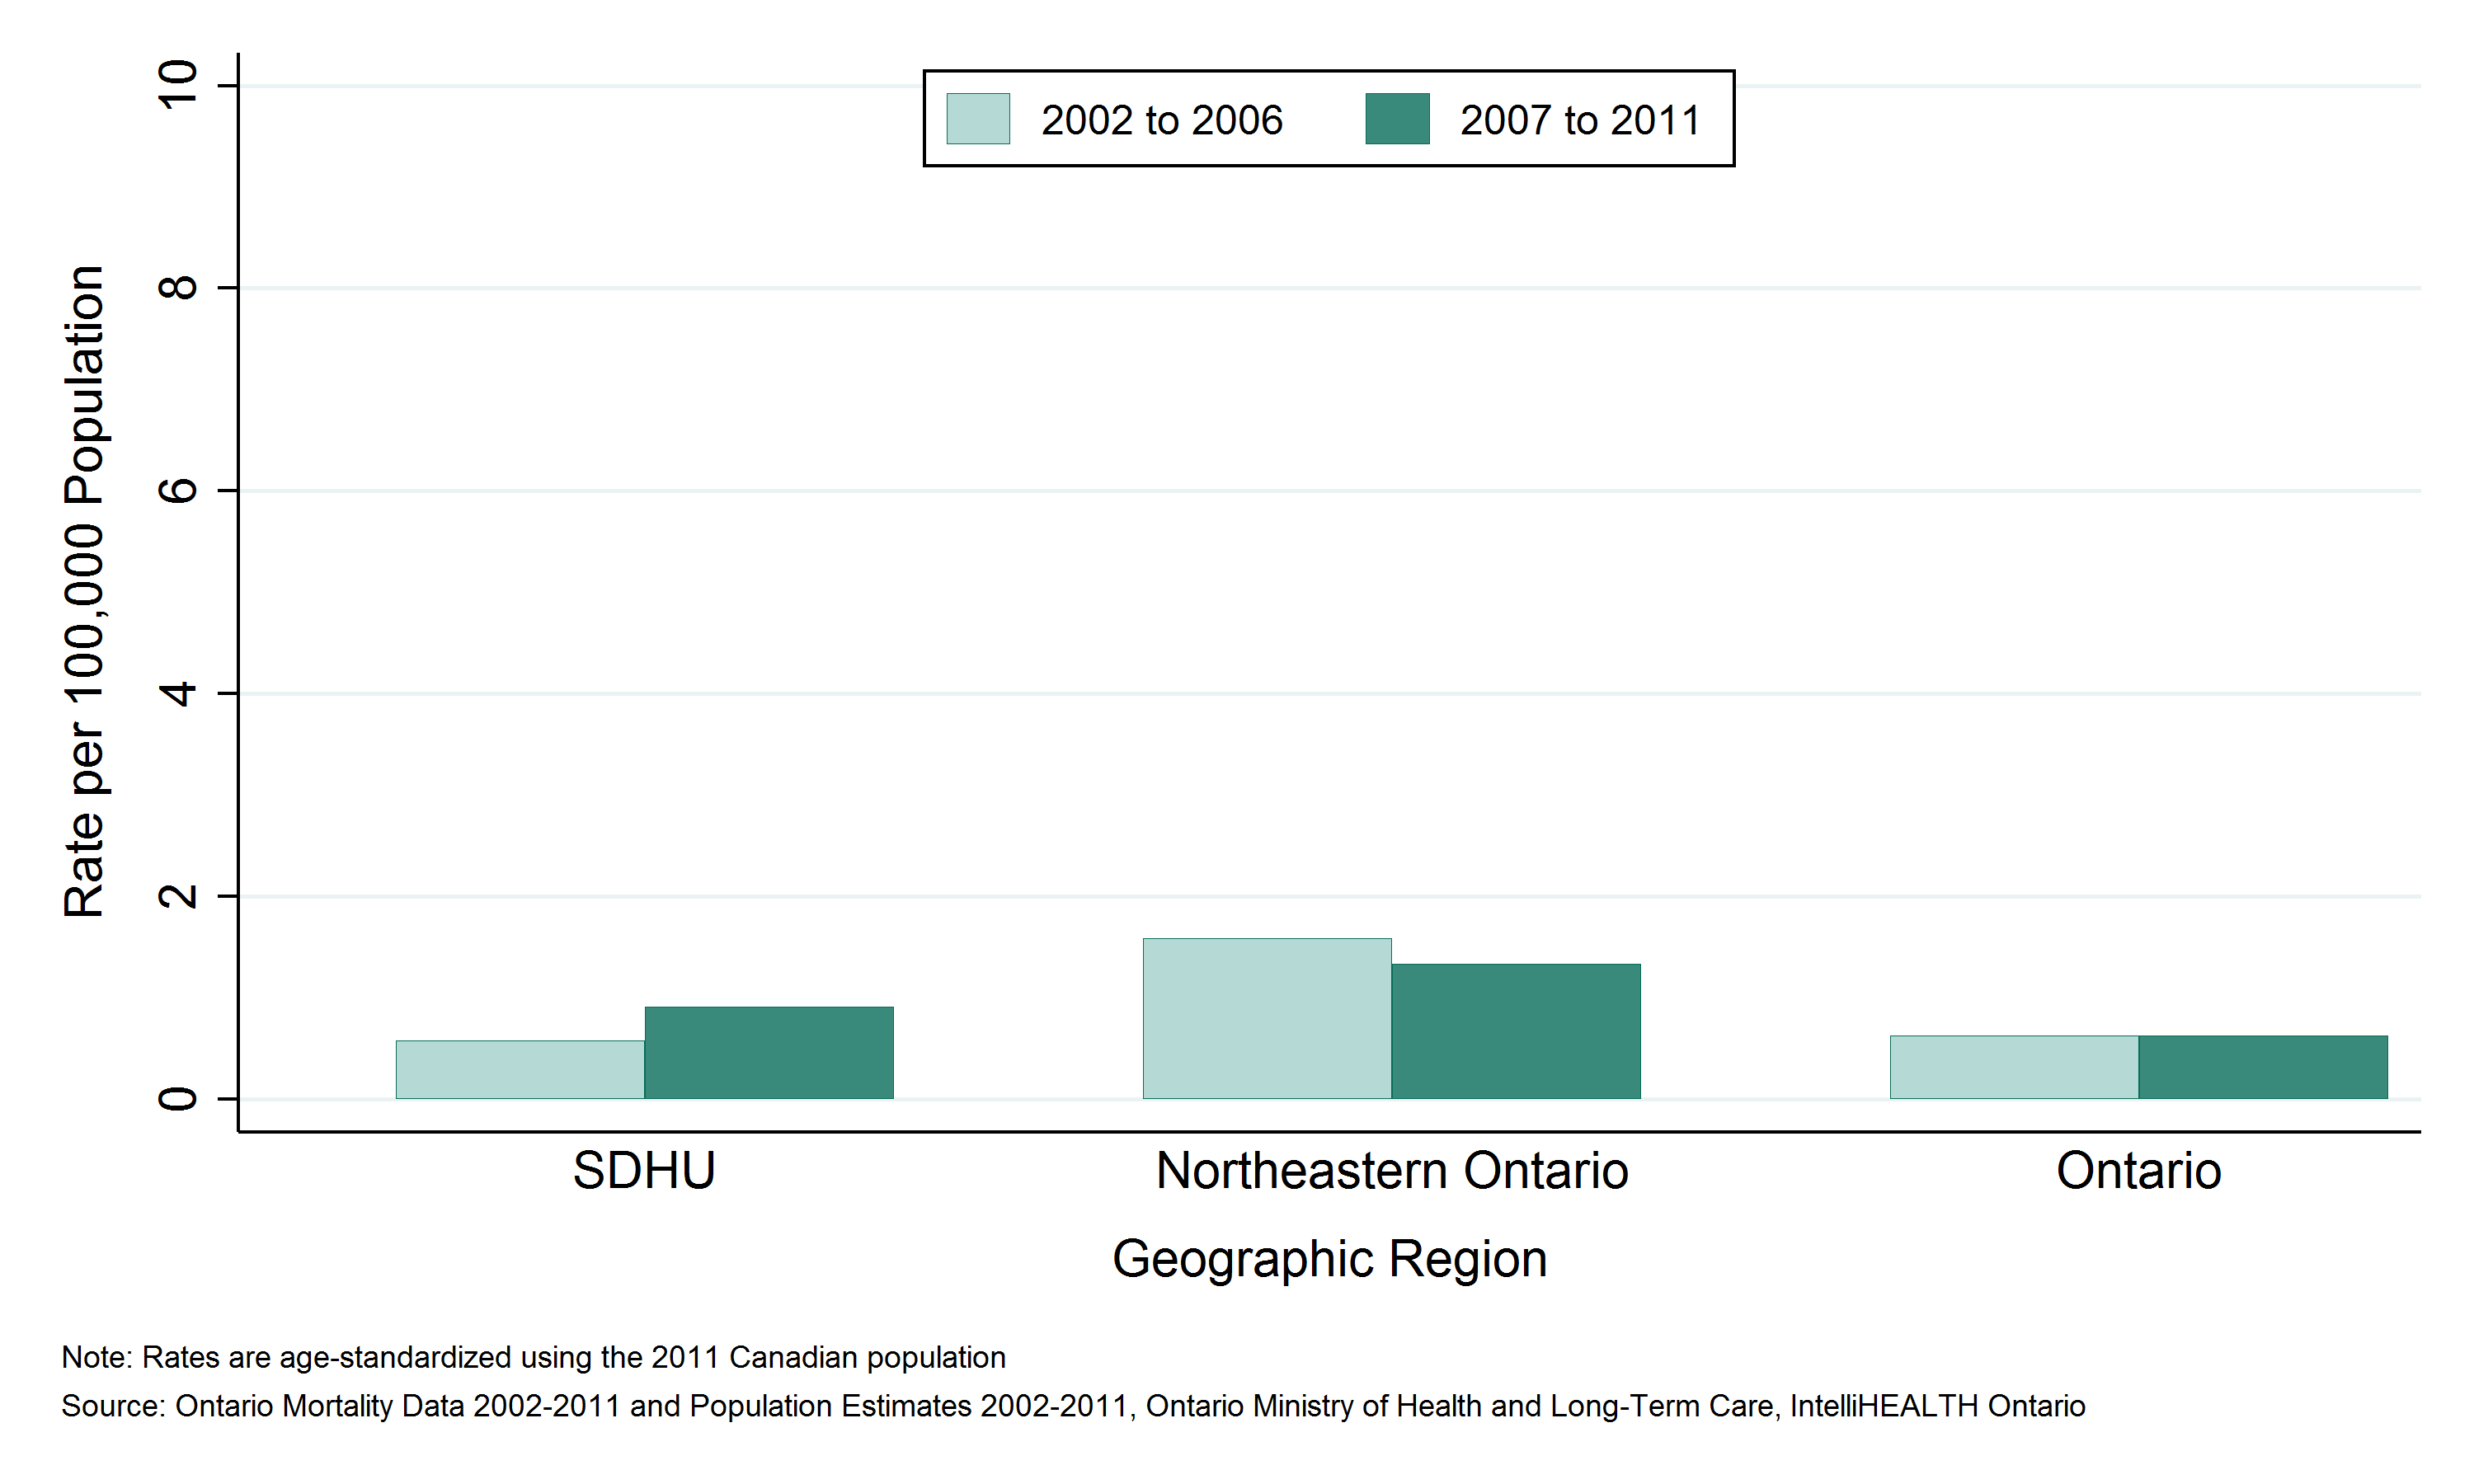
- The mortality rates due to fire and burns in the SDHU area, northeastern Ontario, and Ontario overall have been similar.
- Between 2002 to 2006 and 2007 to 2011, the mortality rate due to fire and burns in the SDHU area remained stable.
Notes:
- Rates are age-standardized using the 2011 Canadian population.
- Data Source: Ontario Mortality Data 2002 to 2011 (extracted June 6, 2016) and Population Estimates 2006 to 2015 (extracted October 7, 2016), Ontario Ministry of Health and Long-Term Care, IntelliHEALTH Ontario.
Figure: Annual age-standardized mortality rate, fire and burns, by geographic region, 2002 to 2006 and 2007 to 2011

Table: Annual age-standardized mortality rate, fire and burns, by geographic region, 2002 to 2006 and 2007 to 2011
| Geographic Region | Rate per 100,000 2002 to 2006 | Rate per 100,000 2007 to 2011 |
| SDHU | 0.6 | 0.9 |
| Northeast | 1.6 | 1.3 |
| Ontario | 0.6 | 0.6 |
Table: Annual number of deaths, fire and burns, by geographic region, 2002 to 2006 and 2007 to 2011
| Geographic Region | Total Counts 2002 to 2006 | Total Counts 2007 to 2011 | Average Annual Counts, 2002 to 2006 | Average Annual Counts, 2007 to 2011 |
| SDHU | 6 | 9 | 1.2 | 1.8 |
| Northeast | 45 | 38 | 9.0 | 7.6 |
| Ontario | 365 | 395 | 73.0 | 79.0 |
Potential years of life lost (PYLL) due to fire and burns by geographic region
Key Findings:
- Between 2006 and 2015, Sudbury & District Health Unit (SDHU) area residents lost 305 years of potential life due to deaths from fire and burns before the age of 75, an average of 61 per year.
- The rate of potential years of life lost (PYLL) Among Sudbury & District Health Unit (SDHU) area residents due to fire and burns was 33 PYLL per 100,000 population per year.
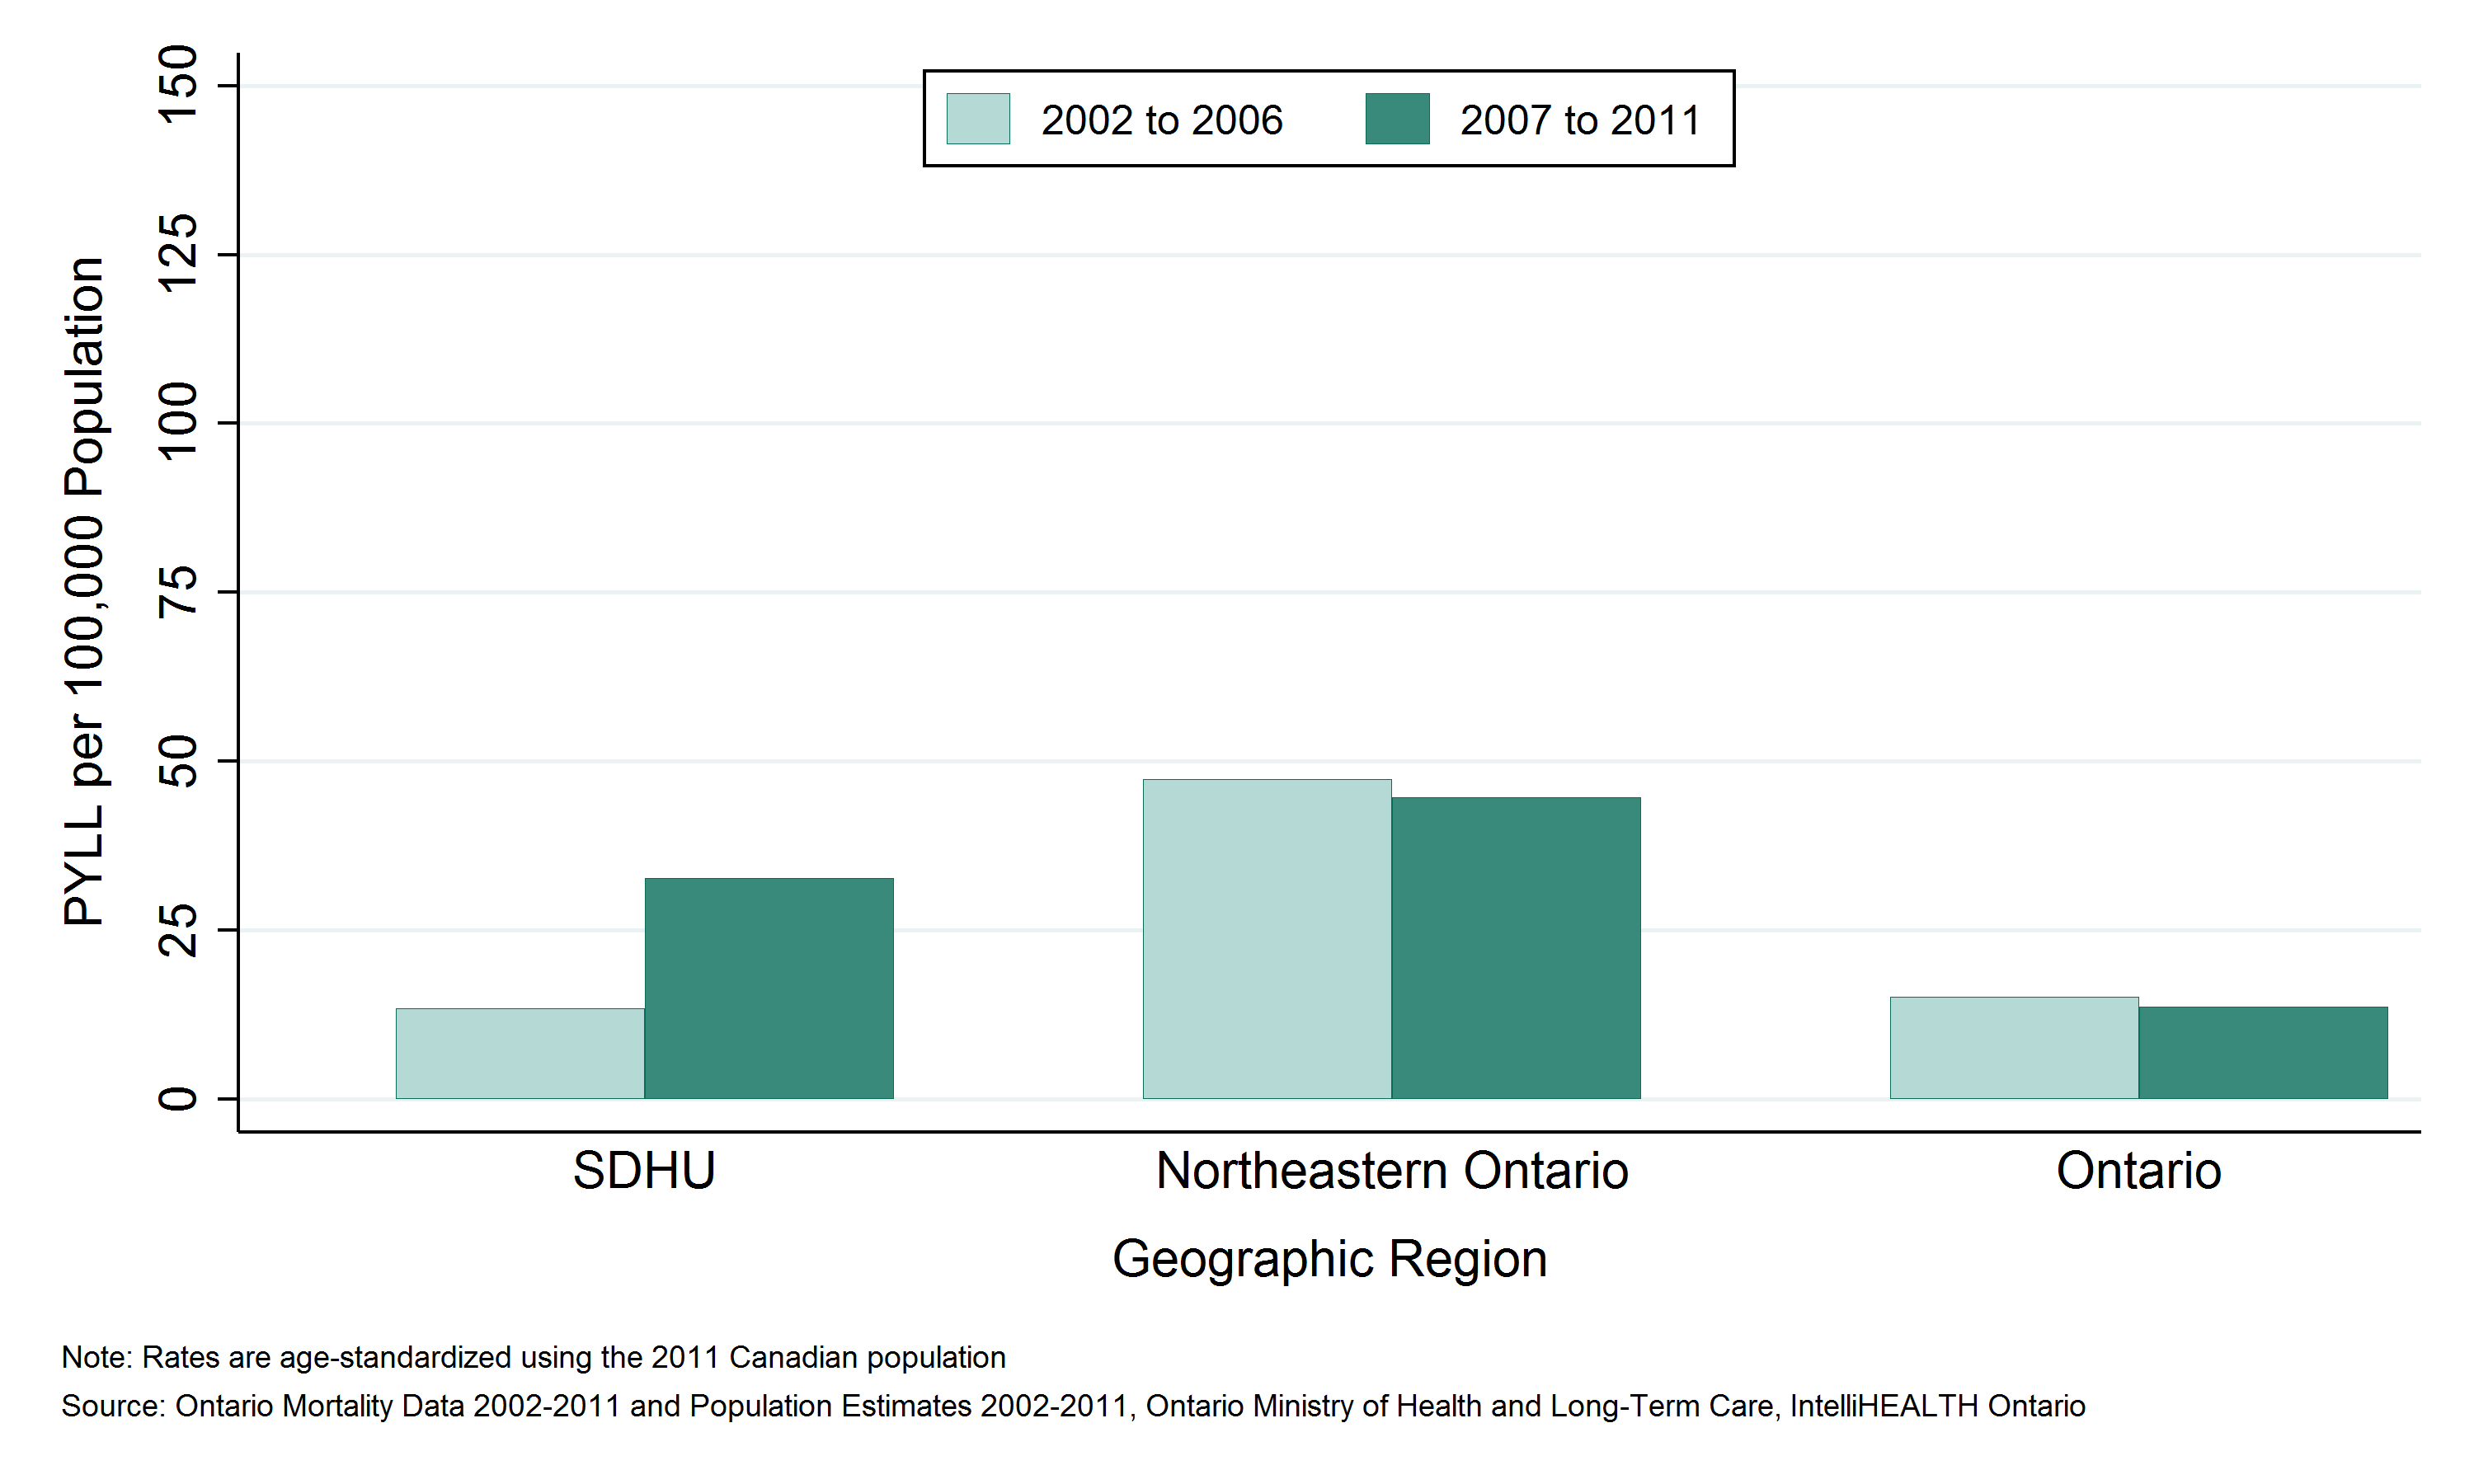
- The rate of PYLL due to fire and burns in the SDHU area was lower than that in northeastern Ontario, while rates in both areas were higher than the rate in Ontario overall.
- Between 2002 to 2006 and 2007 to 2011, the rate of PYLL due to fire and burns in the SDHU increased.
Notes:
- Rates are age-standardized using the 2011 Canadian population.
- Data Source: Ontario Mortality Data 2002 to 2011 (extracted June 6, 2016) and Population Estimates 2006 to 2015 (extracted October 7, 2016), Ontario Ministry of Health and Long-Term Care, IntelliHEALTH Ontario.
Figure: Annual age-standardized rate potential years of life lost (PYLL), fire and burns, by geographic region, 2002 to 2006 and 2007 to 2011
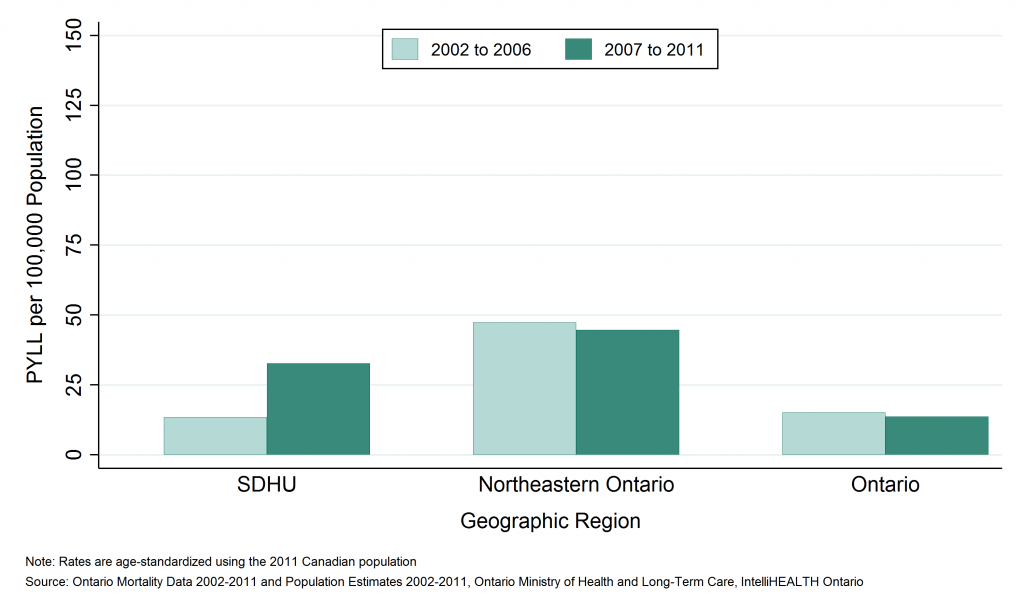
Table: Annual age-standardized rate potential years of life lost (PYLL), fire and burns, by geographic region, 2002 to 2006 and 2007 to 2011
| Geographic Region | Rate per 100,000, 2002 to 2006 | Rate per 100,000, 2007 to 2011 |
| SDHU | 13.5 | 32.7 |
| Northeast | 47.3 | 44.6 |
| Ontario | 15.1 | 13.7 |
Table: Annual number of potential years of life lost (PYLL), fire and burns, by geographic region, 2002 to 2006 and 2007 to 2011
| Geographic Region | Total PYLL, 2002 to 2006 | Total PYLL, 2007 to 2011 | Average Annual Counts, 2002 to 2006 | Average Annual Counts, 2007 to 2011 |
| SDHU | 139 | 305 | 27.8 | 61.0 |
| Northeast | 1,292 | 1,149 | 258.4 | 229.8 |
| Ontario | 9,317 | 8,605 | 1,863.4 | 1,721.0 |
This item was last modified on July 25, 2017