Cycling injuries
Injuries in this section include those to pedal cyclists injured in collisions with motor vehicles, non-motor vehicles, other cyclists, animal riders, animal-drawn vehicles, fixed or stationary objects, or in non-collision events such as a fall from the bicycle.
Emergency department (ED) visits due to cycling injuries by geographic region
Key Findings:
- Among residents of the Sudbury & District Health Unit (SDHU) area, there were 310 emergency department (ED) visits due to cycling injuries in 2015.
- In 2015, the ED visits rate due to cycling injuries in the SDHU area was 168 per 100,000 population per year.
- The rates of ED visits due to cycling injuries in the SDHU area have been consistently lower than that of northeastern Ontario, and similar to the rate for Ontario overall.
- Between 2006 and 2015, the ED visits rate due to cycling injuries in the SDHU area decreased slightly.
Notes:
- Geographic areas and/or time periods in which there is less access to walk-in clinics and other alternatives to the local ED can be expected to have higher rates of injury-related ED visits than they would otherwise.
- Rates are age-standardized using the 2011 Canadian population.
- Data Source: Ambulatory Emergency External Cause 2006 to 2015 (extracted June 6, 2016) and Population Estimates 2006 to 2015 (extracted October 7, 2016), Ontario Ministry of Health and Long-Term Care, IntelliHEALTH Ontario.
Figure: Annual age-standardized rate of emergency department visits, cycling injuries, by geographic region, 2006 to 2015
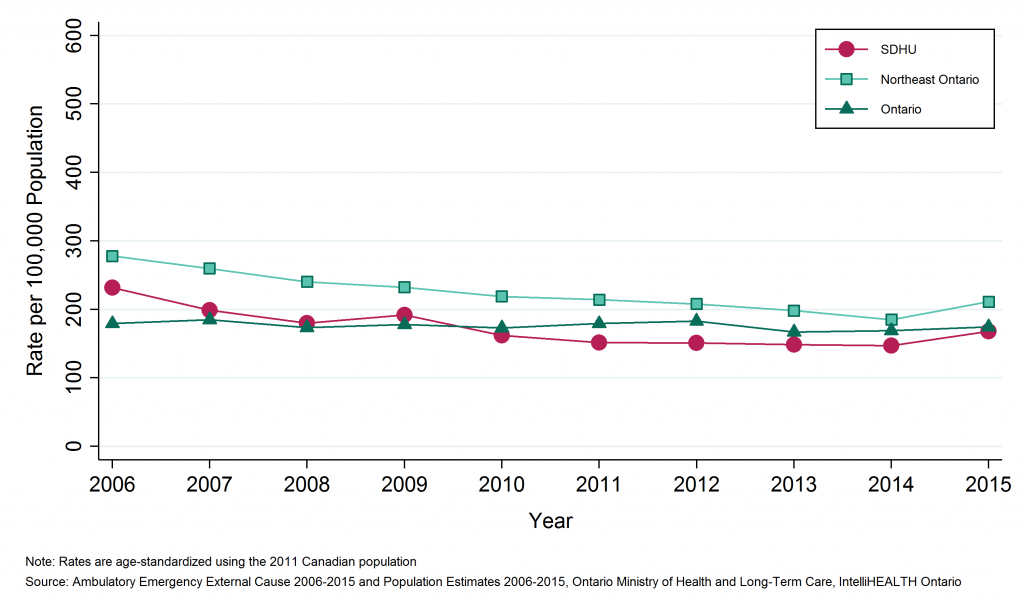
Table: Annual age-standardized rate of emergency department visits, cycling injuries, by geographic region, 2006 to 2015
| Geographic Region | 2006 | 2007 | 2008 | 2009 | 2010 | 2011 | 2012 | 2013 | 2014 | 2015 |
| SDHU | 231.6 | 198.9 | 179.8 | 191.7 | 161.8 | 151.5 | 150.8 | 148.8 | 146.9 | 168.0 |
| Northeast | 277.9 | 259.7 | 240.3 | 232.3 | 218.9 | 214.2 | 208.0 | 198.2 | 185.1 | 211.3 |
| Ontario | 179.2 | 185.0 | 173.6 | 177.8 | 173.1 | 179.2 | 182.9 | 167.0 | 168.9 | 174.4 |
Table: Annual number of emergency department visits, cycling injuries, by geographic region, 2006 to 2015
| Geographic Region | 2006 | 2007 | 2008 | 2009 | 2010 | 2011 | 2012 | 2013 | 2014 | 2015 |
| SDHU | 476 | 407 | 364 | 383 | 317 | 295 | 292 | 280 | 274 | 310 |
| Northeast | 1,630 | 1,502 | 1,368 | 1,302 | 1,210 | 1,167 | 1,123 | 1,046 | 965 | 1,095 |
| Ontario | 23,963 | 24,734 | 23,202 | 23,785 | 23,191 | 24,069 | 24,675 | 22,571 | 22,934 | 23,728 |
Emergency department (ED) visits due to cycling injuries by Greater Sudbury and outlying areas
Key Findings:
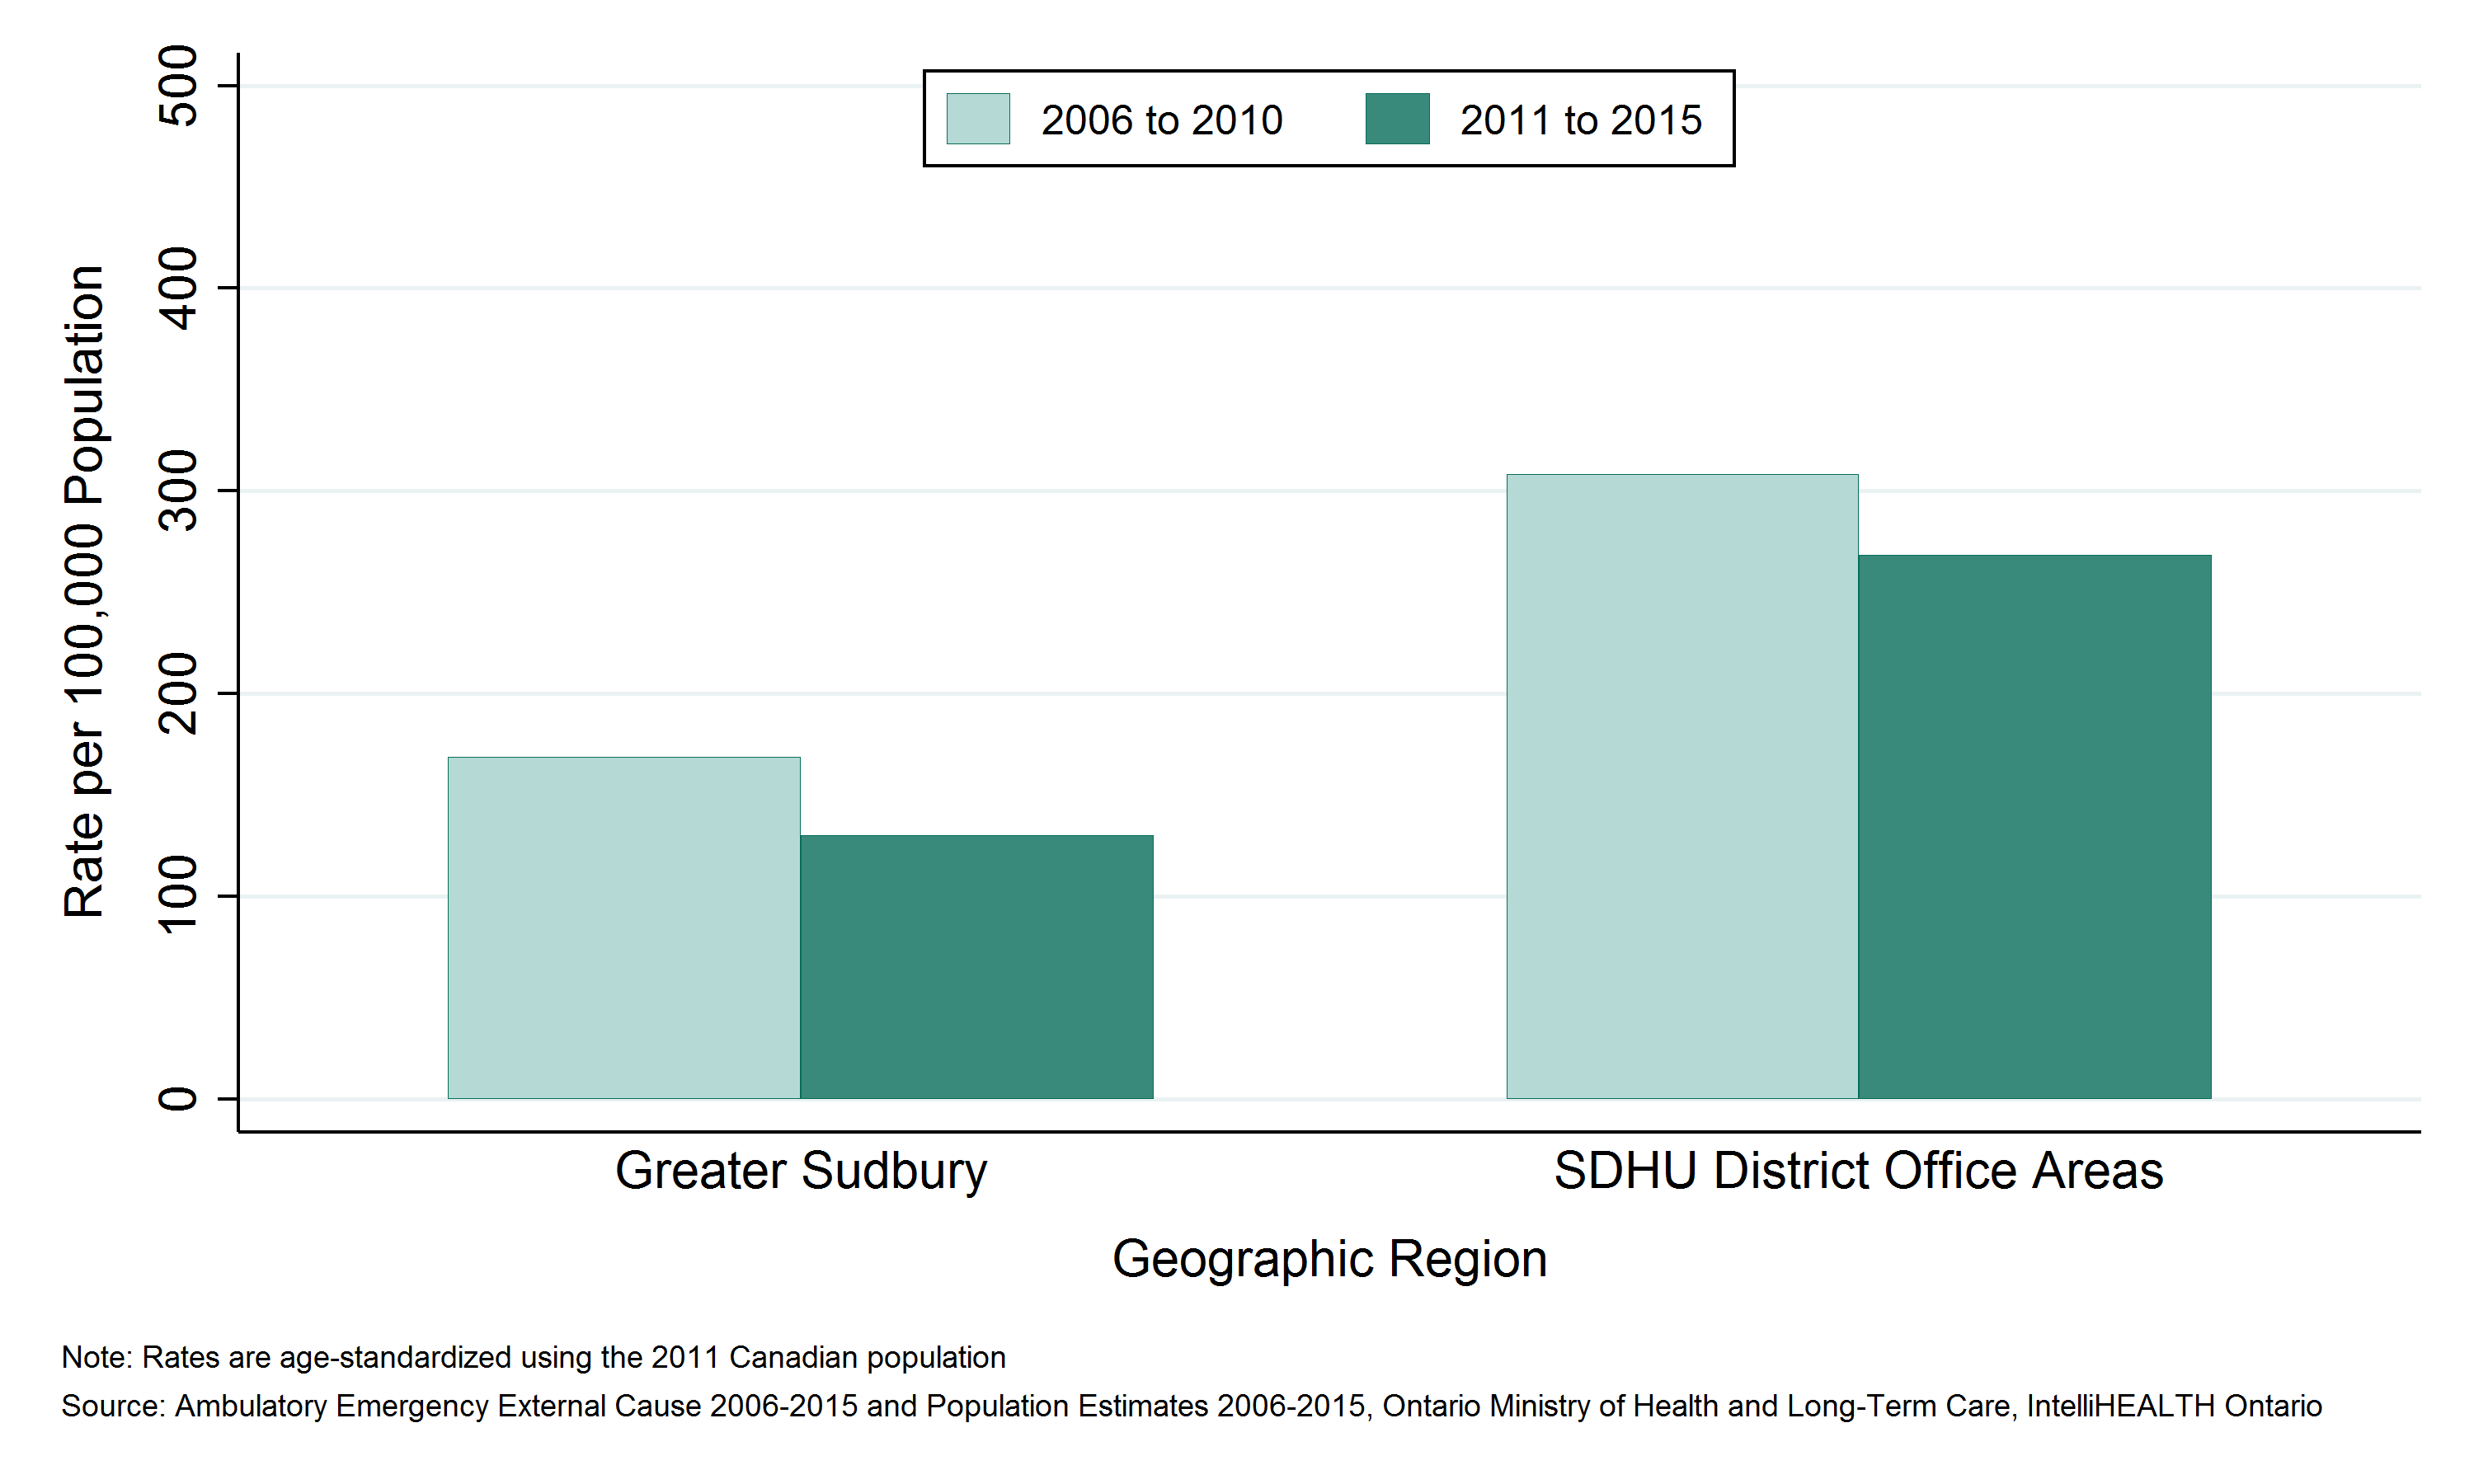
- Between 2011 and 2015, there were 1,033 emergency department (ED) visits due to cycling injuries among residents of Greater Sudbury and 418 ED visits among residents of the SDHU district office areas, an average of 207 and 84 per year, respectively.
- The rate of ED visits due to cycling injuries was 130 per 100,000 population per year in Greater Sudbury and 269 per 100,000 population per year in the SDHU district office areas between 2011 and 2015.
- The rate of ED visits due to cycling injuries among residents of Greater Sudbury has been consistently lower than among residents in the SDHU district office areas.
- The rate of ED visits due to cycling injuries among residents in both Greater Sudbury and the SDHU district office areas decreased between 2006 to 2010 and 2011 to 2015.
Notes:
- Geographic areas and/or time periods in which there is less access to walk-in clinics and other alternatives to the local ED can be expected to have higher rates of injury-related ED visits than they would otherwise.
- Rates are age-standardized using the 2011 Canadian population.
- Data Source: Ambulatory Emergency External Cause 2006 to 2015 (extracted June 6, 2016) and Population Estimates 2006 to 2015 (extracted October 7, 2016), Ontario Ministry of Health and Long-Term Care, IntelliHEALTH Ontario.
Figure: Annual age-standardized rate of emergency department visits, cycling injuries, by Greater Sudbury and outlying areas, 2006 to 2010 and 2011 to 2015

Table: Annual age-standardized rate of emergency department visits, cycling injuries, by Greater Sudbury and outlying areas, 2006 to 2010 and 2011 to 2015
| Geographic Region | Rate per 100000 2006 to 2010 | Rate per 100000 2011 to 2015 |
| Greater Sudbury | 168.9 | 130.2 |
| SDHU District Office Areas | 308.4 | 268.6 |
Table: Annual number of emergency department visits, cycling injuries, by Greater Sudbury and outlying areas, 2006 to 2010 and 2011 to 2015
| Geographic Region | Total Counts, 2006 to 2010 | Total Counts, 2011 to 2015 | Average Annual Counts, 2006 to 2010 | Average Annual Counts, 2011 to 2015 |
| Greater Sudbury | 1,409 | 1,033 | 281.8 | 206.6 |
| SDHU District Office Areas | 538 | 418 | 107.6 | 83.6 |
Emergency department (ED) visits due to cycling injuries by sex
Key Findings:
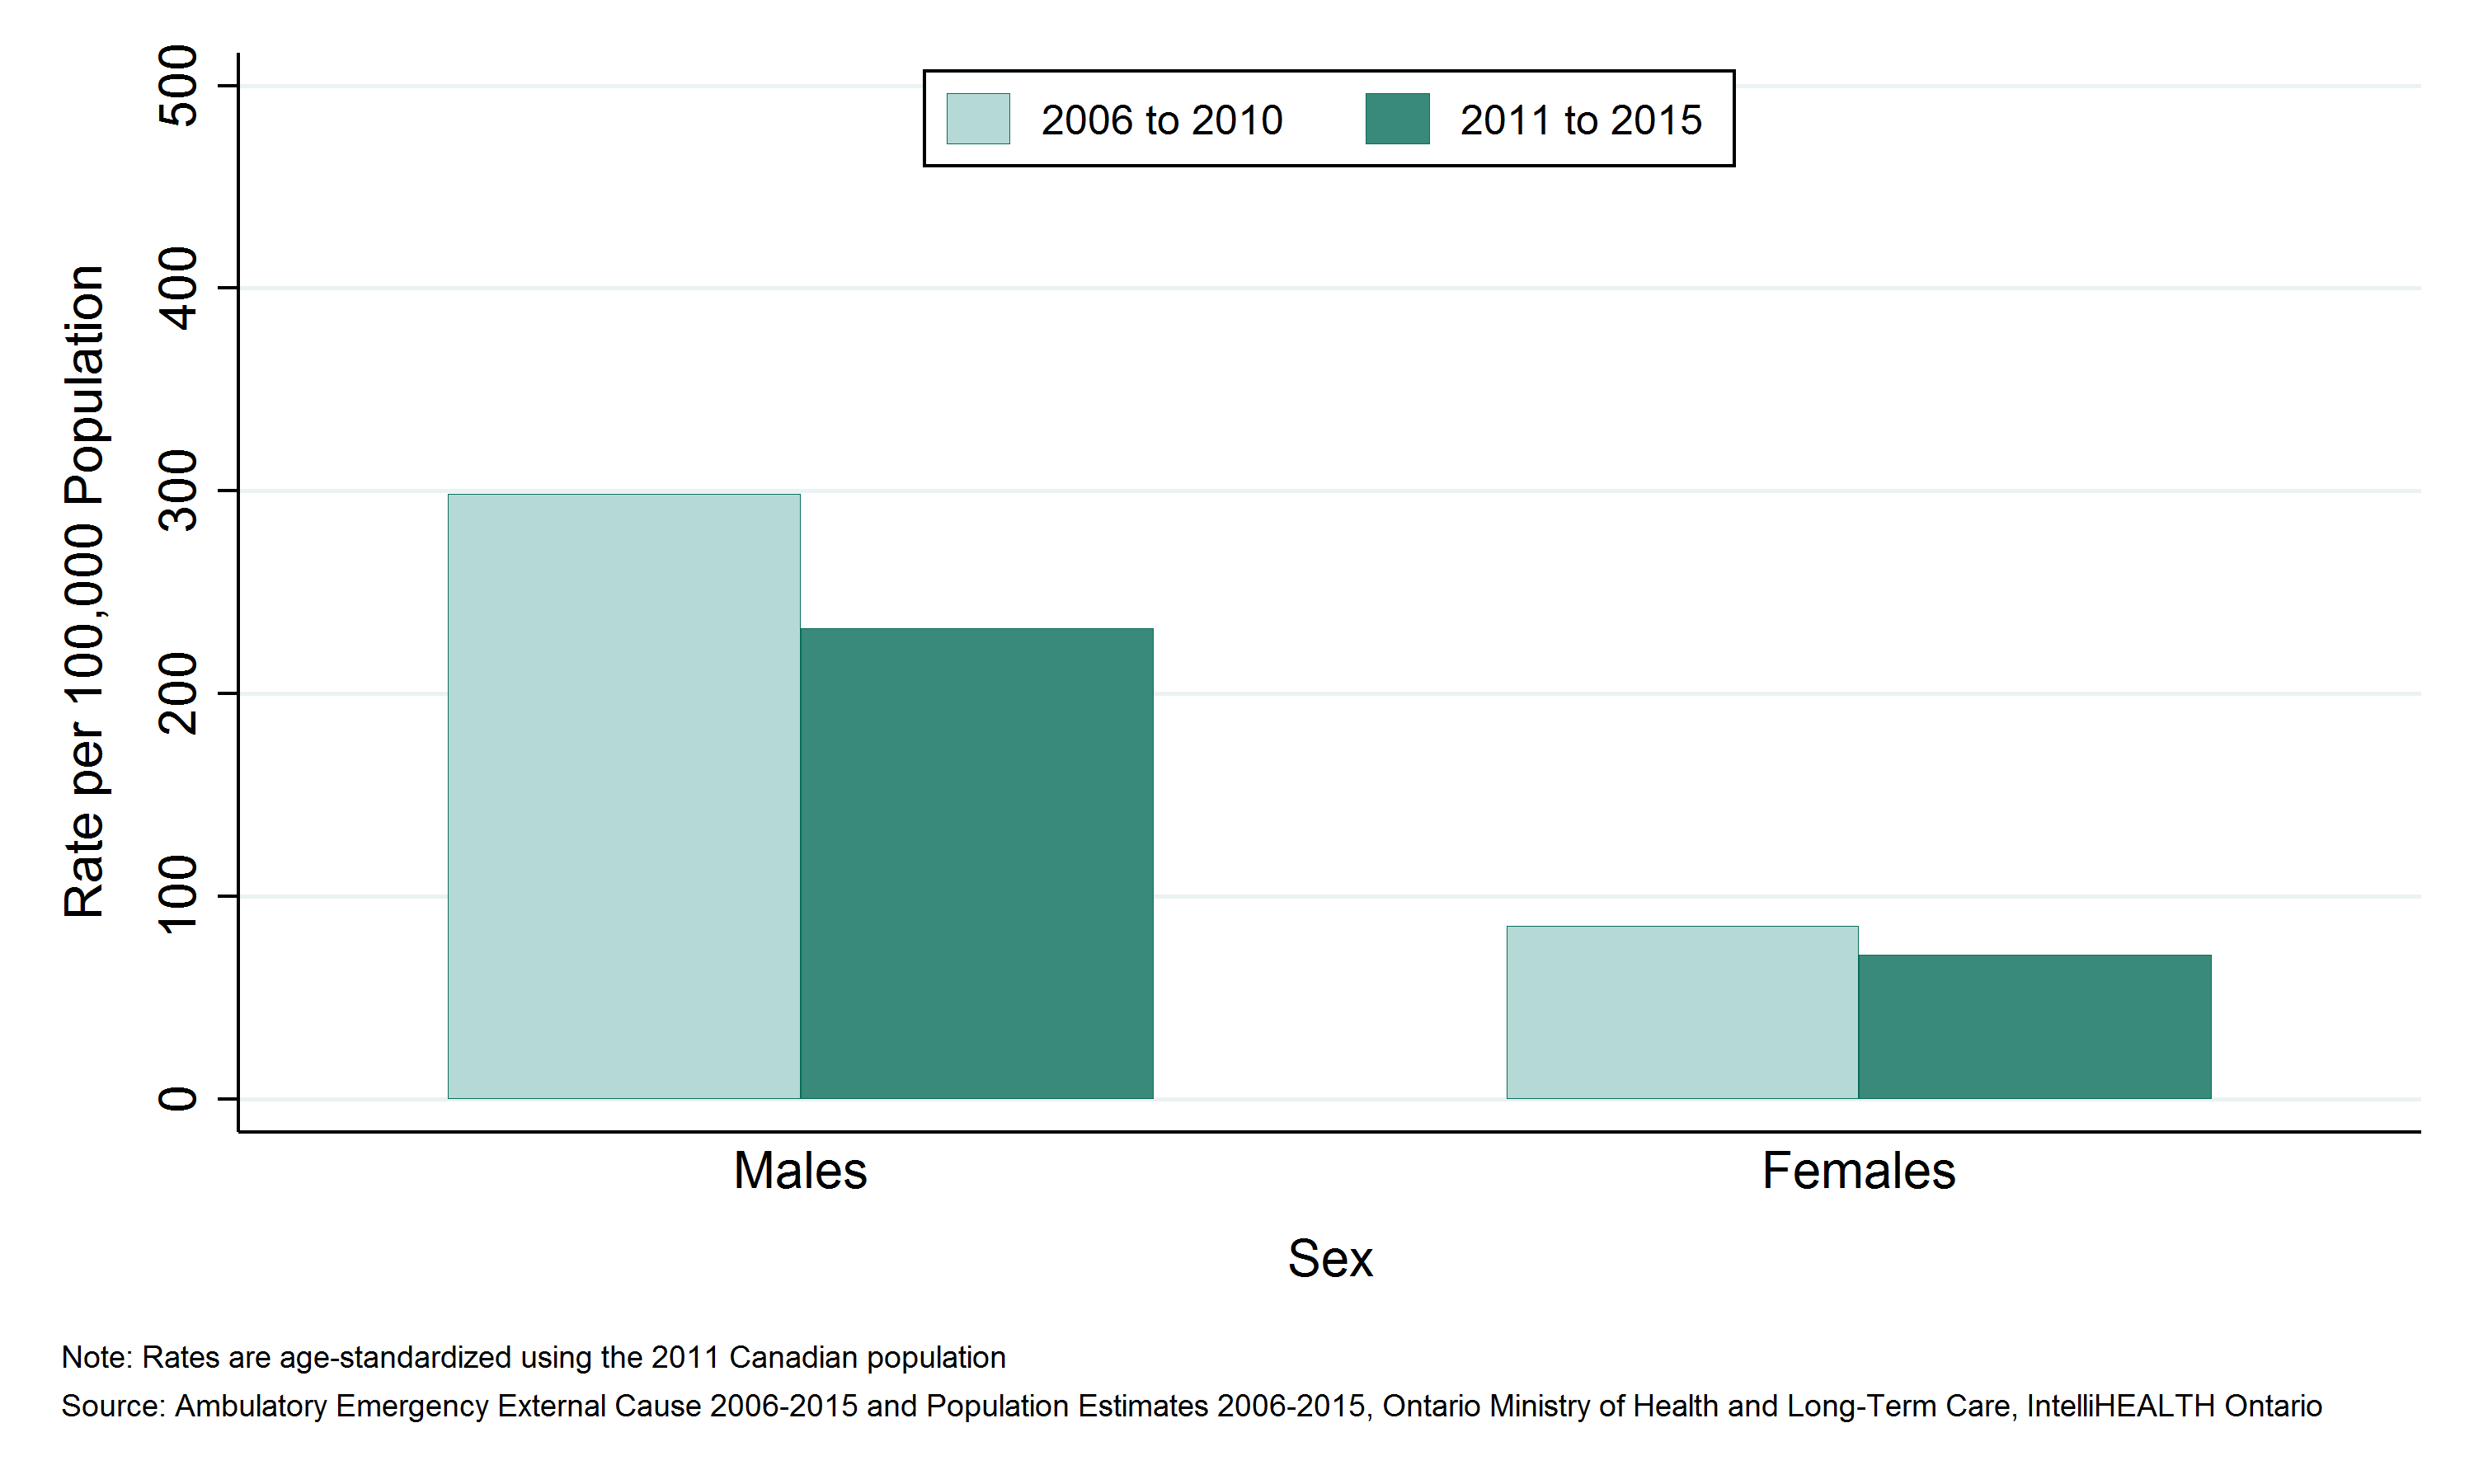
- Between 2011 and 2015, there were 1,118 emergency department (ED) visits due to cycling injuries among males, and 333 among females in the Sudbury & District Health Unit (SDHU) area, an average of 224 and 67 per year, respectively.
- The rate of ED visits due to cycling injuries was 232 per 100,000 males per year and 71 per 100,000 females per year in the SDHU area between 2011 and 2015.
- The ED visits rate due to cycling injuries among males has been consistently higher than the rate among females.
Among both males and females in the SDHU area, the rate of ED visits due to cycling injuries decreased over time between 2006 to 2010 and 2011 to 2015.
Notes:
- Geographic areas and/or time periods in which there is less access to walk-in clinics and other alternatives to the local ED can be expected to have higher rates of injury-related ED visits than they would otherwise.
- Rates are age-standardized using the 2011 Canadian population.
- Data Source: Ambulatory Emergency External Cause 2006 to 2015 (extracted June 6, 2016) and Population Estimates 2006 to 2015 (extracted October 7, 2016), Ontario Ministry of Health and Long-Term Care, IntelliHEALTH Ontario.
Figure: Annual age-standardized rate of emergency department visits, cycling injuries, by sex, SDHU, 2006 to 2010 and 2011 to 2015

Table: Annual age-standardized rate of emergency department visits, cycling injuries, by sex, SDHU, 2006 to 2010 and 2011 to 2015
| Sex | Rate per 100,000, 2006 to 2010 | Rate per 100,000, 2011 to 2015 |
| Males | 298.5 | 232.3 |
| Females | 85.3 | 71.1 |
Table: Annual number of emergency department visits, cycling injuries, by sex, SDHU, 2006 to 2010 and 2011 to 2015
| Sex | Total Counts, 2006 to 2010 | Total Counts, 2011 to 2015 | Average Annual Counts, 2006 to 2010 | Average Annual Counts, 2011 to 2015 |
| Males | 1,528 | 1,118 | 305.6 | 223.6 |
| Females | 419 | 333 | 83.8 | 66.6 |
Emergency department (ED) visits due to cycling injuries by age group
Key Findings:
- Among residents of the Sudbury & District Health Unit (SDHU) area, the 15 to 24 age group visited the emergency department (ED) the most due to cycling injuries, with 384 ED visits between 2011 and 2015, or 77 ED visits per year on average.
- Between 2011 and 2015, the 10 to 14 age group had the highest ED visits rate due to cycling injuries with 686 ED visits per 100,000 population per year.
- Rates of ED visits due to cycling injuries are relatively high in children and youth, increasing in the 10 to 14 age group. Rates are then low throughout adulthood and decrease with age.
- In the SDHU area, the ED visits rate due to cycling injuries decreased over time in the 0 to 9, 10 to 14, and 15 to 24 age groups between 2006 to 2010 and 2011 to 2015. Rates have remained stable for all other age groups.
Notes:
- Geographic areas and/or time periods in which there is less access to walk-in clinics and other alternatives to the local ED can be expected to have higher rates of injury-related ED visits than they would otherwise.
- Rates are age-standardized using the 2011 Canadian population.
- Data Source: Ambulatory Emergency External Cause 2006 to 2015 (extracted June 6, 2016) and Population Estimates 2006 to 2015 (extracted October 7, 2016), Ontario Ministry of Health and Long-Term Care, IntelliHEALTH Ontario.
Figure: Annual age-standardized rate of emergency department visits, cycling injuries, by age group, SDHU, 2006 to 2010 and 2011 to 2015
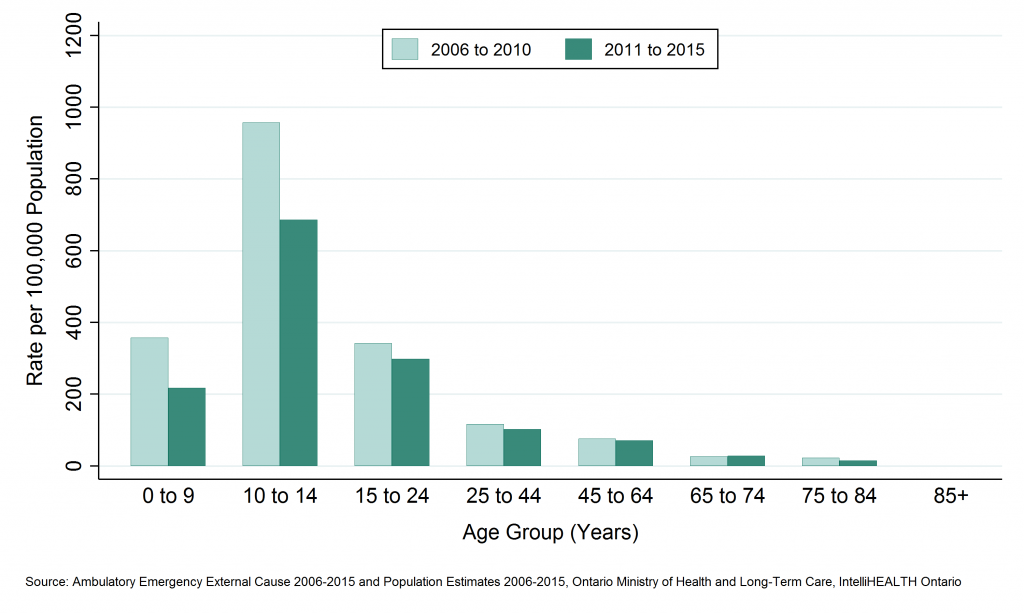
Table: Annual age-standardized rate of emergency department visits, cycling injuries, by age group, SDHU, 2006 to 2010 and 2011 to 2015
| Age Group | Rate per 100000, 2006 to 2010 | Rate per 100000, 2011 to 2015 |
| 0 to 9 | 356.9 | 217.9 |
| 10 to 14 | 956.7 | 686.0 |
| 15 to 24 | 342.1 | 298.3 |
| 25 to 44 | 116.9 | 102.7 |
| 45 to 64 | 75.7 | 71.4 |
| 65 to 74 | 26.0 | 28.6 |
| 75 to 84 | 22.9 | 14.7 |
| 85+ | 0.0 | 0.0 |
Table: Annual number of emergency department visits, cycling injuries, by age group, SDHU, 2006 to 2010 and 2011 to 2015
| Age Group | Total Counts, 2006 to 2010 | Total Counts, 2011 to 2015 | Average Annual Counts, 2006 to 2010 | Average Annual Counts, 2011 to 2015 |
| 0 to 9 | 352 | 209 | 70.4 | 41.8 |
| 10 to 14 | 578 | 354 | 115.6 | 70.8 |
| 15 to 24 | 455 | 384 | 91.0 | 76.8 |
| 25 to 44 | 303 | 251 | 60.6 | 50.2 |
| 45 to 64 | 225 | 217 | 45.0 | 43.4 |
| 65 to 74 | 22 | 28 | 4.4 | 5.6 |
| 75 to 84 | 12 | 8 | 2.4 | 1.6 |
| 85+ | 0 | 0 | 0.0 | 0.0 |
Deaths due to cycling injuries by geographic region
Key Findings:
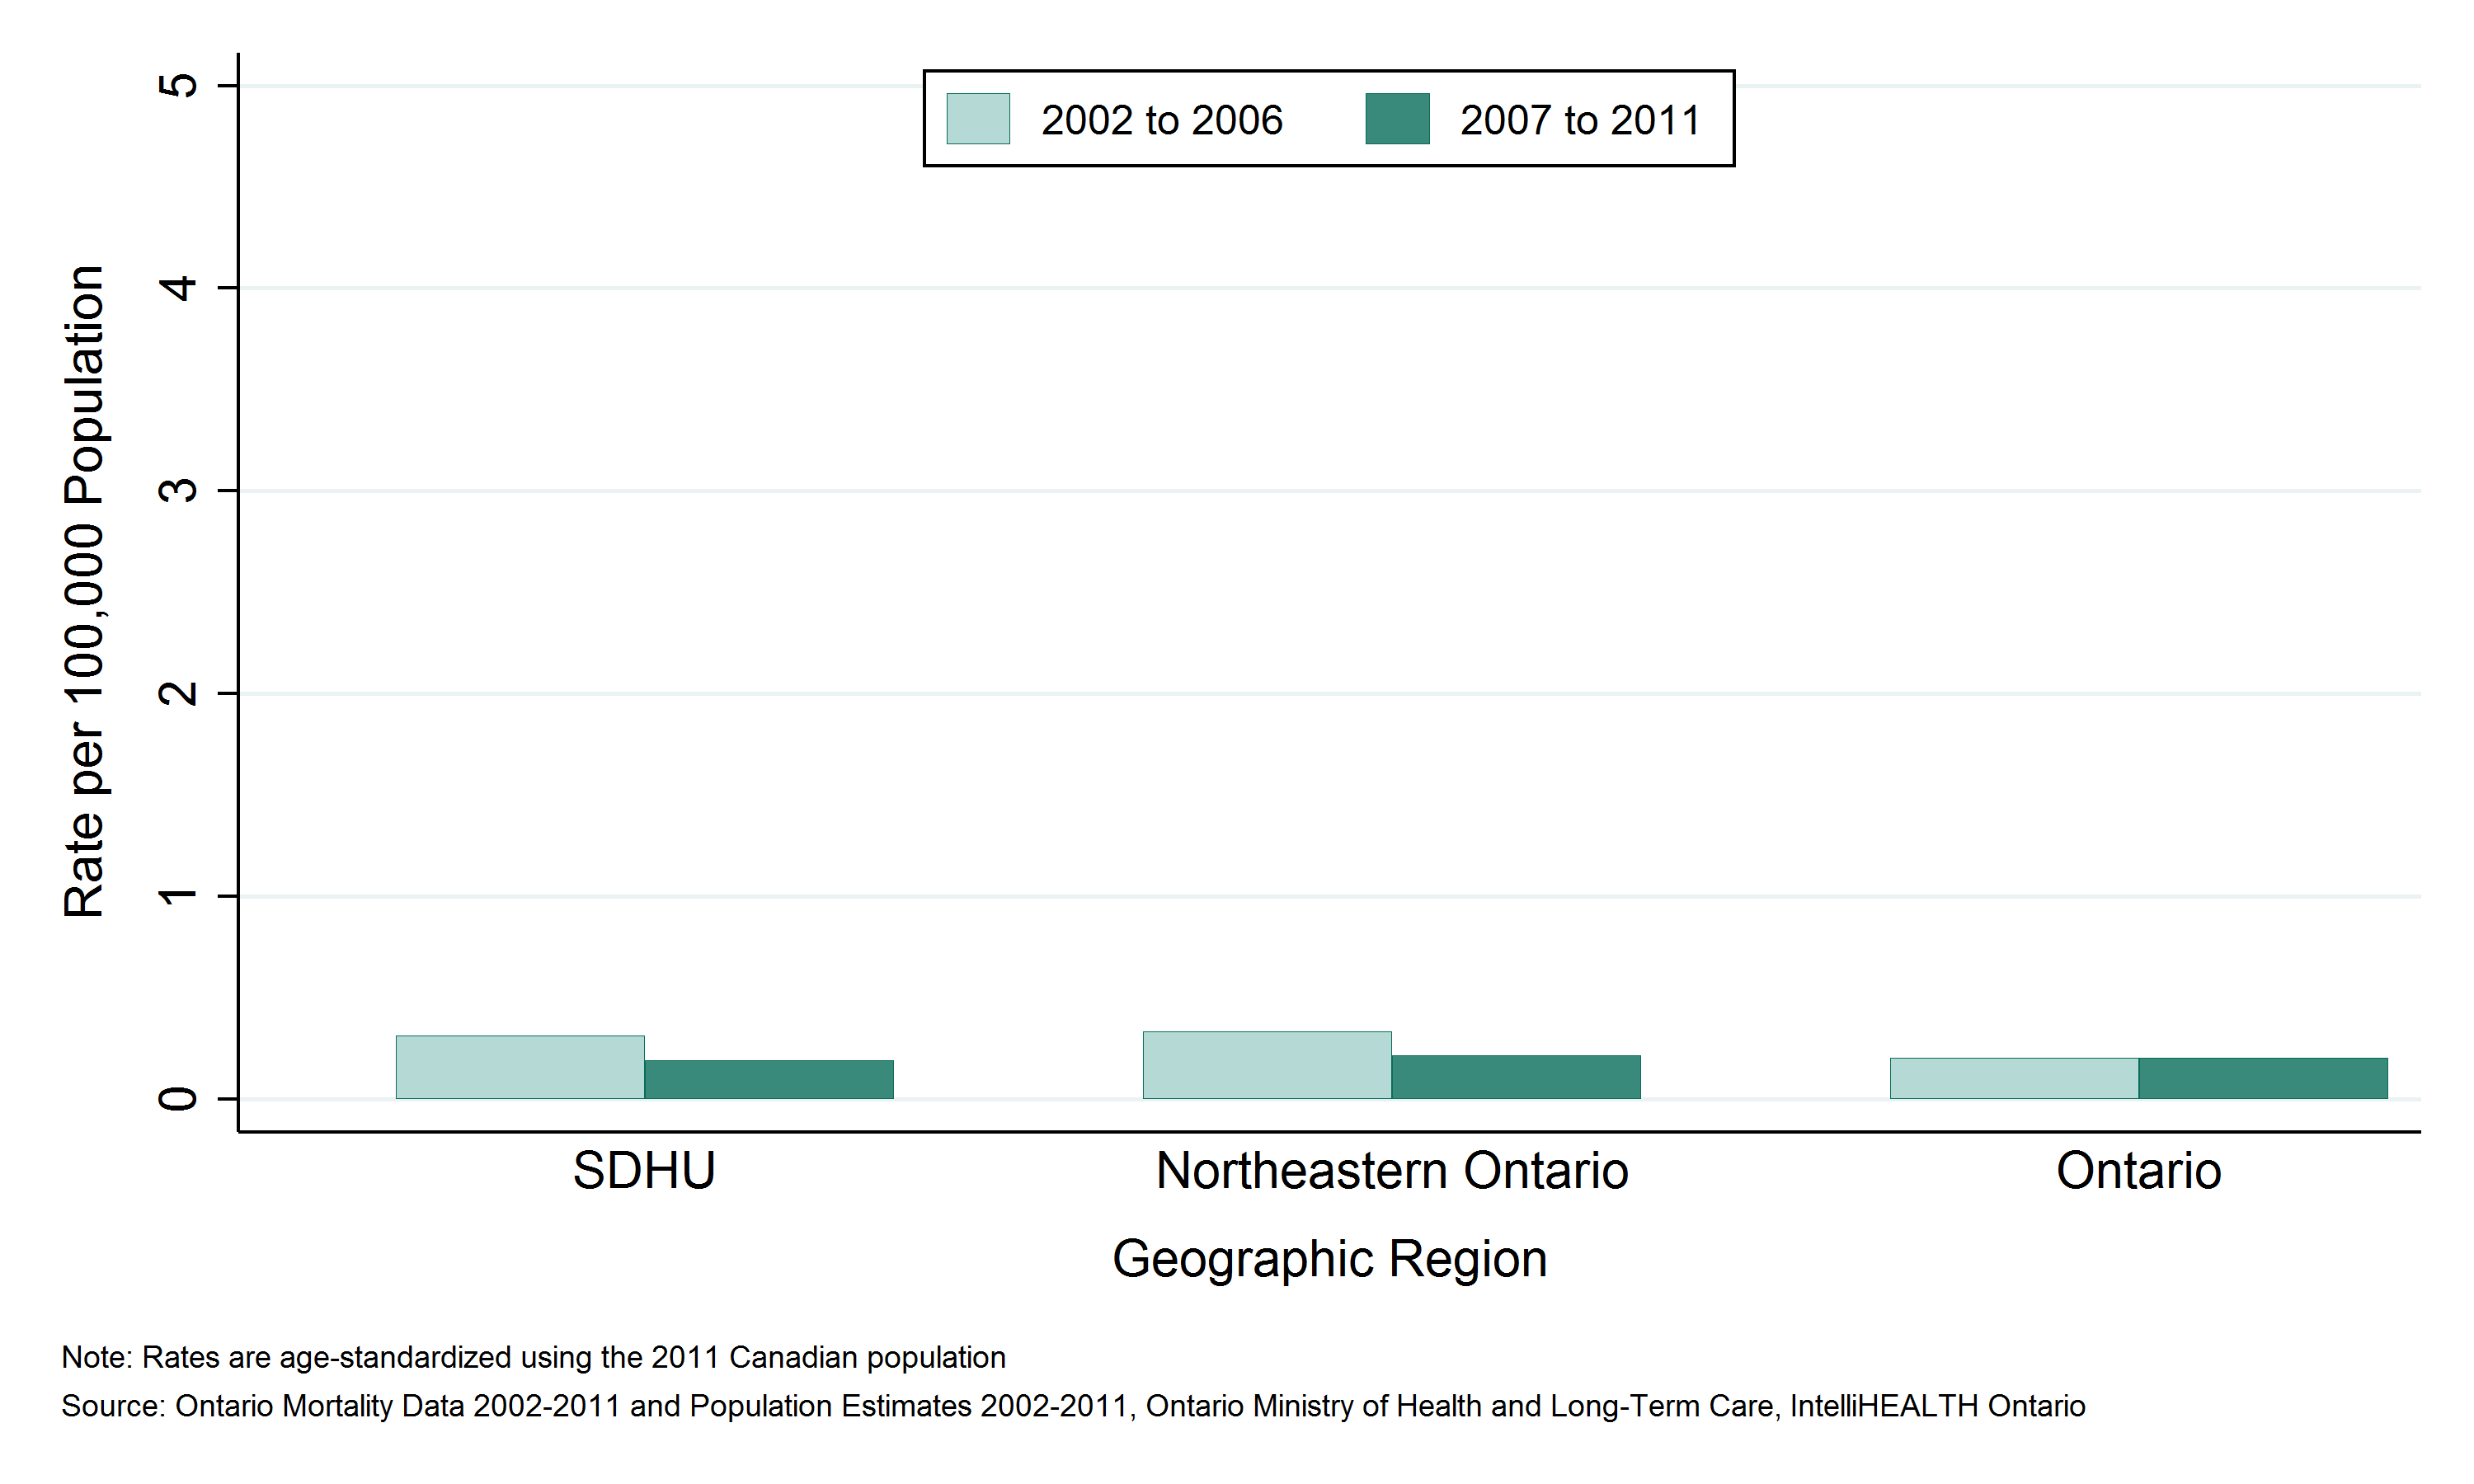
- Among residents of the Sudbury & District Health Unit (SDHU) area, there was 2 deaths due to cycling injuries between 2007 and 2011, an average of 0.4 deaths per year.
- Between 2006 and 2015, the mortality rate due to cycling injuries in the SDHU area was 0.2 deaths per 100,000 population per year.
- The mortality rates due to cycling injuries in the SDHU area, northeastern Ontario, and Ontario overall are similar.
- Between 2002 to 2006 and 2007 to 2011, the mortality rate due to cycling injuries in the SDHU area remained stable.
Notes:
- Rates are age-standardized using the 2011 Canadian population.
- Data Source: Ontario Mortality Data 2002 to 2011 (extracted June 6, 2016) and Population Estimates 2006 to 2015 (extracted October 7, 2016), Ontario Ministry of Health and Long-Term Care, IntelliHEALTH Ontario.
Figure: Annual age-standardized mortality rate, cycling injuries, by geographic region, 2002 to 2006 and 2007 to 2011

Table: Annual age-standardized mortality rate, cycling injuries, by geographic region, 2002 to 2006 and 2007 to 2011
| Geographic Region | Rate per 100,000 2002 to 2006 | Rate per 100,000 2007 to 2011 |
| SDHU | 0.3 | 0.2 |
| Northeast | 0.3 | 0.2 |
| Ontario | 0.2 | 0.2 |
Table: Annual number of deaths, cycling injuries, by geographic region, 2002 to 2006 and 2007 to 2011
| Geographic Region | Total Counts 2002 to 2006 | Total Counts 2007 to 2011 | Average Annual Counts, 2002 to 2006 | Average Annual Counts, 2007 to 2011 |
| SDHU | 3 | 2 | 0.6 | 0.4 |
| Northeast | 10 | 6 | 2.0 | 1.2 |
| Ontario | 127 | 133 | 25.4 | 26.6 |
Potential years of life lost (PYLL) due to cycling injuries by geographic region
Key Findings:
- Between 2006 and 2015, Sudbury & District Health Unit (SDHU) area residents lost 60 years of potential life due to deaths from cycling injuries before the age of 75, an average of 12.
- The rate of potential years of life lost (PYLL) in the SDHU area due to cycling injuries was 6 PYLL per 100,000 population per year.
- The rate of PYLL due to cycling injuries in the SDHU area is slightly lower than that in northeastern Ontario, but similar to the rate in Ontario overall.
- Between 2002 to 2006 and 2007 to 2011, the rate of PYLL due to cycling injuries in the SDHU area remained stable.
Notes:
- Rates are age-standardized using the 2011 Canadian population.
- Data Source: Ontario Mortality Data 2002 to 2011 (extracted June 6, 2016) and Population Estimates 2006 to 2015 (extracted October 7, 2016), Ontario Ministry of Health and Long-Term Care, IntelliHEALTH Ontario.
Figure: Annual age-standardized rate of potential years of life lost (PYLL), cycling injuries, by geographic region, 2002 to 2006 and 2007 to 2011
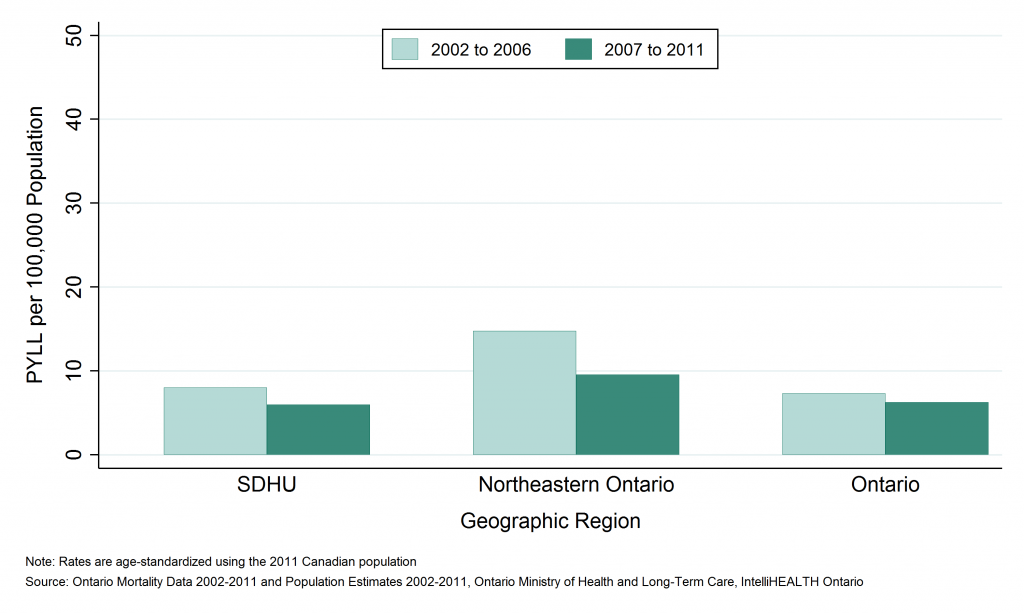
Table: Annual age-standardized rate of potential years of life lost (PYLL), cycling injuries, by geographic region, 2002 to 2006 and 2007 to 2011
| Geographic Region | Rate per 100,000, 2002 to 2006 | Rate per 100,000, 2007 to 2011 |
| SDHU | 8.0 | 6.0 |
| Northeast | 14.8 | 9.6 |
| Ontario | 7.3 | 6.3 |
Table: Annual number of potential years of life lost (PYLL), cycling injuries, by geographic region, 2002 to 2006 and 2007 to 2011
| Geographic Region | Total PYLL, 2002 to 2006 | Total PYLL, 2007 to 2011 | Average Annual Counts, 2002 to 2006 | Average Annual Counts, 2007 to 2011 |
| SDHU | 78 | 60 | 15.6 | 12.0 |
| Northeast | 424 | 254 | 84.8 | 50.8 |
| Ontario | 4,607 | 4,037 | 921.4 | 807.4 |
This item was last modified on July 25, 2017