Concussions
A concussion is a traumatic brain injury caused by the impact of the brain with the inside of the skull following a blow to the head or body, a fall, or another injury. Recent increases in awareness of concussions, particularly in sports, may be resulting in an increase in concussion diagnoses beyond what might otherwise have occurred.
Emergency department (ED) visits due to concussions by geographic region
Key Findings:
- Among residents of the Sudbury & District Health Unit (SDHU) area, there were 477 emergency department (ED) visits due to concussions in 2015.
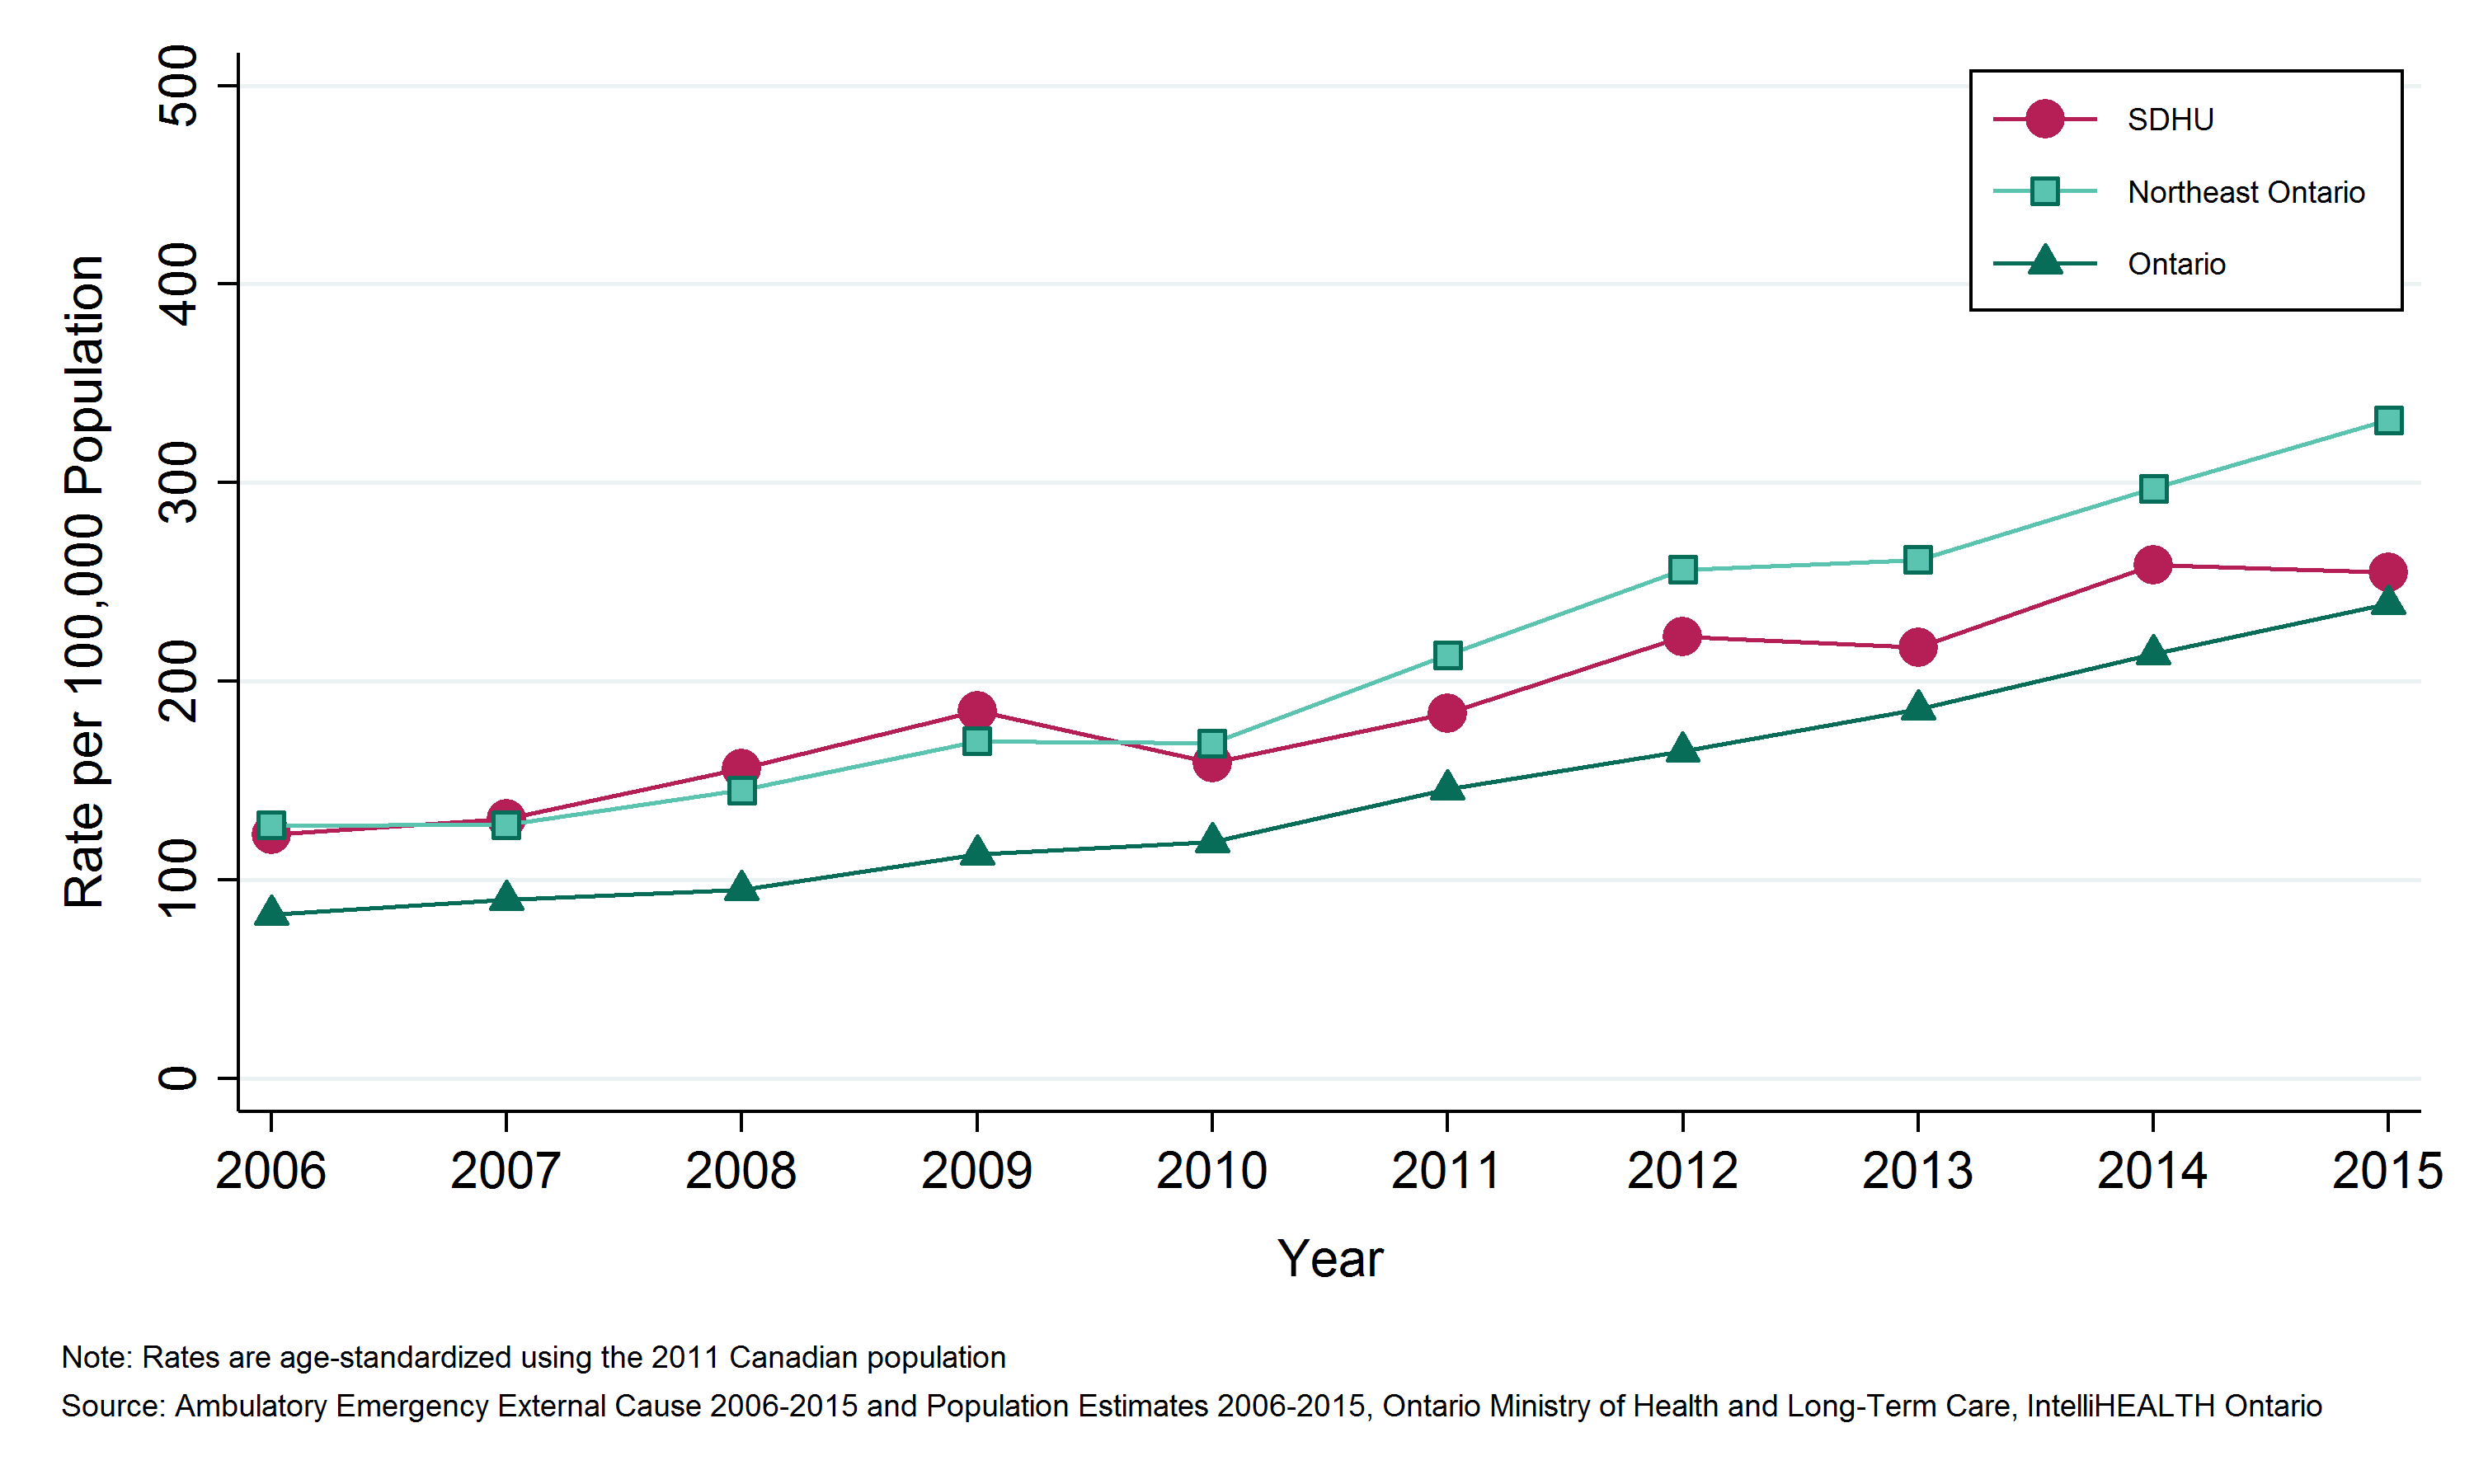
- In 2015, the ED visits rate due to concussions in the SDHU area was 255 per 100,000 population per year.
- The rate of ED visits due to concussions in the SDHU area has been lower than that of northeastern Ontario for the past few years. Both the SDHU area and northeastern Ontario rates have consistently been higher than the Ontario overall rates.
- Between 2006 and 2015, the ED visits rate due to concussions in the SDHU area increased.
Notes:
- Recent increases in awareness of concussions, particularly in sports, may be resulting in an increase in concussion diagnoses beyond what might otherwise have occurred.
- Geographic areas and/or time periods in which there is less access to walk-in clinics and other alternatives to the local ED can be expected to have higher rates of injury-related ED visits than they would otherwise.
- Rates are age-standardized using the 2011 Canadian population.
- Data Source: Ambulatory Emergency External Cause 2006 to 2015 (extracted June 6, 2016) and Population Estimates 2006 to 2015 (extracted October 7, 2016), Ontario Ministry of Health and Long-Term Care, IntelliHEALTH Ontario.
Figure: Annual age-standardized rate of emergency department visits, concussions, by geographic region, 2006 to 2015

Table: Annual age-standardized rate of emergency department visits, concussions, by geographic region, 2006 to 2015
| Geographic Region | 2006 | 2007 | 2008 | 2009 | 2010 | 2011 | 2012 | 2013 | 2014 | 2015 |
| SDHU | 123.1 | 131.0 | 156.0 | 185.0 | 158.9 | 184.0 | 222.6 | 217.1 | 258.7 | 255.0 |
| Northeast | 127.6 | 127.8 | 145.3 | 170.0 | 169.0 | 213.4 | 256.4 | 261.2 | 297.1 | 331.5 |
| Ontario | 82.8 | 90.1 | 95.1 | 113.1 | 119.3 | 145.7 | 164.9 | 186.0 | 214.0 | 239.0 |
Table: Annual number of emergency department visits, concussions, by geographic region, 2006 to 2015
| Geographic Region | 2006 | 2007 | 2008 | 2009 | 2010 | 2011 | 2012 | 2013 | 2014 | 2015 |
| SDHU | 252 | 265 | 314 | 367 | 317 | 361 | 433 | 416 | 497 | 477 |
| Northeast | 738 | 730 | 821 | 952 | 941 | 1,174 | 1,397 | 1,400 | 1,578 | 1,729 |
| Ontario | 10,932 | 11,948 | 12,651 | 15,109 | 16,023 | 19,657 | 22,306 | 25,178 | 29,040 | 32,417 |
Emergency department (ED) visits due to concussions by Greater Sudbury and outlying areas
Key Findings:
- Between 2011 and 2015, there were 1,646 emergency department (ED) visits due to concussions among residents of Greater Sudbury and 538 ED visits among residents of the SDHU district office areas, an average of 329 and 108 per year, respectively.
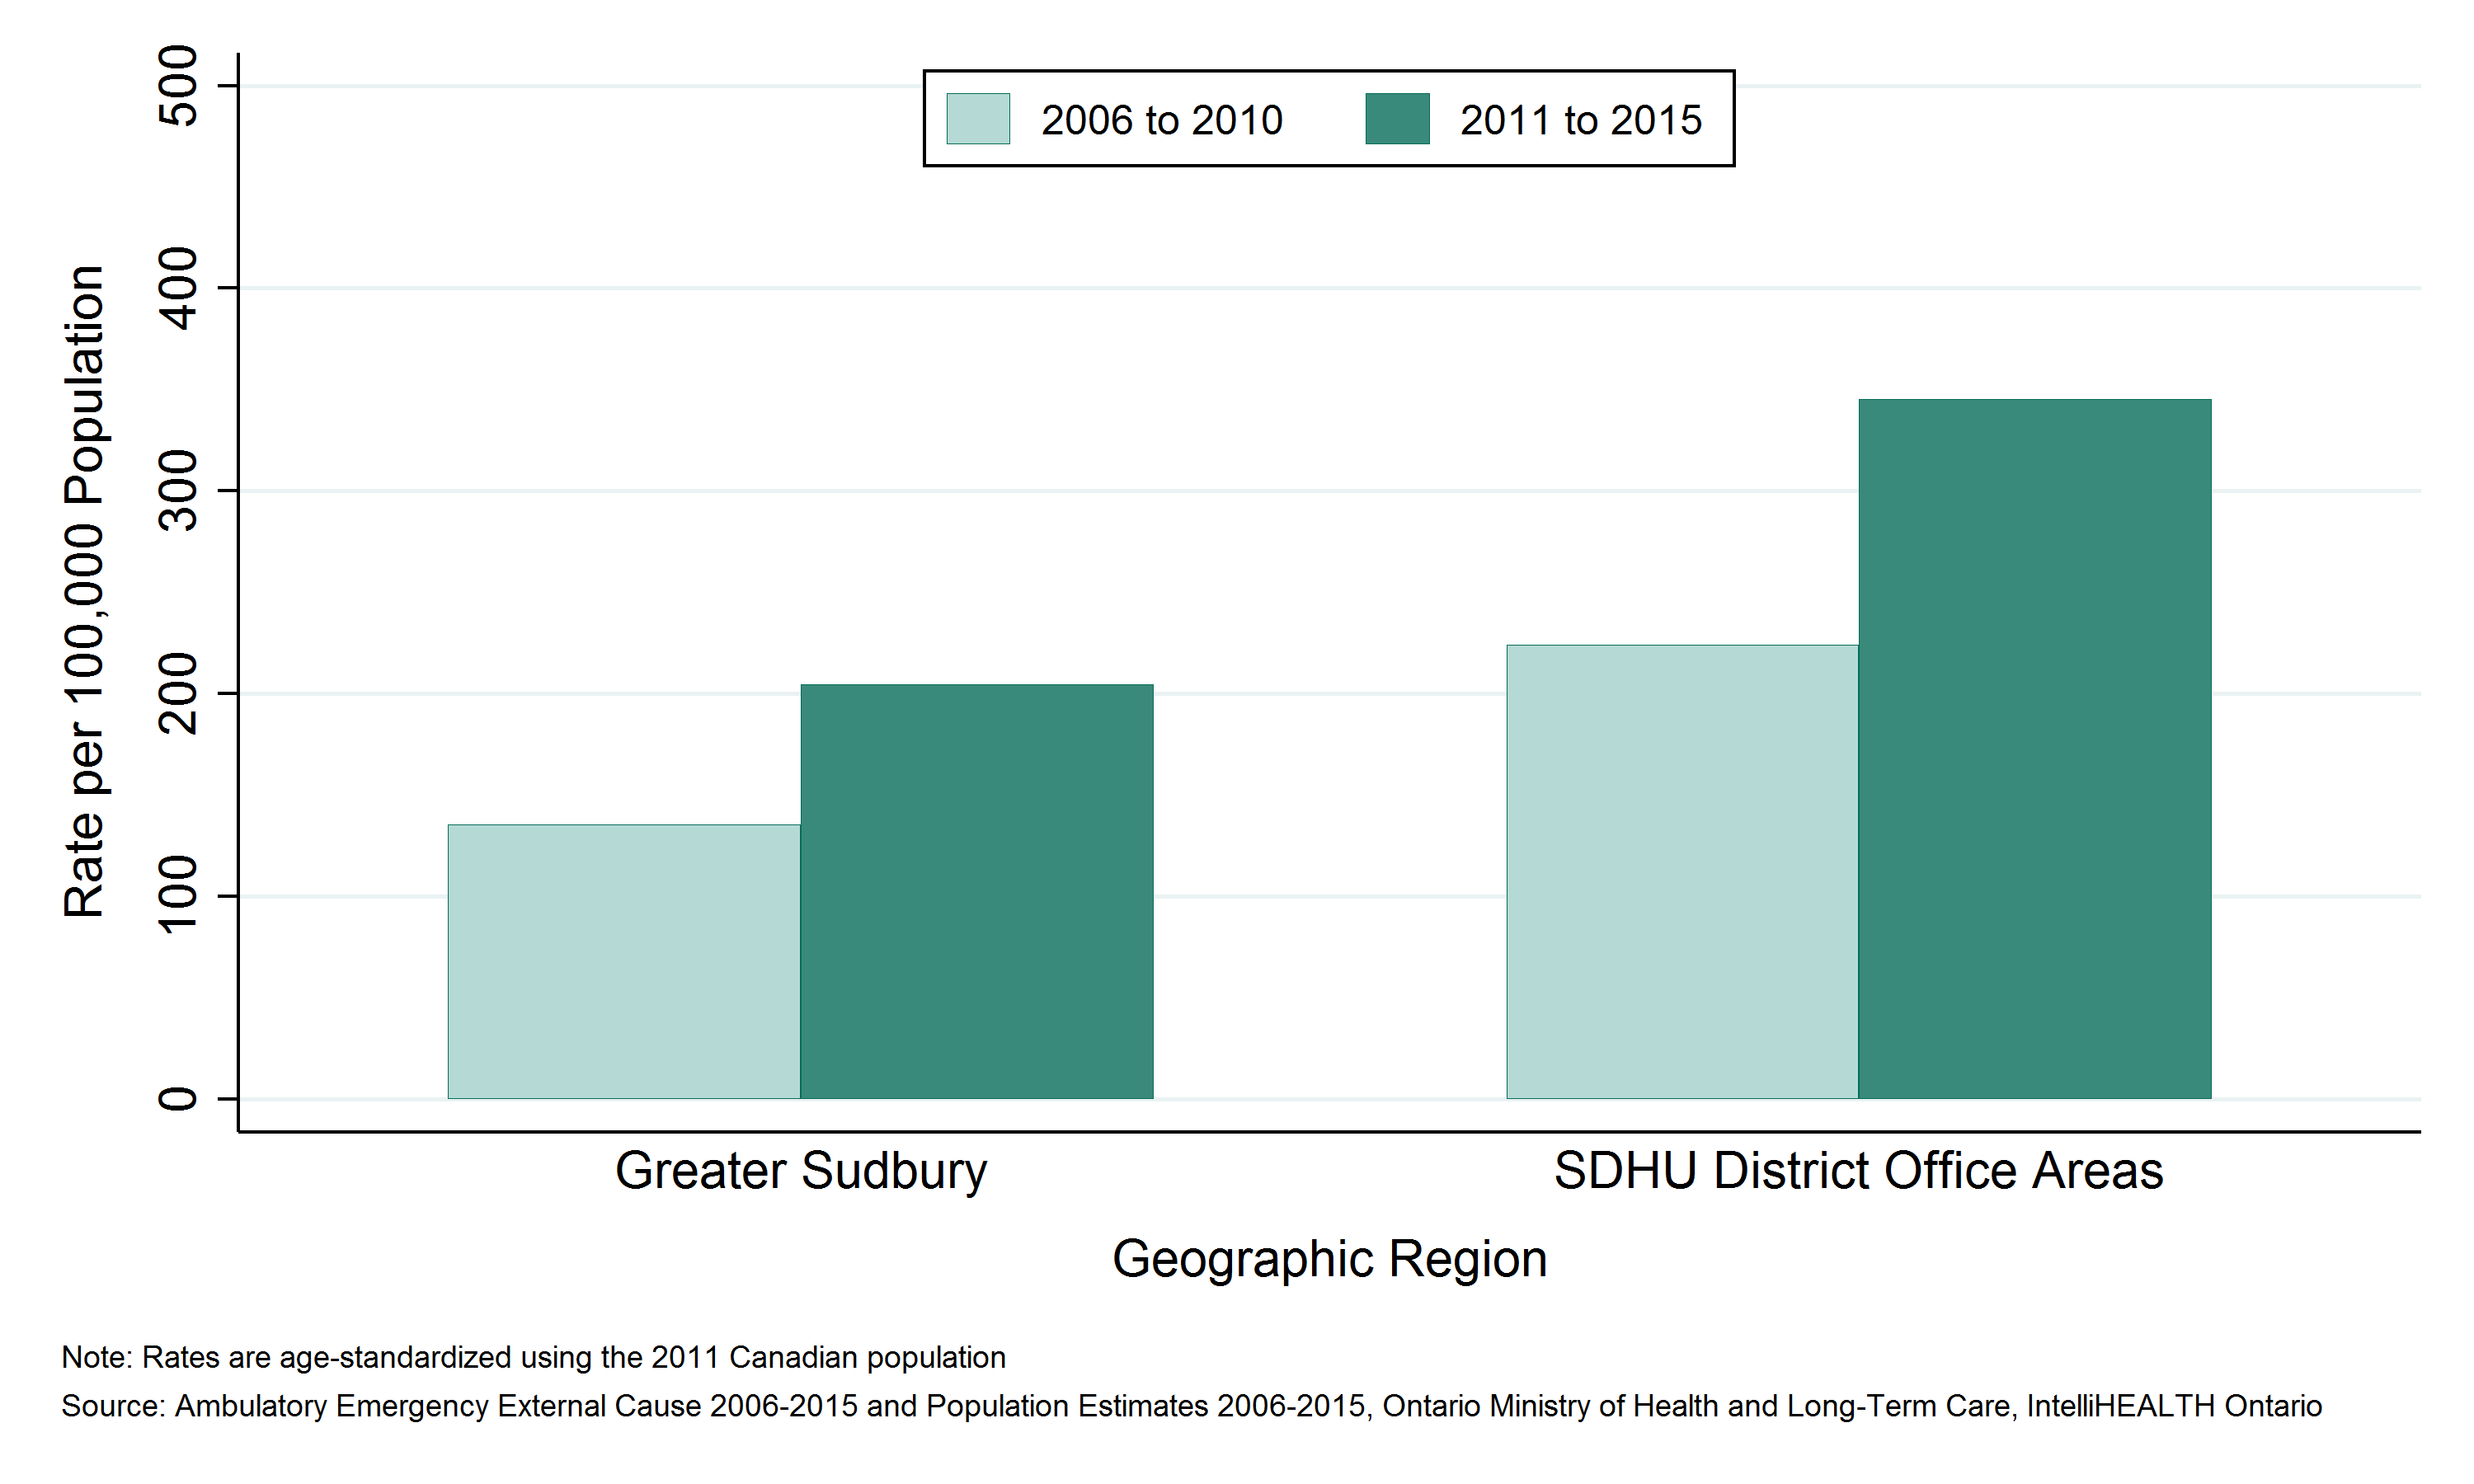
- The rate of ED visits due to concussions was 205 per 100,000 population per year in Greater Sudbury and 345 per 100,000 population per year in the SDHU district office areas between 2011 and 2015.
- The rate of ED visits due to concussions among residents of Greater Sudbury has been consistently lower than among residents in the SDHU district office areas.
- The rate of ED visits due to concussions among residents in both areas increased between 2006 to 2010 and 2011 to 2015.
Notes:
- Recent increases in awareness of concussions, particularly in sports, may be resulting in an increase in concussion diagnoses beyond what might otherwise have occurred.
- Geographic areas and/or time periods in which there is less access to walk-in clinics and other alternatives to the local ED can be expected to have higher rates of injury-related ED visits than they would otherwise.
- Rates are age-standardized using the 2011 Canadian population.
- Data Source: Ambulatory Emergency External Cause 2006 to 2015 (extracted June 6, 2016) and Population Estimates 2006 to 2015 (extracted October 7, 2016), Ontario Ministry of Health and Long-Term Care, IntelliHEALTH Ontario.
Figure: Annual age-standardized rate of emergency department visits, concussions, by Greater Sudbury and outlying areas, 2006 to 2010 and 2011 to 2015

Table: Annual age-standardized rate of emergency department visits, concussions, by Greater Sudbury and outlying areas, 2006 to 2010 and 2011 to 2015
| Geographic Region | Rate per 100000 2006 to 2010 | Rate per 100000 2011 to 2015 |
| Greater Sudbury | 135.3 | 204.7 |
| SDHU District Office Areas | 224.0 | 345.4 |
Table: Annual number of emergency department visits, concussions, by Greater Sudbury and outlying areas, 2006 to 2010 and 2011 to 2015
| Geographic Region | Total Counts, 2006 to 2010 | Total Counts, 2011 to 2015 | Average Annual Counts, 2006 to 2010 | Average Annual Counts, 2011 to 2015 |
| Greater Sudbury | 1,127 | 1,646 | 225.4 | 329.2 |
| SDHU District Office Areas | 388 | 538 | 77.6 | 107.6 |
Emergency department (ED) visits due to concussions by sex
Key Findings:
- Between 2011 and 2015, there were 1,151 emergency department (ED) visits due to concussions among males, and 1,033 among females in the Sudbury & District Health Unit (SDHU) area, an average of 230 and 207 per year, respectively.
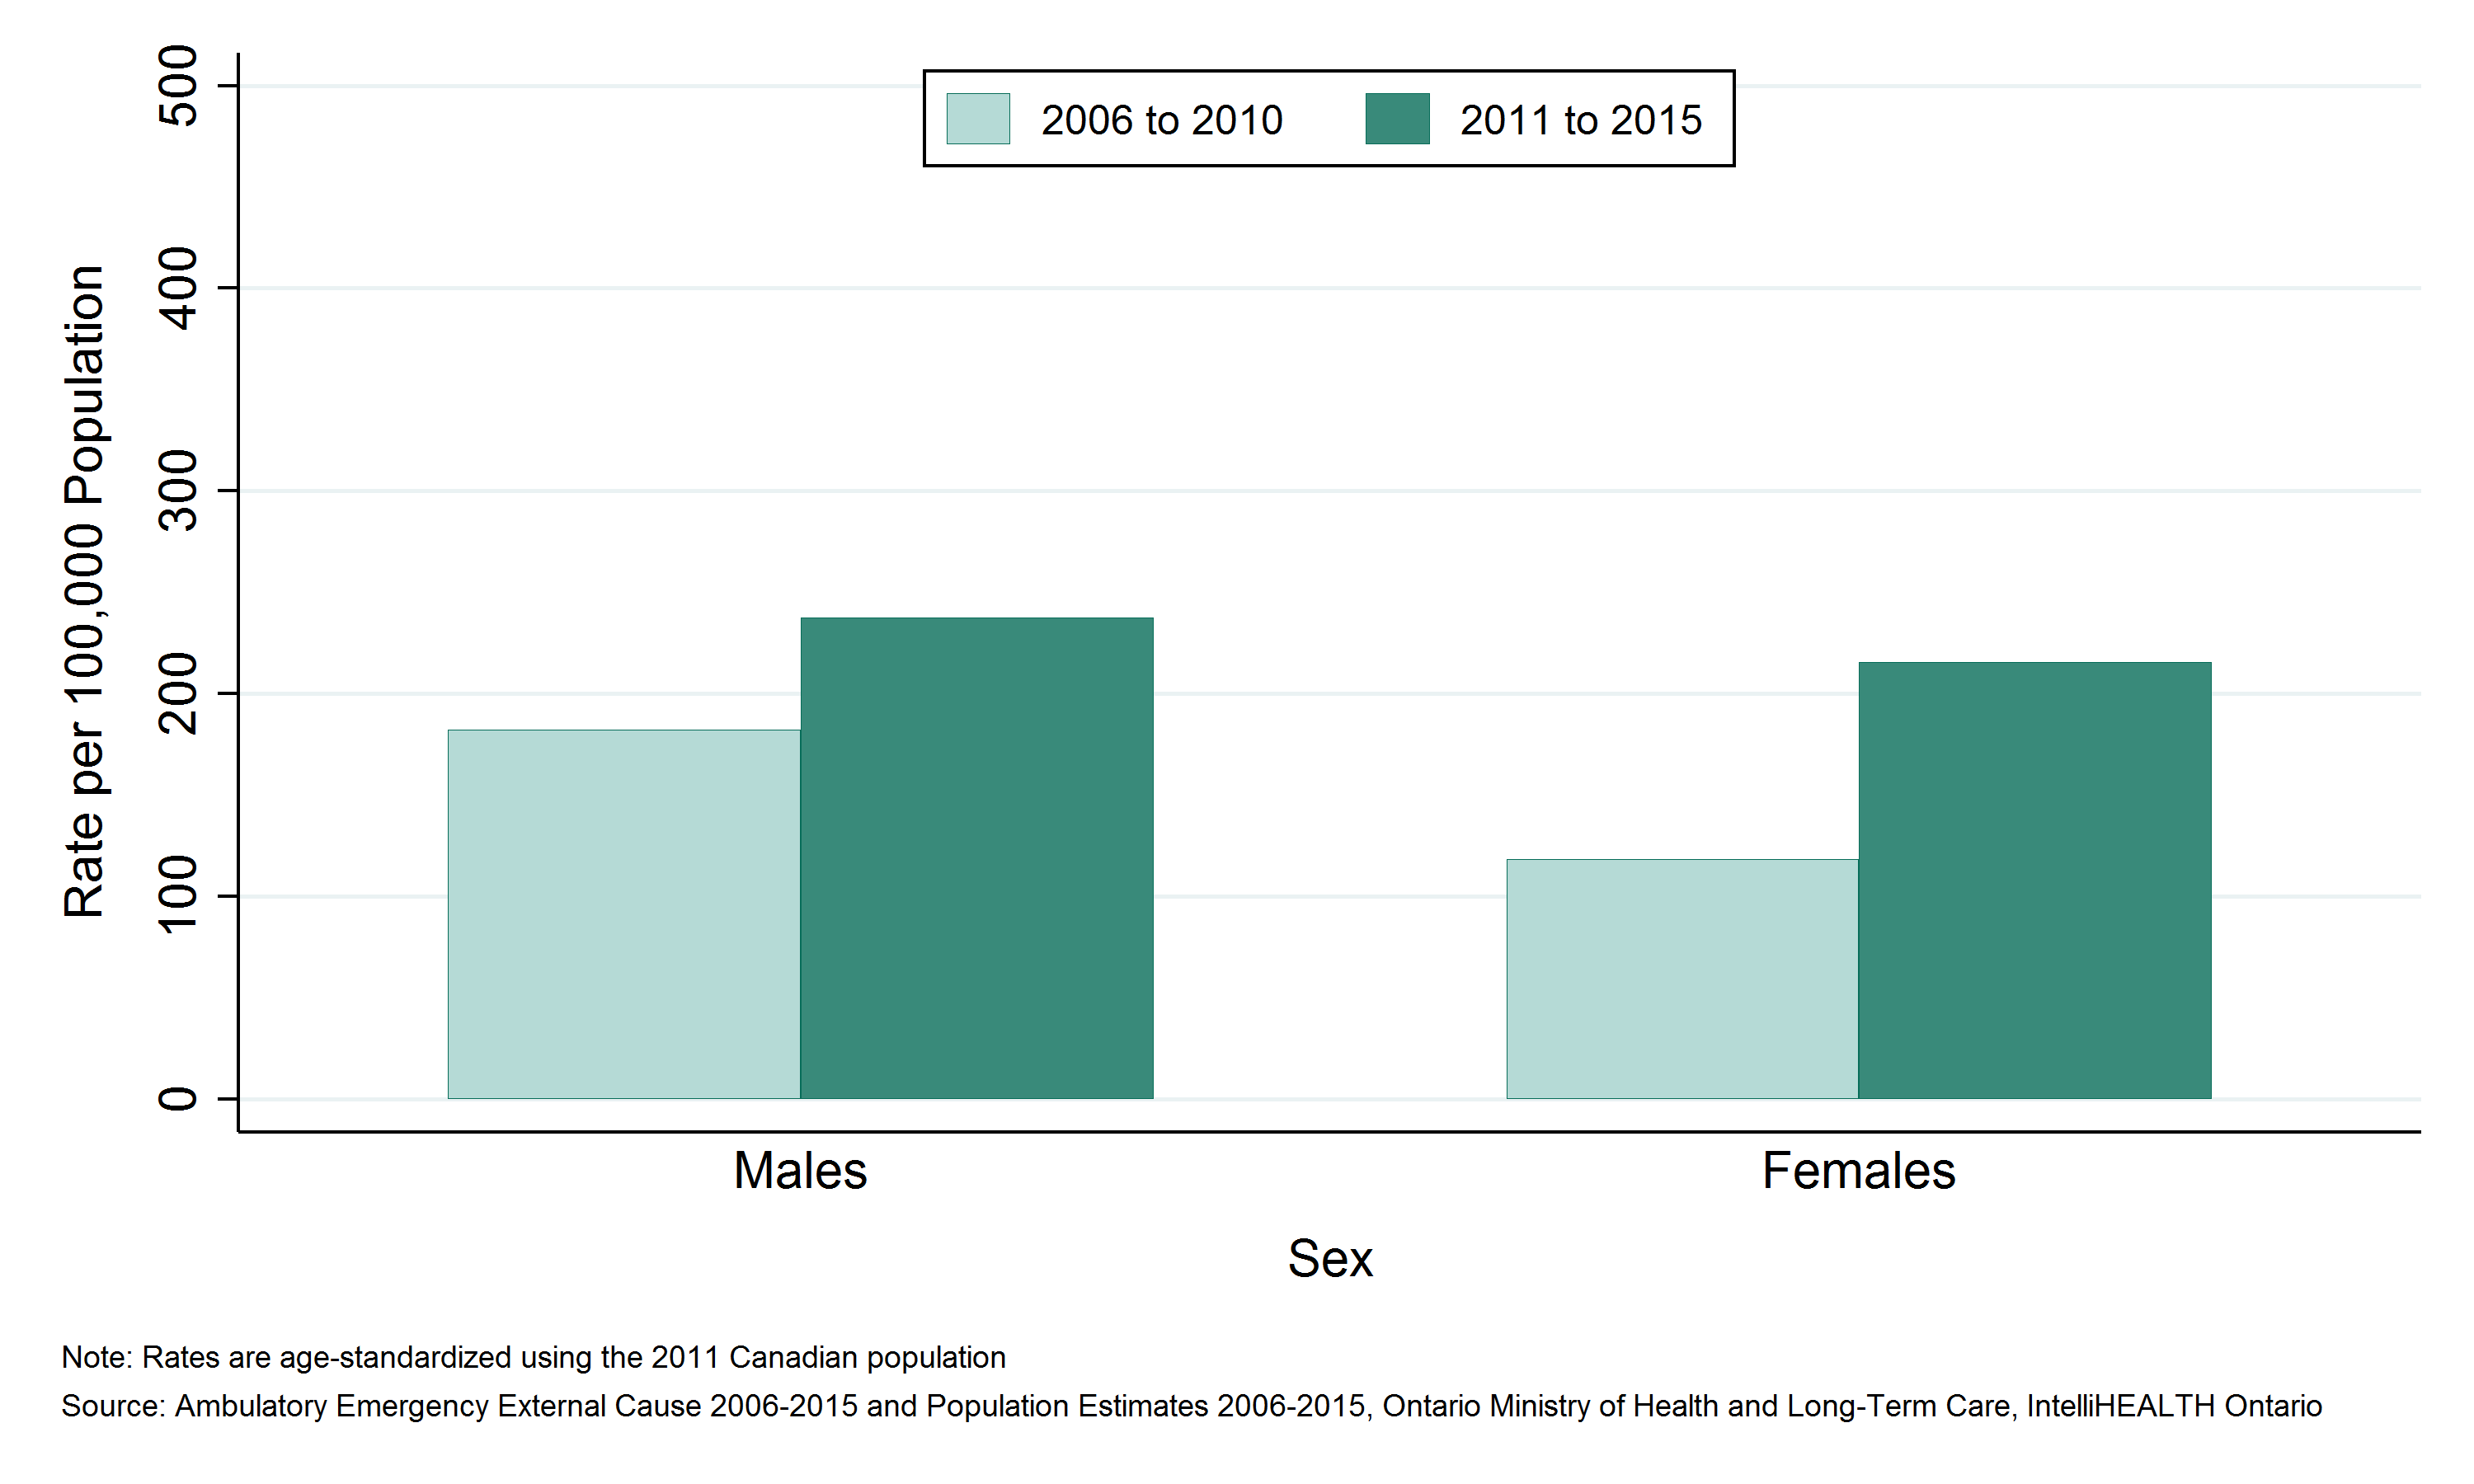
- The rate of ED visits due to concussions was 238 per 100,000 males per year and 216 per 100,000 females per year in the SDHU area between 2011 and 2015.
- Rates of ED visits due to concussions among SDHU-area males have been higher than among females, though this difference has decreased in recent years.
- In the SDHU area, rates of ED visits due to concussions increased for both sexes between 2006 to 2010 and 2011 to 2015, though the increase in females was larger.
Notes:
- Recent increases in awareness of concussions, particularly in sports, may be resulting in an increase in concussion diagnoses beyond what might otherwise have occurred.
- Geographic areas and/or time periods in which there is less access to walk-in clinics and other alternatives to the local ED can be expected to have higher rates of injury-related ED visits than they would otherwise.
- Rates are age-standardized using the 2011 Canadian population.
- Data Source: Ambulatory Emergency External Cause 2006 to 2015 (extracted June 6, 2016) and Population Estimates 2006 to 2015 (extracted October 7, 2016), Ontario Ministry of Health and Long-Term Care, IntelliHEALTH Ontario.
Figure: Annual age-standardized rate of emergency department visits, concussions, by sex, SDHU, 2006 to 2010 and 2011 to 2015
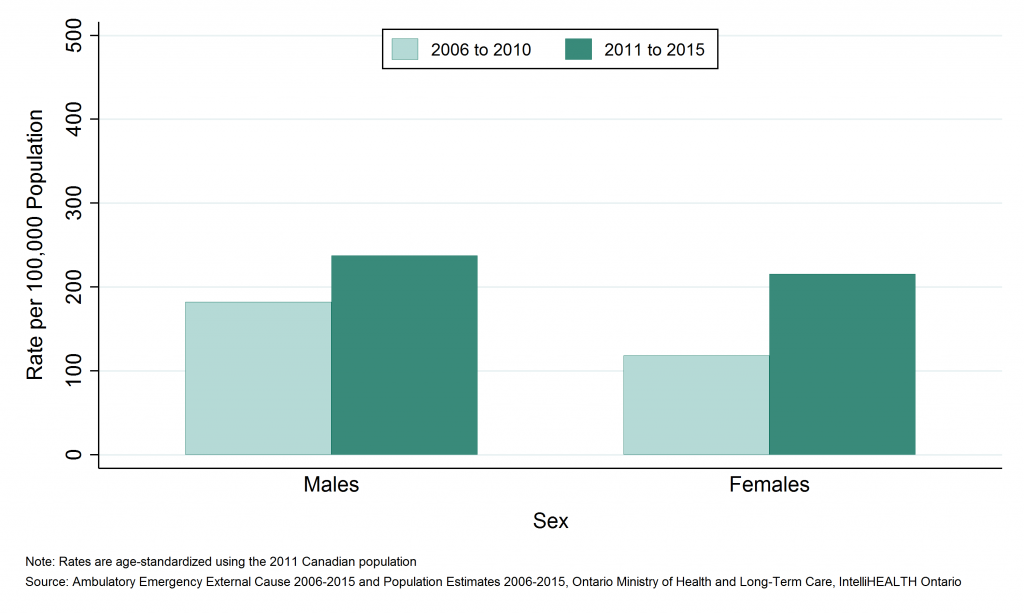
Table: Annual age-standardized rate of emergency department visits, concussions, by sex, SDHU, 2006 to 2010 and 2011 to 2015
| Sex | Rate per 100,000, 2006 to 2010 | Rate per 100,000, 2011 to 2015 |
| Males | 182.2 | 237.7 |
| Females | 118.5 | 215.5 |
Table: Annual number of emergency department visits, concussions, by sex, SDHU, 2006 to 2010 and 2011 to 2015
| Sex | Total Counts, 2006 to 2010 | Total Counts, 2011 to 2015 | Average Annual Counts, 2006 to 2010 | Average Annual Counts, 2011 to 2015 |
| Males | 921 | 1,151 | 184.2 | 230.2 |
| Females | 594 | 1,033 | 118.8 | 206.6 |
Emergency department (ED) visits due to concussions by age group
Key Findings:
- Among residents of the Sudbury & District Health Unit (SDHU) area, the 15 to 24 age group visited the emergency department (ED) due to concussions the most, with 704 ED visits between 2011 and 2015, or 141 ED visits per year on average.
- Between 2011 and 2015, the 10 to 14 age group had the highest ED visits rate due to concussions with 688 ED visits per 100,000 population per year.
- Rates of ED visits due to concussions are highest among youth and young adults aged 10 to 25. Rates then decrease with age.
- In the SDHU area, the ED visits rate due to concussions increased over time for most age groups between 2006 to 2010 and 2011 to 2015.
Notes:
- Recent increases in awareness of concussions, particularly in sports, may be resulting in an increase in concussion diagnoses beyond what might otherwise have occurred.
- Geographic areas and/or time periods in which there is less access to walk-in clinics and other alternatives to the local ED can be expected to have higher rates of injury-related ED visits than they would otherwise.
- Rates are age-standardized using the 2011 Canadian population.
- Data Source: Ambulatory Emergency External Cause 2006 to 2015 (extracted June 6, 2016) and Population Estimates 2006 to 2015 (extracted October 7, 2016), Ontario Ministry of Health and Long-Term Care, IntelliHEALTH Ontario.
Figure: Annual age-standardized rate of emergency department visits, concussions, by age group, SDHU, 2006 to 2010 and 2011 to 2015
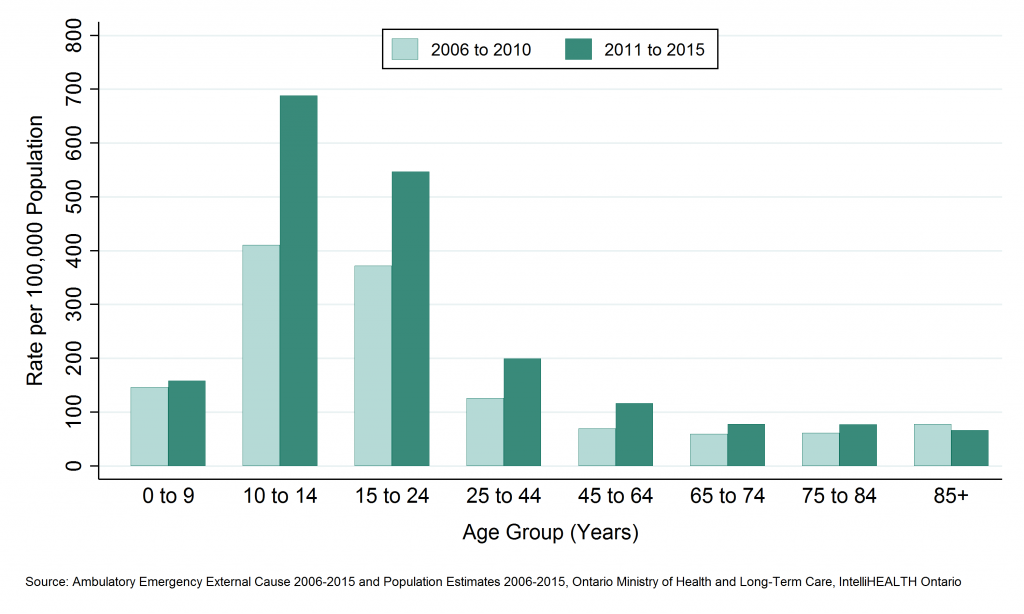
Table: Annual age-standardized rate of emergency department visits, concussions, by age group, SDHU, 2006 to 2010 and 2011 to 2015
| Age Group | Rate per 100000, 2006 to 2010 | Rate per 100000, 2011 to 2015 |
| 0 to 9 | 146.0 | 158.5 |
| 10 to 14 | 410.5 | 688.0 |
| 15 to 24 | 372.2 | 546.8 |
| 25 to 44 | 126.2 | 199.6 |
| 45 to 64 | 69.7 | 116.5 |
| 65 to 74 | 59.1 | 77.6 |
| 75 to 84 | 61.2 | 77.1 |
| 85+ | 78.0 | 66.1 |
Table: Annual number of emergency department visits, concussions, by age group, SDHU, 2006 to 2010 and 2011 to 2015
| Age Group | Total Counts, 2006 to 2010 | Total Counts, 2011 to 2015 | Average Annual Counts, 2006 to 2010 | Average Annual Counts, 2011 to 2015 |
| 0 to 9 | 144 | 152 | 28.8 | 30.4 |
| 10 to 14 | 248 | 355 | 49.6 | 71.0 |
| 15 to 24 | 495 | 704 | 99.0 | 140.8 |
| 25 to 44 | 327 | 488 | 65.4 | 97.6 |
| 45 to 64 | 207 | 354 | 41.4 | 70.8 |
| 65 to 74 | 50 | 76 | 10.0 | 15.2 |
| 75 to 84 | 32 | 42 | 6.4 | 8.4 |
| 85+ | 12 | 13 | 2.4 | 2.6 |
Deaths due to concussions by geographic region
Key Findings:
- Among residents of the Sudbury & District Health Unit (SDHU) area, there were no deaths due to concussions between 2007 and 2011.
This item was last modified on July 25, 2017