Falls among children, youth and adults (ages 0 to 64)
Injuries in this section are those due from a fall. This includes those resulting from jumping or diving into water causing injury other than drowning or submersion. This section excludes falls:
- resulting from an assault
- resulting from intentional self-harm
- from an animal
- in or from a burning building
- into fire
- into water (with drowning or submersion)
- into machinery in operation
- from a transport vehicle
Emergency department (ED) visits due to falls among children, youth and younger adults (ages 0 to 64) by geographic region
Key Findings:
- Among Sudbury & District Health Unit (SDHU) area residents aged 0 to 64, there were 4,681 emergency department (ED) visits for falls in 2015.
- In 2015, the ED visits rate for falls among adults in the SDHU area was 30 per 1,000 population per year.
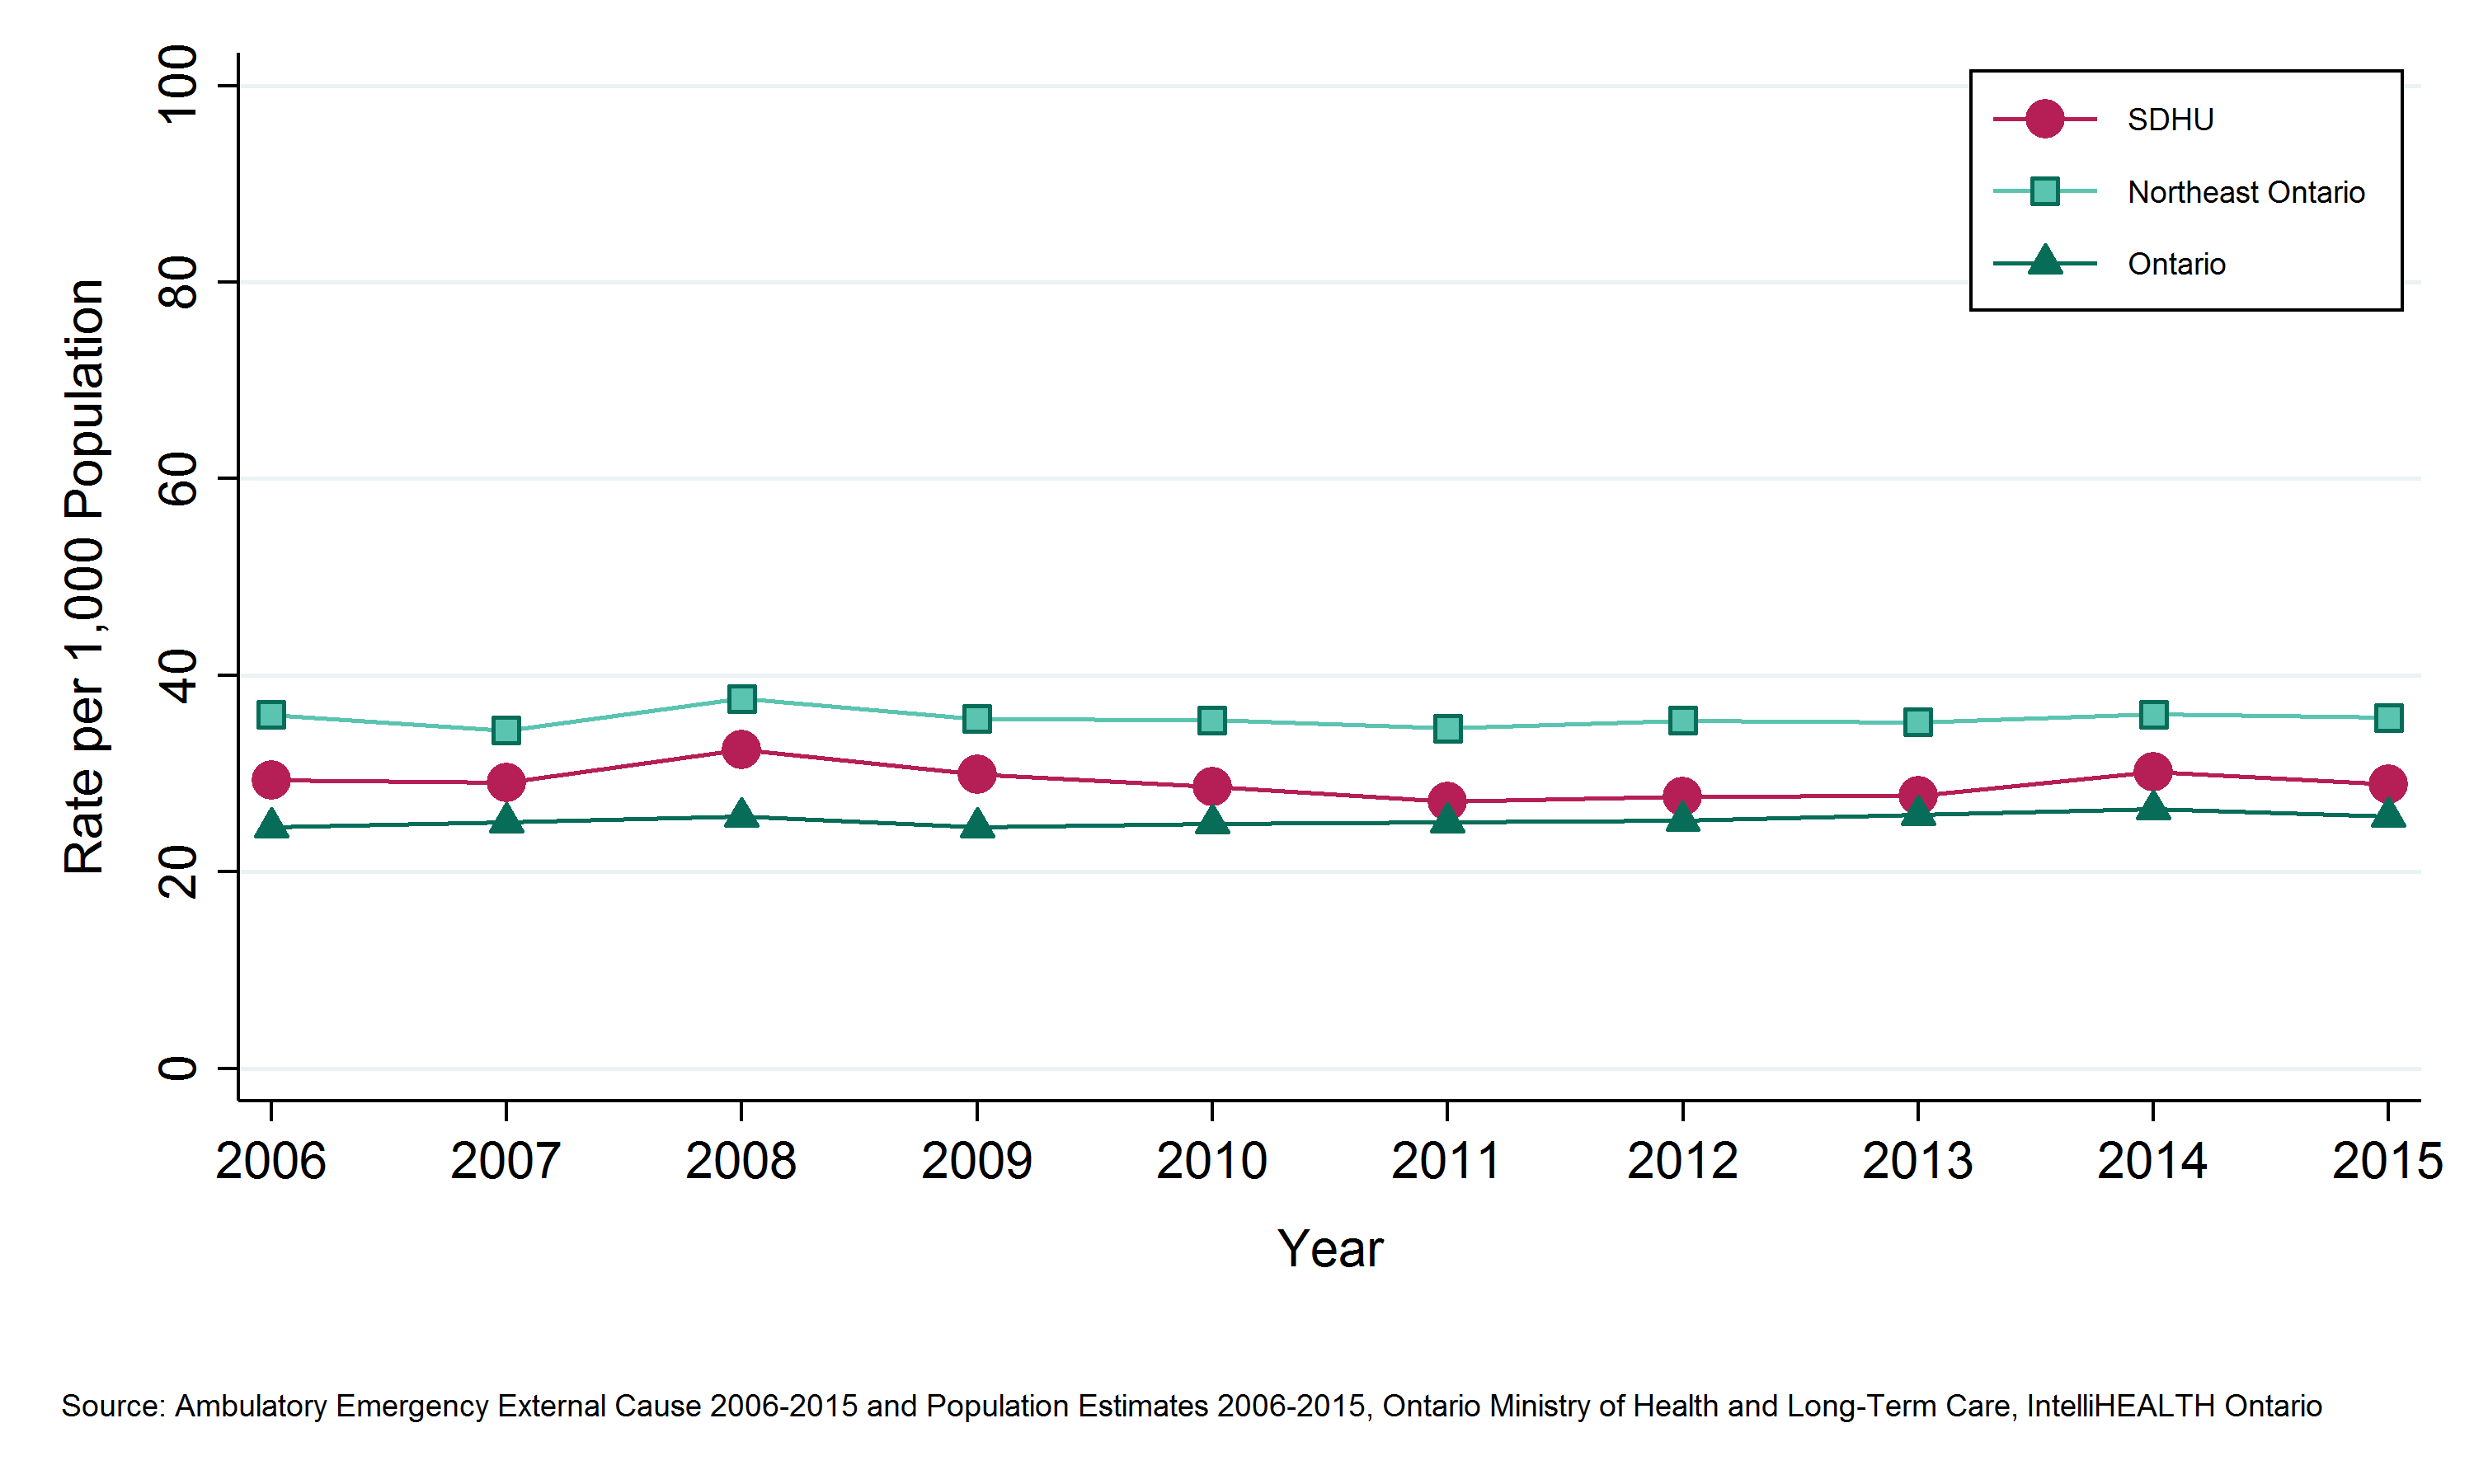
- The SDHU area rate of ED visits for falls in ages 0 to 64 has consistently been lower than that of northeastern Ontario, and similar to the rate for Ontario overall.
- Between 2006 and 2015, the ED visits rate for falls among adults in the SDHU area remained stable over time.
Notes:
- Geographic areas and/or time periods in which there is less access to walk-in clinics and other alternatives to the local ED can be expected to have higher rates of injury-related ED visits than they would otherwise.
- Data Source: Ambulatory Emergency External Cause 2006 to 2015 (extracted June 6, 2016) and Population Estimates 2006 to 2015 (extracted October 7, 2016), Ontario Ministry of Health and Long-Term Care, IntelliHEALTH Ontario.
Figure: Annual rate of emergency department visits, falls, ages 0 to 64, by geographic region, 2006 to 2015
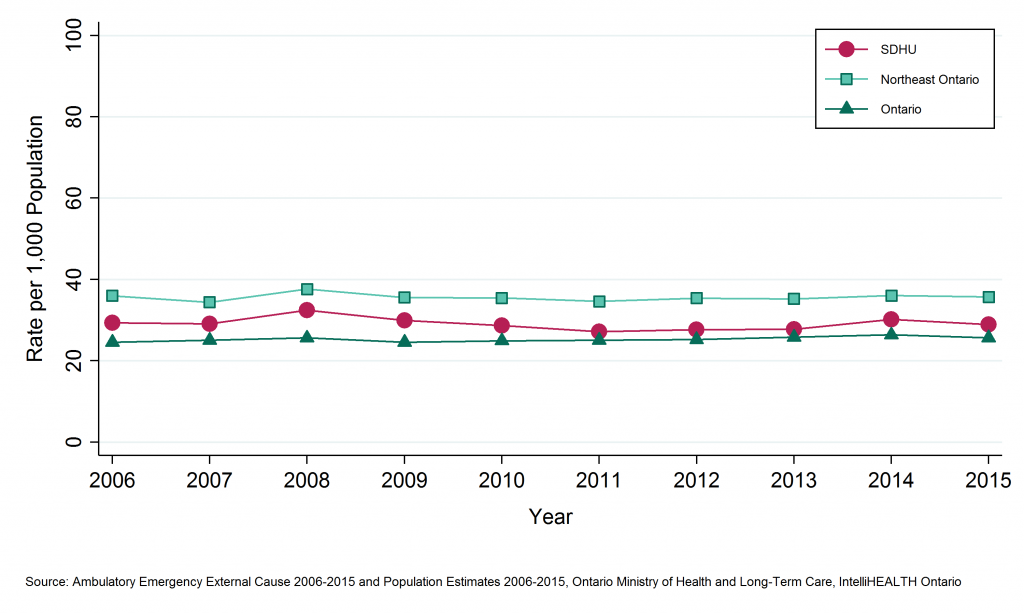
Table: Annual rate of emergency department visits, falls, ages 0 to 64, by geographic region, 2006 to 2015
| Geographic Region | 2006 | 2007 | 2008 | 2009 | 2010 | 2011 | 2012 | 2013 | 2014 | 2015 |
| SDHU | 29.4 | 29.1 | 32.4 | 29.9 | 28.6 | 27.1 | 27.7 | 27.7 | 30.2 | 28.9 |
| Northeast | 36.0 | 34.4 | 37.6 | 35.6 | 35.4 | 34.6 | 35.4 | 35.2 | 36.0 | 35.7 |
| Ontario | 24.5 | 25.1 | 25.6 | 24.5 | 24.9 | 25.0 | 25.2 | 25.8 | 26.4 | 25.6 |
Table: Annual number of emergency department visits, falls, ages 0 to 64, by geographic region, 2006 to 2015
| Geographic Region | 2006 | 2007 | 2008 | 2009 | 2010 | 2011 | 2012 | 2013 | 2014 | 2015 |
| SDHU | 4,997 | 4,943 | 5,518 | 5,073 | 4,825 | 4,547 | 4,606 | 4,579 | 4,938 | 4,681 |
| Northeast | 17,328 | 16,484 | 17,964 | 16,878 | 16,738 | 16,244 | 16,464 | 16,196 | 16,388 | 16,062 |
| Ontario | 270,221 | 277,563 | 285,520 | 275,312 | 281,899 | 284,827 | 288,343 | 296,612 | 304,397 | 297,000 |
Emergency department (ED) visits due to falls among children, youth and younger adults (ages 0 to 64) by Greater Sudbury and outlying areas
Key Findings:
- Between 2011 and 2015, there were a total of 18,150 emergency department (ED) visits for falls among residents of Greater Sudbury aged 0 to 64, and 6,428 falls among residents of the SDHU district office areas aged 0 to 64, an average of 3,385 and 1,286 per year, respectively.
- The rate of ED visits for falls was 25 per 1,000 population per year in Greater Sudbury and 47 per 1,000 population per year in the SDHU district office areas between 2011 and 2015.
- The rate of ED visits for falls in Greater Sudbury has been consistently lower than the rate in the SDHU district office areas.
- The rates of ED visits for falls have remained stable in both regions between 2006 to 2010 and 2011 to 2015.
Notes:
- Geographic areas and/or time periods in which there is less access to walk-in clinics and other alternatives to the local ED can be expected to have higher rates of injury-related ED visits than they would otherwise.
- Data Source: Ambulatory Emergency External Cause 2006 to 2015 (extracted June 6, 2016) and Population Estimates 2006 to 2015 (extracted October 7, 2016), Ontario Ministry of Health and Long-Term Care, IntelliHEALTH Ontario.
Figure: Annual rate of emergency department visits, falls, ages 0 to 64, by Greater Sudbury and outlying areas, 2006 to 2010 and 2011 to 2015
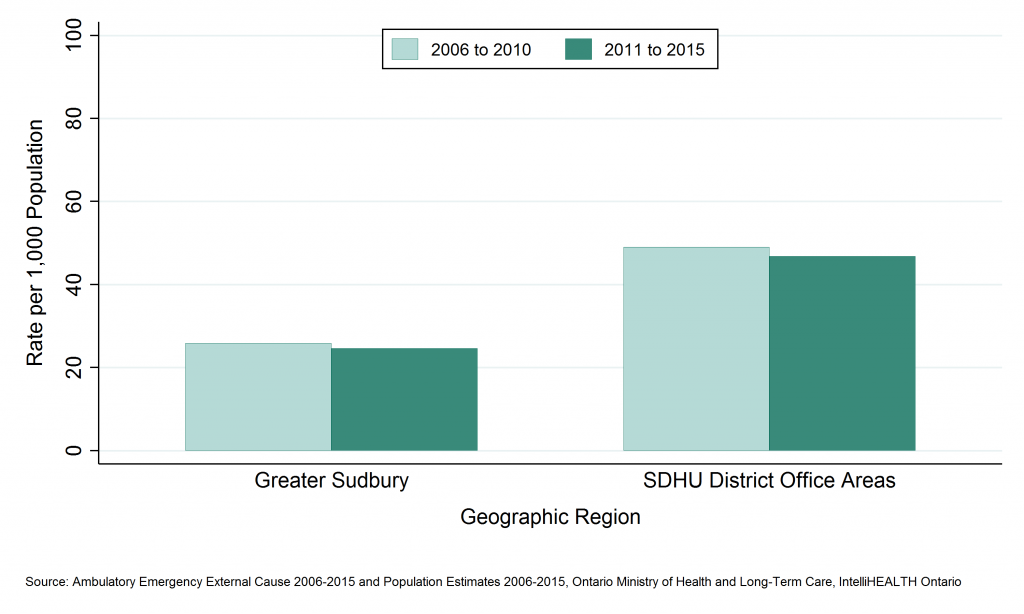
Table: Annual rate of emergency department visits, falls, ages 0 to 64, by Greater Sudbury and outlying areas, 2006 to 2010 and 2011 to 2015
| Geographic Region | Rate per 1000 2006 to 2010 | Rate per 1000 2011 to 2015 |
| Greater Sudbury | 25.9 | 24.6 |
| SDHU District Office Areas | 49.0 | 46.8 |
Table: Annual number of emergency department visits, falls, ages 0 to 64, by Greater Sudbury and outlying areas, 2006 to 2010 and 2011 to 2015
| Geographic Region | Total Counts, 2006 to 2010 | Total Counts, 2011 to 2015 | Average Annual Counts, 2006 to 2010 | Average Annual Counts, 2011 to 2015 |
| Greater Sudbury | 18,150 | 16,923 | 3,630.0 | 3,384.6 |
| SDHU District Office Areas | 7,206 | 6,428 | 1,441.2 | 1,285.6 |
Emergency department (ED) visits due to falls among children, youth and younger adults (ages 0 to 64) by sex
Key Findings:
- Among Sudbury & District Health Unit (SDHU) area residents aged 0 to 64, between 2011 and 2015 there were 11,685 emergency department (ED) visits for falls among males, and 11,655 for falls among females, an average of 2,339 and 2,331 per year, respectively.
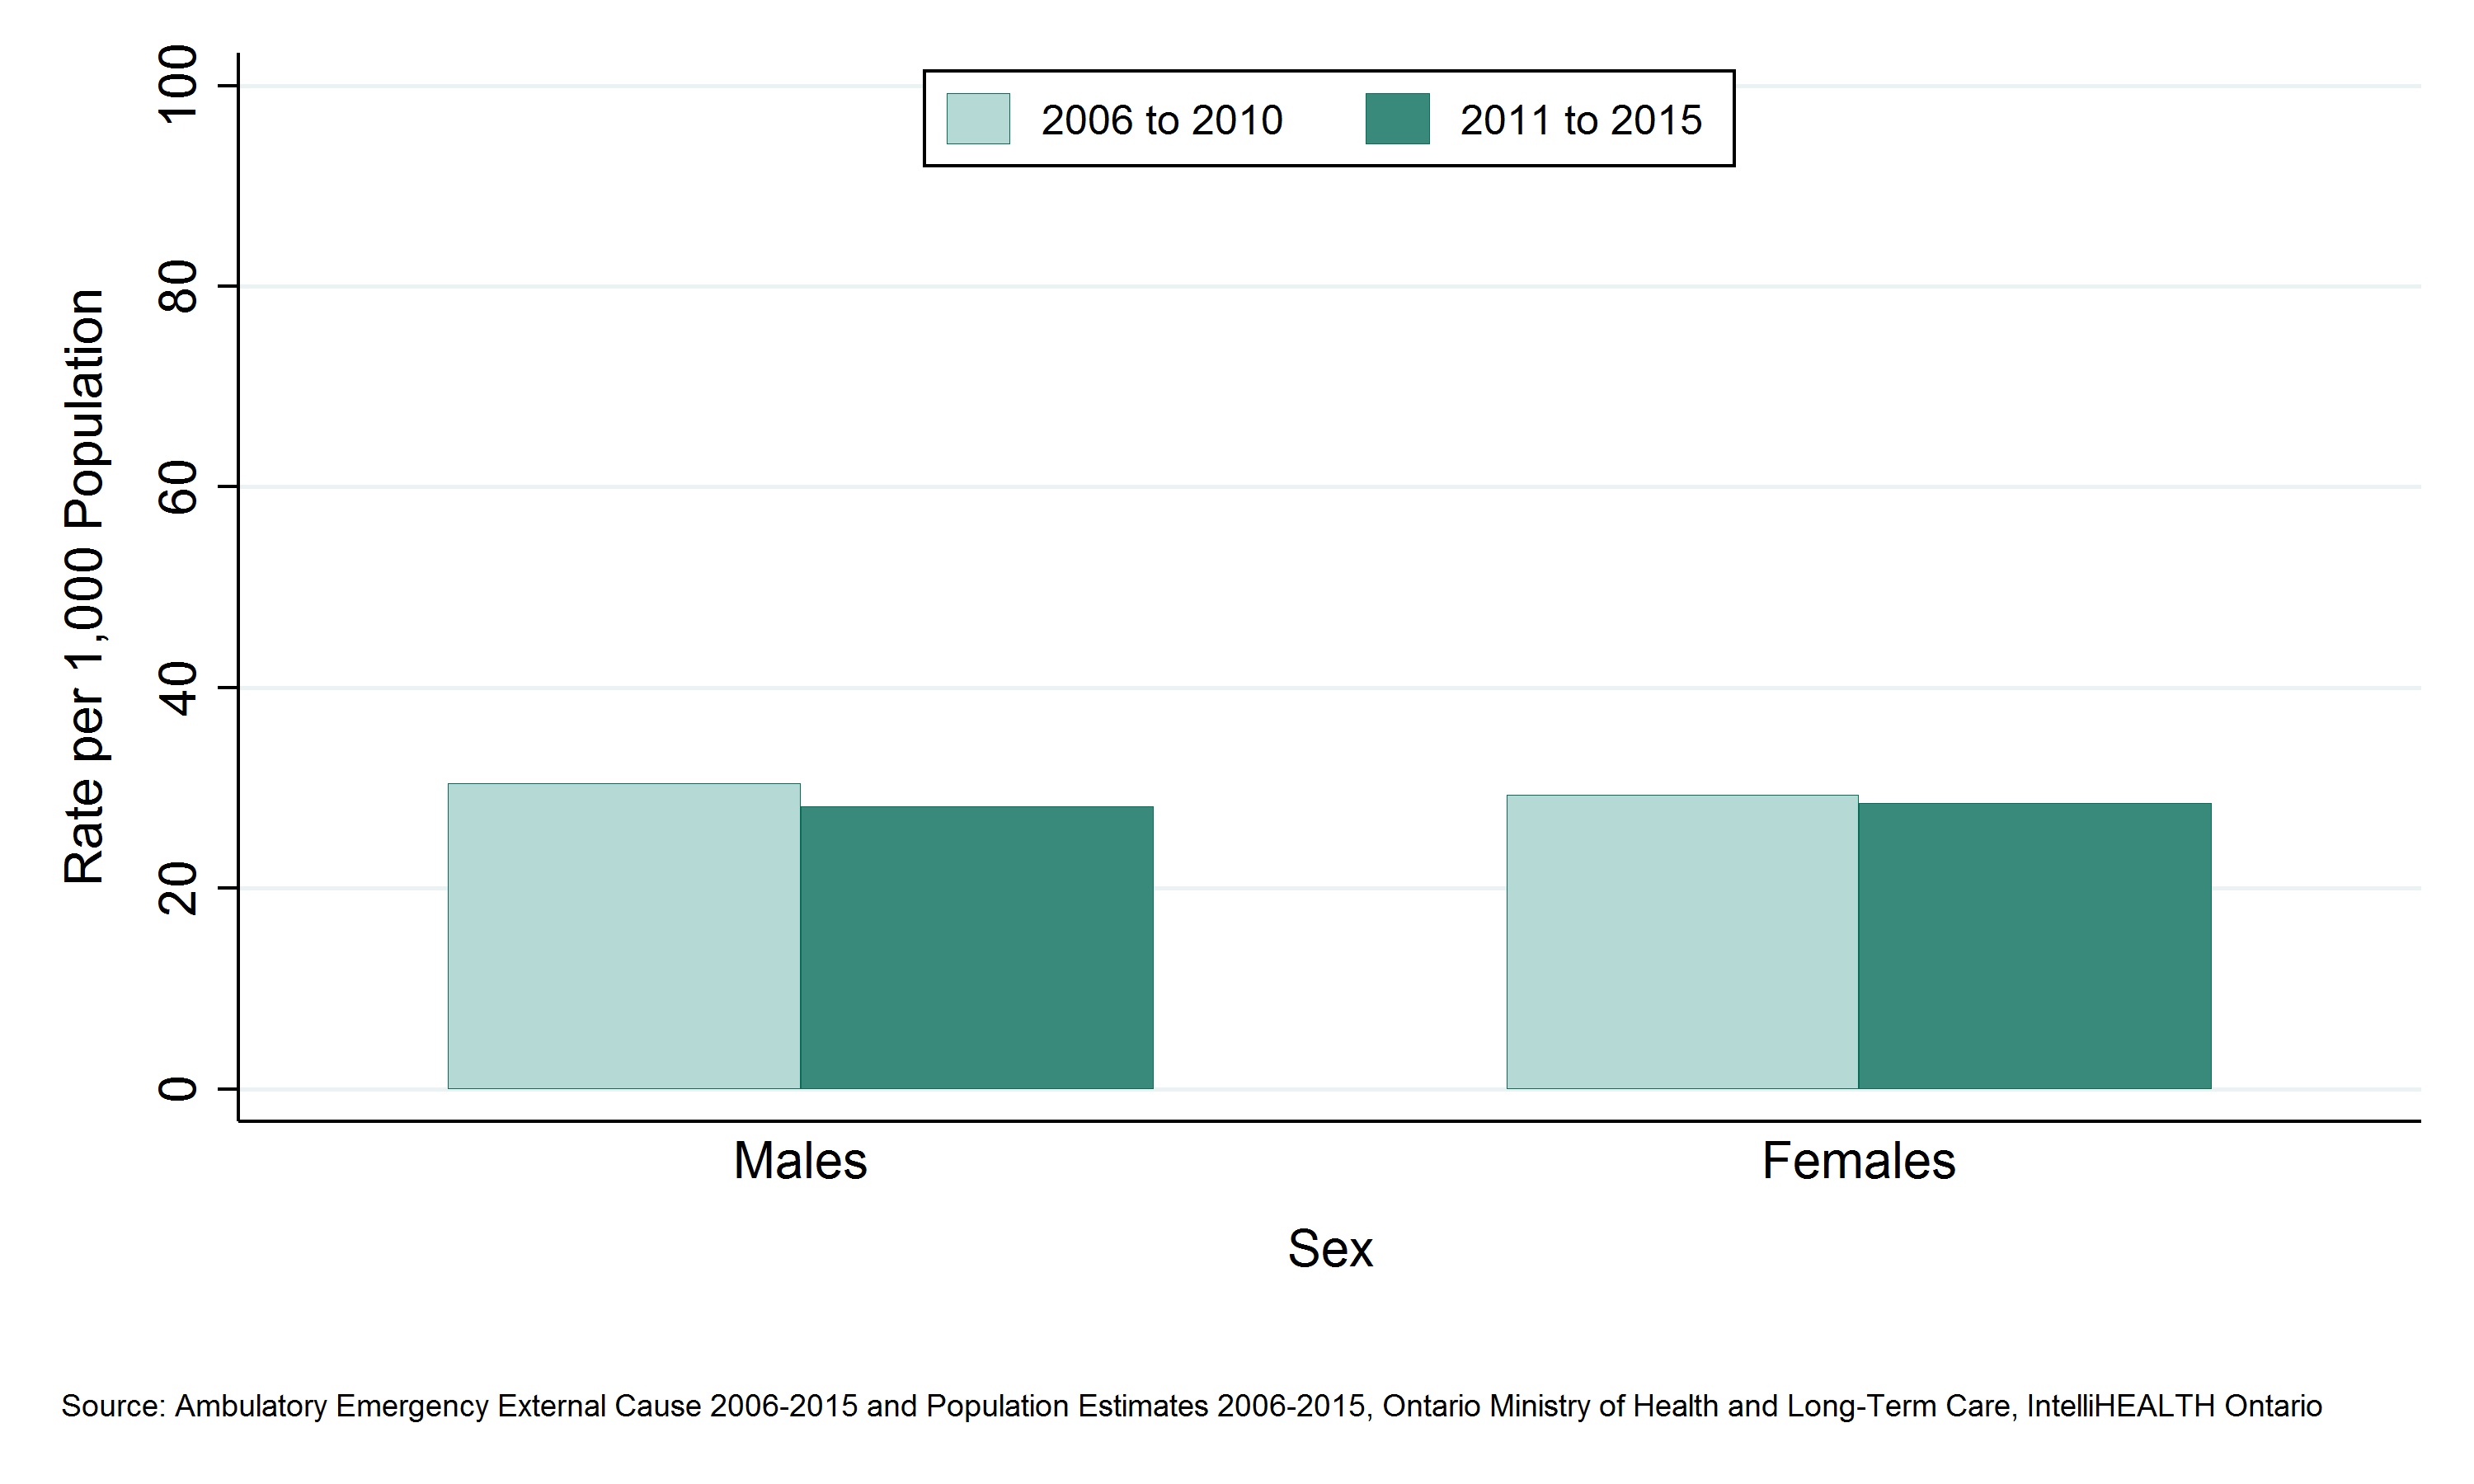
- The rate of ED visits for falls was 28 per 1,000 males aged 0 to 64 and 29 per 1,000 females aged 0 to 64 in the SDHU area between 2011 and 2015.
- The rate of ED visits for falls among males has been similar to the rate among females.
- Among both males and females aged 0 to 64 in the SDHU area, the rates of ED visits for falls have remained stable over time between 2006 to 2010 and 2011 to 2015.
Notes:
- Geographic areas and/or time periods in which there is less access to walk-in clinics and other alternatives to the local ED can be expected to have higher rates of injury-related ED visits than they would otherwise.
- Data Source: Ambulatory Emergency External Cause 2006 to 2015 (extracted June 6, 2016) and Population Estimates 2006 to 2015 (extracted October 7, 2016), Ontario Ministry of Health and Long-Term Care, IntelliHEALTH Ontario.
Figures: Annual rate of emergency department visits, falls, ages 0 to 64, by sex, SDHU, 2006 to 2010 and 2011 to 2015
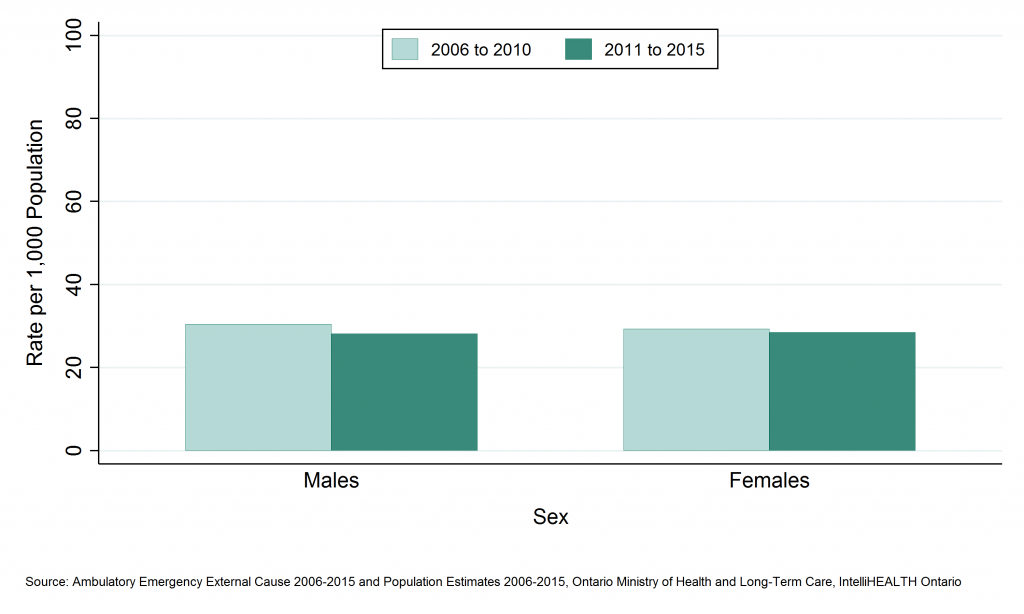
Table: Annual rate of emergency department visits, falls, ages 0 to 64, by sex, SDHU, 2006 to 2010 and 2011 to 2015
| Sex | Rate per 100,000, 2006 to 2010 | Rate per 100,000, 2011 to 2015 |
| Males | 30.5 | 28.2 |
| Females | 29.3 | 28.5 |
Table: Annual number of emergency department visits, falls, ages 0 to 64, by sex, SDHU, 2006 to 2010 and 2011 to 2015
| Sex | Total Counts, 2006 to 2010 | Total Counts, 2011 to 2015 | Average Annual Counts, 2006 to 2010 | Average Annual Counts, 2011 to 2015 |
| Males | 13,027 | 11,695 | 2,605.4 | 2,339.0 |
| Females | 12,329 | 11,655 | 2,465.8 | 2,331.0 |
Emergency department (ED) visits due to falls among children, youth and younger adults (ages 0 to 64) by age group
Key Findings:
- Among residents of the Sudbury & District Health Unit (SDHU) area aged 0 to 64, the 25 to 44 year age group visited the emergency department (ED) the most for falls, with 5,302 ED visits between 2011 and 2015, or 1,060 ED visits per year on average.
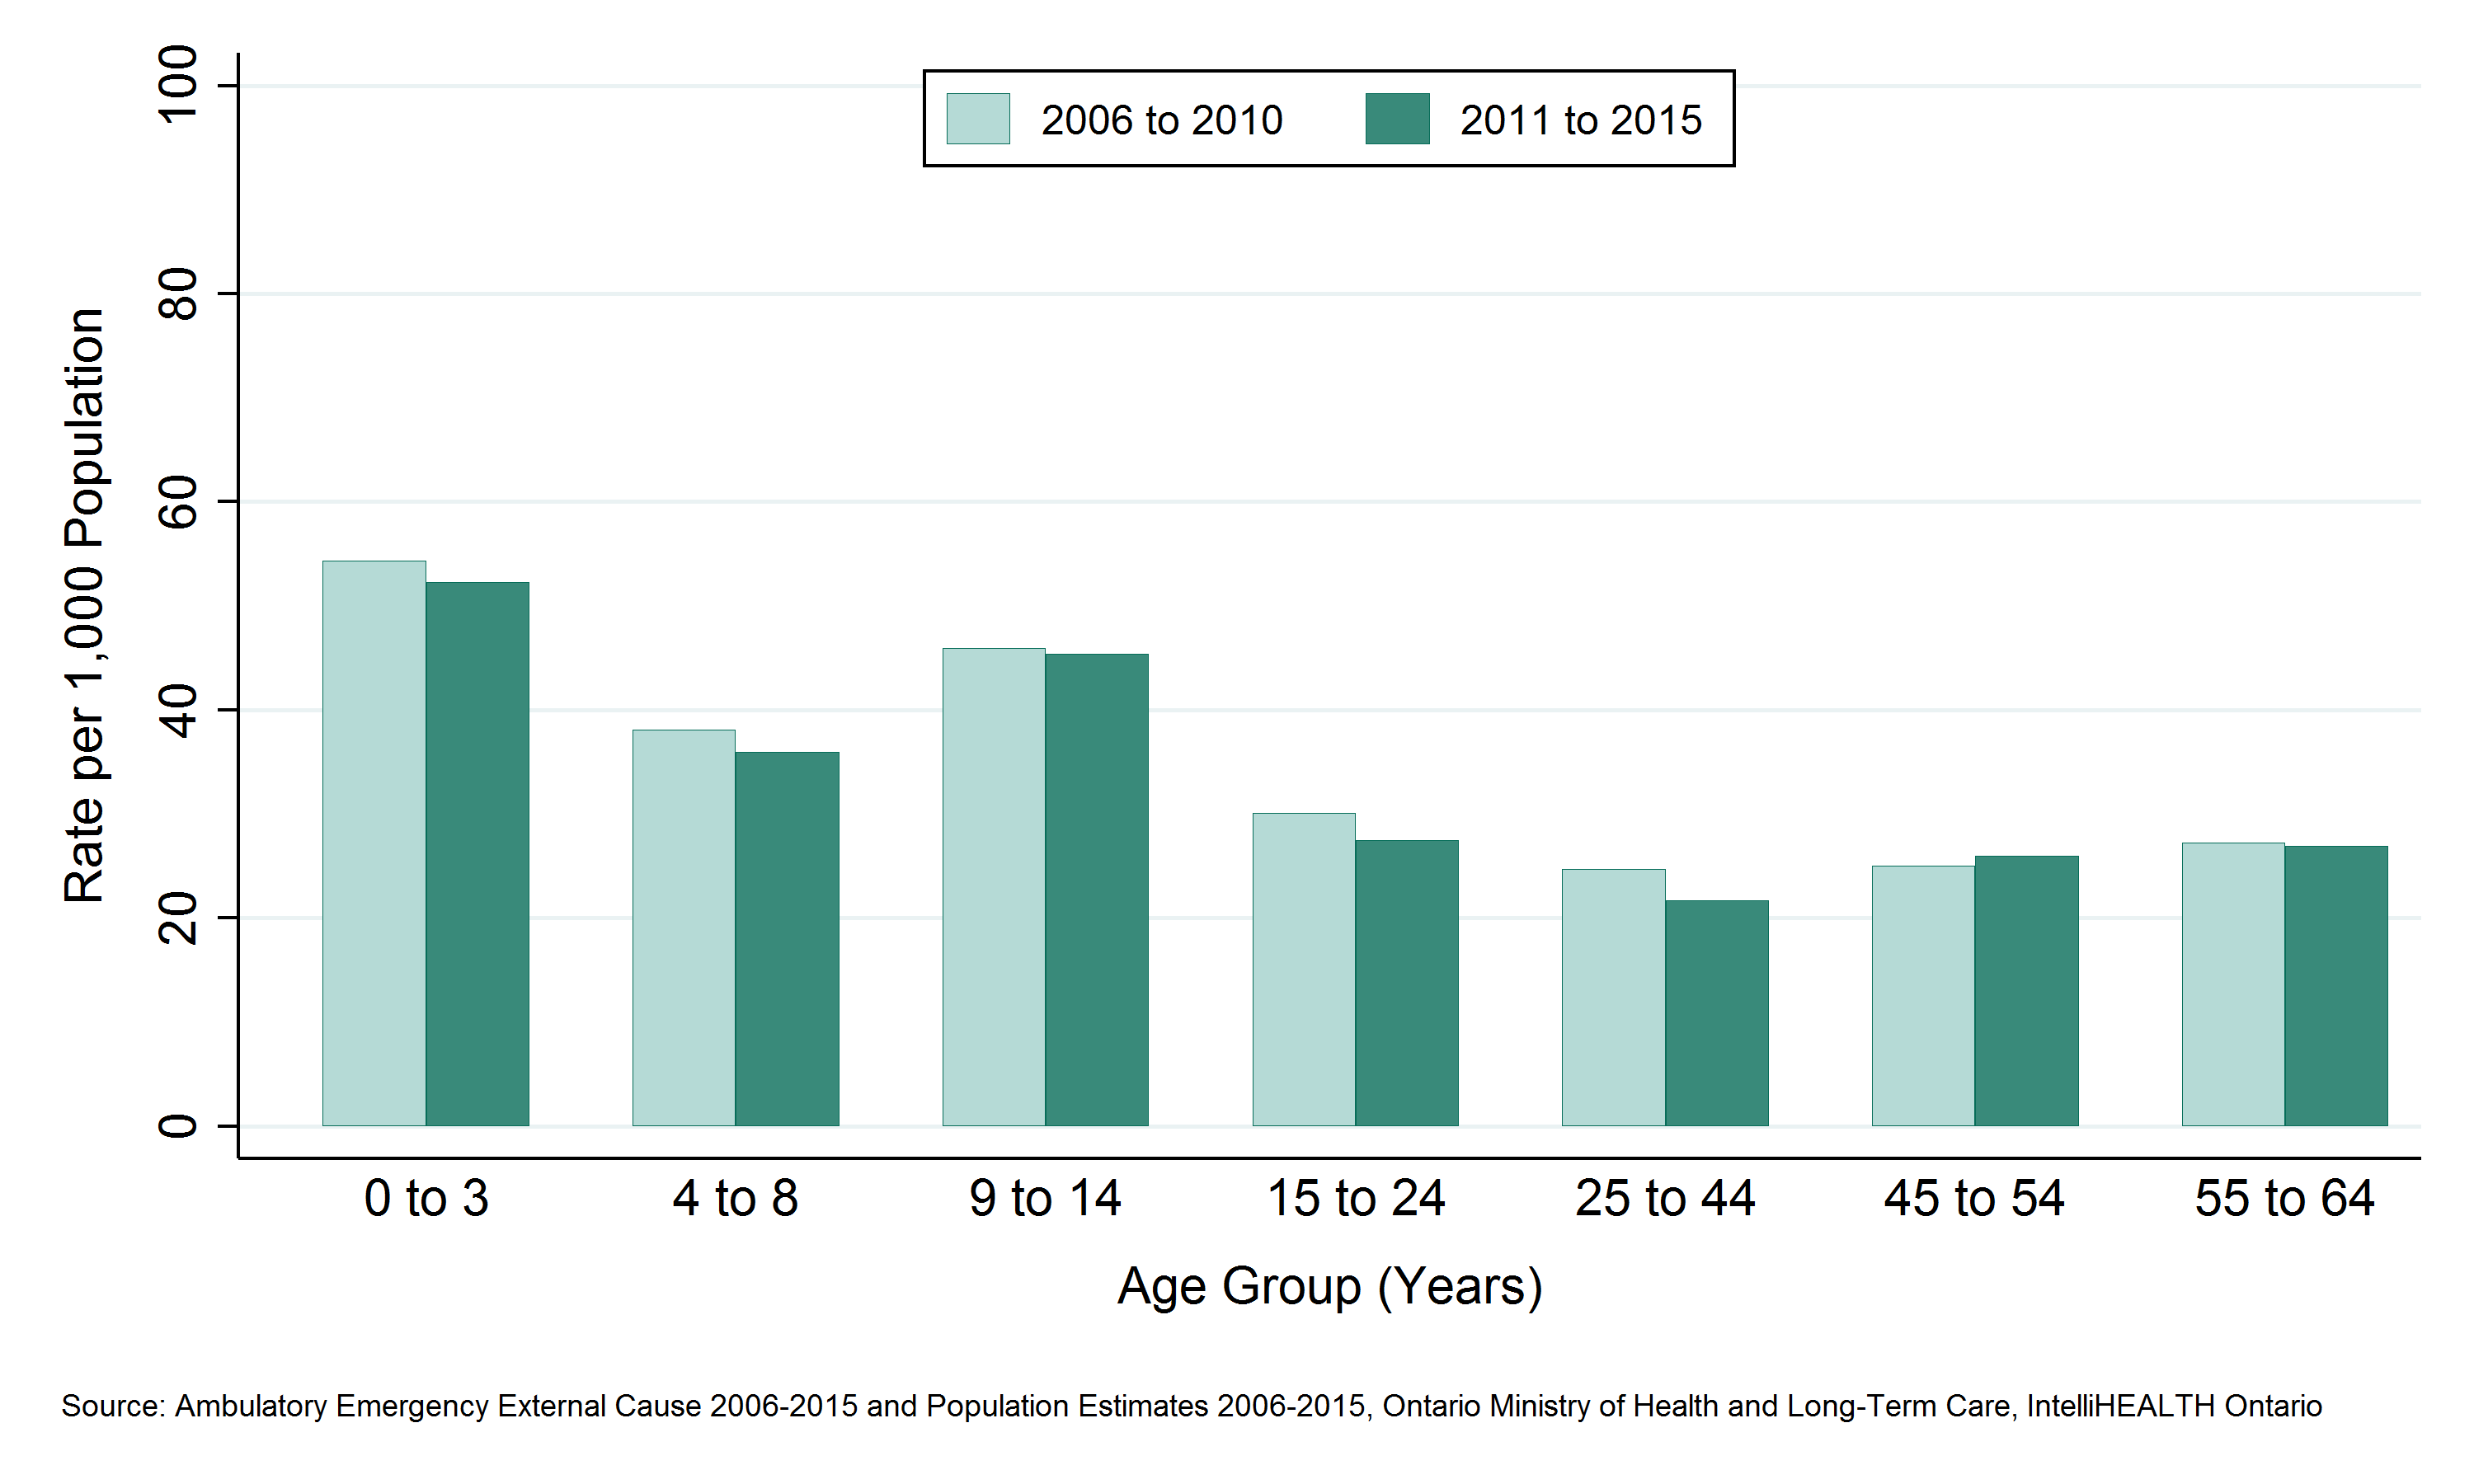
- The 0 to 3 year age group had the highest ED visits rate for falls with 52 ED visits per 1,000 population per year.
- Rates of ED visits for falls decrease after childhood and remain stable throughout adulthood until the age of 64 years.
- In the SDHU area, the ED visits rate for falls remained stable in all age groups less than 65 years between 2006 to 2010 and 2011 to 2015.
Notes:
- Data Source: Ambulatory Emergency External Cause 2006 to 2015 (extracted June 6, 2016) and Population Estimates 2006 to 2015 (extracted October 7, 2016), Ontario Ministry of Health and Long-Term Care, IntelliHEALTH Ontario.
Figure: Annual rate of emergency department visits, falls, ages 0 to 64, by age group, SDHU, 2006 to 2010 and 2011 to 2015

Table: Annual rate of emergency department visits, falls, ages 0 to 64, by age group, SDHU, 2006 to 2010 and 2011 to 2015
| Age Group | Rate per 1000, 2006 to 2010 | Rate per 1000, 2011 to 2015 |
| 0 to 3 | 54.4 | 52.2 |
| 4 to 8 | 38.1 | 35.9 |
| 9 to 14 | 46.0 | 45.4 |
| 15 to 24 | 30.1 | 27.5 |
| 25 to 44 | 24.7 | 21.7 |
| 45 to 54 | 25.0 | 25.9 |
| 55 to 64 | 27.2 | 26.9 |
Table: Annual number of emergency department visits, falls, ages 0 to 64, by age group, SDHU, 2006 to 2010 and 2011 to 2015
| Age Group | Total Counts, 2006 to 2010 | Total Counts, 2011 to 2015 | Average Annual Counts, 2006 to 2010 | Average Annual Counts, 2011 to 2015 |
| 0 to 3 | 2,057 | 1,947 | 411.4 | 389.4 |
| 4 to 8 | 1,905 | 1,759 | 381.0 | 351.8 |
| 9 to 14 | 3,273 | 2,782 | 654.6 | 556.4 |
| 15 to 24 | 4,001 | 3,538 | 800.2 | 707.6 |
| 25 to 44 | 6,395 | 5,302 | 1,279.0 | 1,060.4 |
| 45 to 54 | 4,129 | 4,089 | 825.8 | 817.8 |
| 55 to 64 | 3,596 | 3,934 | 719.2 | 786.8 |
Deaths due to falls among children, youth and younger adults (ages 0 to 64) by geographic region
Key Findings:
- There were 10 fall-related deaths among Sudbury & District Health Unit (SDHU) area adults aged 0 to 64 between 2007 and 2011, and average of 2 per year.
- Between 2002 and 2011, the mortality rate from falls among individuals aged 0 to 64 residing in the SDHU area was 1 death per 100,000 population per year.
- The mortality rate for falls in the SDHU area has been similar to the rate in northeastern Ontario and Ontario overall.
- Between 2002 to 2006 and 2007 to 2011, the mortality rate for falls in the SDHU remained stable.
Notes:
- Data Source: Ontario Mortality Data 2002 to 2011 (extracted June 6, 2016) and Population Estimates 2002 to 2011 (extracted October 7, 2016), Ontario Ministry of Health and Long-Term Care, IntelliHEALTH Ontario.
Figure: Annual mortality rate, falls, ages 0 to 64, by geographic region, 2002 to 2006 and 2007 to 2011
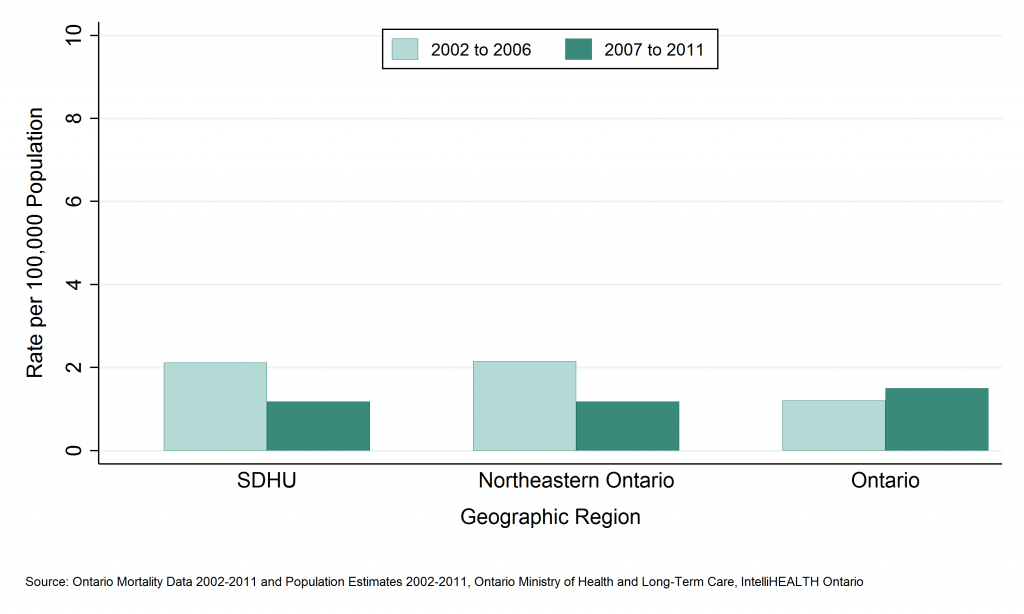
Table: Annual mortality rate, falls, ages 0 to 64, by geographic region, 2002 to 2006 and 2007 to 2011
| Geographic Region | Rate per 100,000 2002 to 2006 | Rate per 100,000 2007 to 2011 |
| SDHU | 2.1 | 1.2 |
| Northeast | 2.1 | 1.2 |
| Ontario | 1.2 | 1.5 |
Table: Annual number of deaths, falls, ages 0 to 64, by geographic region, 2002 to 2006 and 2007 to 2011
| Geographic Region | Total Counts 2002 to 2006 | Total Counts 2007 to 2011 | Average Annual Counts, 2002 to 2006 | Average Annual Counts, 2007 to 2011 |
| SDHU | 18 | 10 | 3.6 | 2.0 |
| Northeast | 52 | 28 | 10.4 | 5.6 |
| Ontario | 651 | 841 | 130.2 | 168.2 |
Potential years of life lost (PYLL) due to falls among children, youth and younger adults (ages 0 to 64) by geographic region
Key Findings:
- Between 2002 and 2011, Sudbury & District Health Unit (SDHU) area residents aged 0 to 64 years lost 250 years of potential life due to deaths from falls before the age of 75, an average of 50 per year.
- The rate of potential years of life lost (PYLL) in the SDHU area due to falls among individuals aged 0 to 64 was 30 per 100,000 population per year.
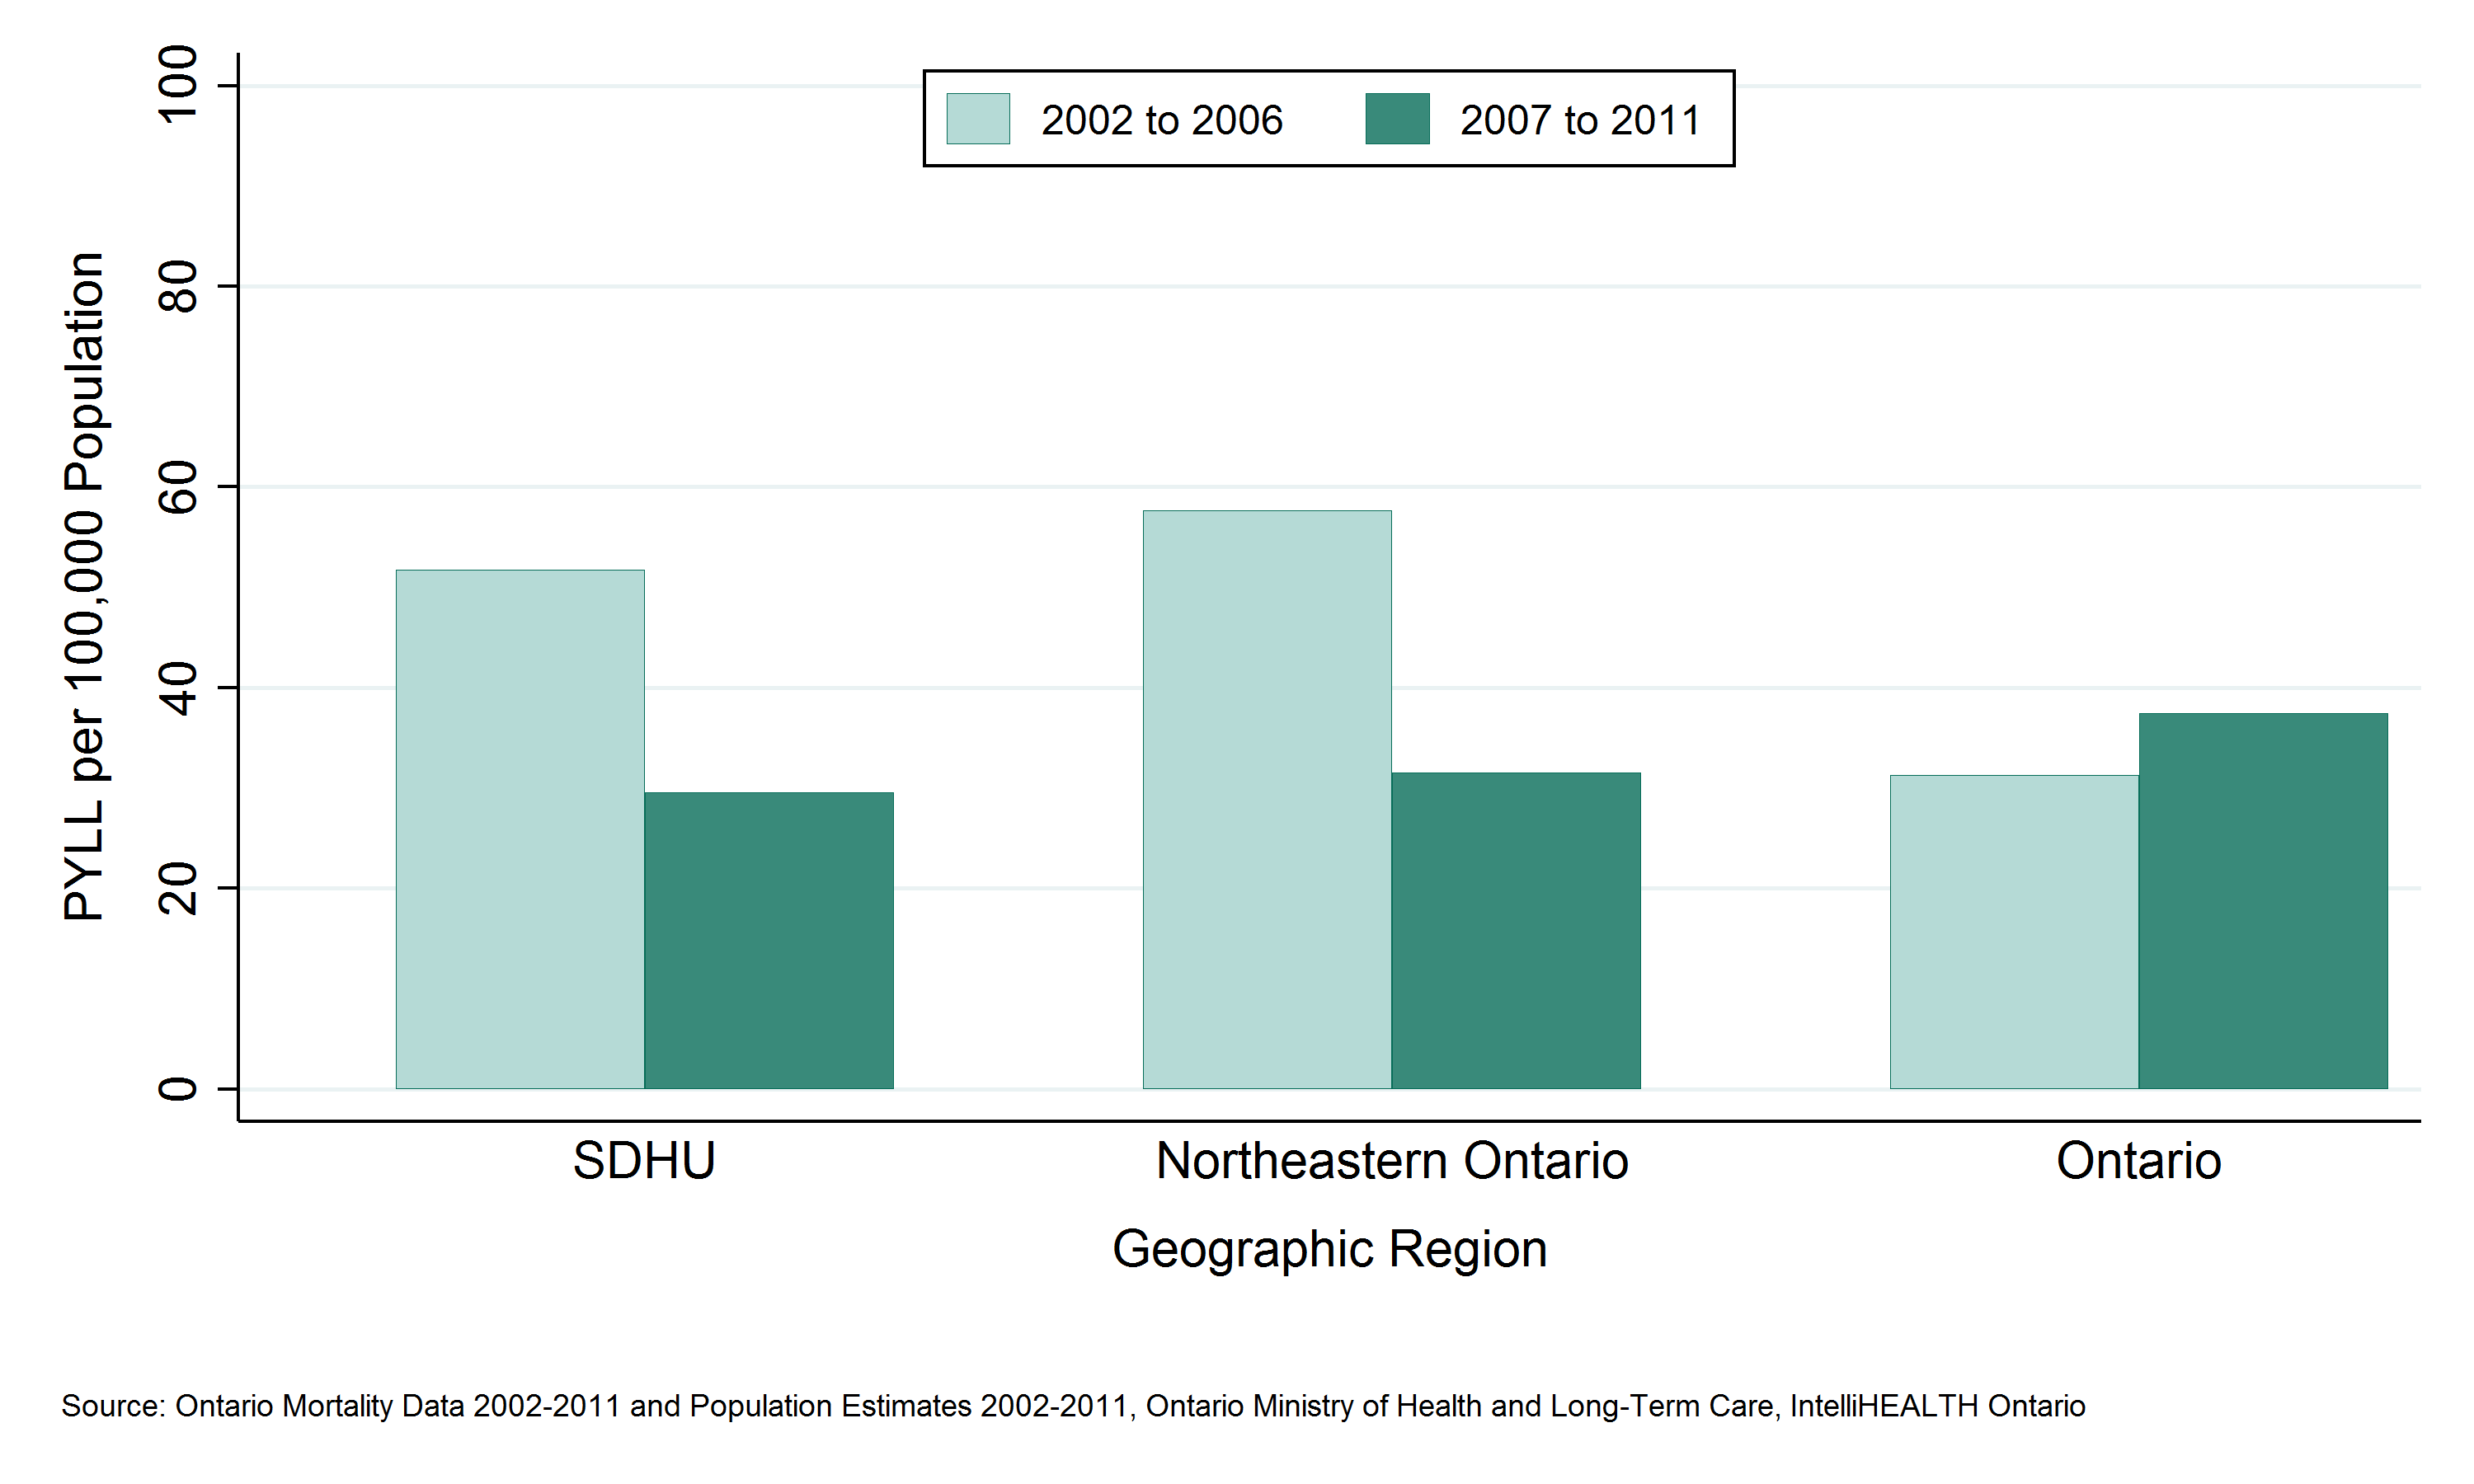
- The rate of PYLL due to falls among residents of the SDHU area aged 0 to 64 years has been similar the rate in northeastern Ontario, and between 2007 and 2011 was similar to the rate in Ontario overall.
- Between 2002 to 2006 and 2007 to 2011, the rate of PYLL due to falls among SDHU area residents aged 0 to 64 area decreased.
Notes:
- Data Source: Ontario Mortality Data 2002 to 2011 (extracted June 6, 2016) and Population Estimates 2002 to 2011 (extracted October 7, 2016), Ontario Ministry of Health and Long-Term Care, IntelliHEALTH Ontario.
Figure: Annual rate of potential years of life lost (PYLL), falls, ages 0 to 64, by geographic region, 2002 to 2006 and 2007 to 2011

Table: Annual rate of potential years of life lost (PYLL), falls, ages 0 to 64, by geographic region, 2002 to 2006 and 2007 to 2011
| Geographic Region | Rate per 100,000, 2002 to 2006 | Rate per 100,000, 2007 to 2011 |
| SDHU | 51.8 | 29.6 |
| Northeast | 57.7 | 31.5 |
| Ontario | 31.3 | 37.5 |
Table: Annual number of potential years of life lost (PYLL), falls, ages 0 to 64, by geographic region, 2002 to 2006 and 2007 to 2011
| Geographic Region | Total PYLL, 2002 to 2006 | Total PYLL, 2007 to 2011 | Average Annual Counts, 2002 to 2006 | Average Annual Counts, 2007 to 2011 |
| SDHU | 440 | 250 | 88.0 | 50.0 |
| Northeast | 1,397 | 748 | 279.4 | 149.6 |
| Ontario | 16,899 | 21,030 | 3,379.8 | 4,206.0 |
This item was last modified on March 17, 2025